ahngook pharm 001540 Algorithm Investment Report
•
0 likes•52 views

ahngook pharm 001540 Algorithm Investment Report
![[Price for scheduled purchasing]
Arbitrarily made
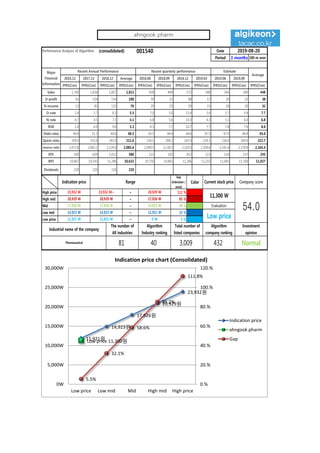
Algorithm stocks Trading Strategies (consolidated) 001540 Date
Period
Gap
(Indication /
stock)
Color
low price 11,921 W 11,921 W ~ 0 W 5 % -60,109 W -5
Low mid 14,923 W 14,923 W ~ 11,921 W 32 % -350,994 W -24
Mid 17,926 W 17,926 W ~ 14,923 W 59 % -641,880 W -36
High mid 20,929 W 20,929 W ~ 17,926 W 85 % -932,765 W -45
Suggested Purchase
Amount 1,094,592 W
Number of stocks
purchased 97
Indication price Range Buying / Selling Buying / Selling [Stocks]
High price 23,932 W 23,932 W~ ~ 20,929 W 112 % -1,223,651 W All selling
2019-08-20
3 months
Current stock price Evaluation
Stock price rise
probability score
Investment opinion Prospective purchase amount
11,300 W Low price 61.3 Normal 2,000,000 W
31.4 35.5 48.2 18.8 30.9 39.4
2019.03.26 2019.04.23 2019.05.23 2019.06.21 2019.07.19 2019.08.19
Stock price rise
probability score
A Sector 47.5 46.9 48.1 54.1 41.0 44.3
61.3B Sector 15.4 24.2 48.3 54.1 20.8 34.6
Total average
2019.05.23 2019.06.21 2019.07.19 2019.08.19
Total of
increase rate
Total score
A Sector -1 % 2 % 11 % -32 % 7 %
-12 % 54.7B Sector 36 % 50 % 11 % -160 % 40 %
Total average 12 % 26 % -157 % 39 % 22 %
2019.04.23
47 47 48
54
41
44
15
24
48
54
21
35
31
36
48
19
31
39
0
10
20
30
40
50
60
2019.03.26 2019.04.23 2019.05.23 2019.06.21 2019.07.19 2019.08.19
Stock price rise probability score
A sector
B sector
Total average
-1% 2% 11%
-32%
7%
36%
50%
11%
-160%
40%
12%
26%
-157%
39%
22%
-200%
-150%
-100%
-50%
0%
50%
100%
2019.04.23 2019.05.23 2019.06.21 2019.07.19 2019.08.19
Increase rate of stock price rise
A sector
B sector
Total average
ahngook pharm](data:image/gif;base64,R0lGODlhAQABAIAAAAAAAP///yH5BAEAAAAALAAAAAABAAEAAAIBRAA7)
Recommended
Recommended
More Related Content
What's hot
What's hot (20)
Similar to ahngook pharm 001540 Algorithm Investment Report
Similar to ahngook pharm 001540 Algorithm Investment Report (20)
More from 알고리즘 기업분석 컨설팅-알기컨,algikeon
More from 알고리즘 기업분석 컨설팅-알기컨,algikeon (20)
Recently uploaded
Recently uploaded (20)
ahngook pharm 001540 Algorithm Investment Report
- 1. Performance Analysis of Algorithm (consolidated) 001540 Date Period 3 months 100-m won 2016.12 2017.12 2018.12 Average 2018.06 2018.09 2018.12 2019.03 2019.06 2019.09 IFRS(Con) IFRS(Con) IFRS(Con) IFRS(Con) IFRS(Con) IFRS(Con) IFRS(Con) IFRS(Con) IFRS(Con) IFRS(Con) IFRS(Con) Sales 1,740 1,836 1,857 1,811 428 444 572 348 344 340 448 O-profit 42 104 154 100 30 22 88 12 20 32 38 N-income 13 82 132 76 29 25 59 15 18 20 32 O-rate 2.4 5.7 8.3 5.5 7.0 5.0 15.4 3.4 5.7 9.4 7.7 N-rate 0.7 4.5 7.1 4.1 6.8 5.6 10.3 4.3 5.1 6.0 6.8 ROE 1.0 6.0 9.0 5.3 8.3 7.7 10.7 7.7 7.8 7.9 8.6 Debt-ratio 49.4 51.3 44.6 48.5 43.5 44.4 44.6 47.5 47.9 48.4 45.0 Quick-ratio 199.0 193.8 242.0 211.6 216.5 208.2 242.0 224.1 236.0 249.0 222.7 reserve-ratio 1,973.8 2,063.1 2,220.0 2,085.6 2,098.5 2,138.5 2,220.0 2,204.6 2,241.4 2,278.8 2,165.4 EPS 100 629 1,012 580 222 192 452 115 134 157 245 BPS 10,067 10,543 11,286 10,632 10,750 10,865 11,286 11,210 11,481 11,760 11,027 Dividends 220 220 220 220 Major Financial Information Recent Annual Performance Recent quarterly performance Estimate Average 2019-08-20 Gap (Indication / stock) Color High price ~ 112 % High mid ~ 85 % Mid ~ 59 % Low mid ~ 32 % Low price ~ 5 % Normal 11,921 W 11,921 W 0 W Industrial name of the company The number of All industries Algorithm Industry ranking Total number of listed companies Algorithm company ranking Investment opinion Pharmaceutical 81 40 3,009 432 20,929 W 20,929 W 17,926 W 17,926 W 17,926 W 14,923 W Evaluation 23,932 W 23,932 W~ 20,929 W 11,300 W 54.014,923 W 14,923 W 11,921 W Low price Indication price Range Current stock price Company score 11,921원 14,923원 17,926원 20,929원 23,932원 Low price 11,300원 5.5% 32.1% 58.6% 85.2% 111.8% 0.% 20.% 40.% 60.% 80.% 100.% 120.% 0W 5,000W 10,000W 15,000W 20,000W 25,000W 30,000W Low price Low mid Mid High mid High price Indication price chart (Consolidated) Indication price ahngook pharm Gap ahngook pharm
- 2. [Price for scheduled purchasing] Arbitrarily made Algorithm stocks Trading Strategies (consolidated) 001540 Date Period Gap (Indication / stock) Color low price 11,921 W 11,921 W ~ 0 W 5 % -60,109 W -5 Low mid 14,923 W 14,923 W ~ 11,921 W 32 % -350,994 W -24 Mid 17,926 W 17,926 W ~ 14,923 W 59 % -641,880 W -36 High mid 20,929 W 20,929 W ~ 17,926 W 85 % -932,765 W -45 Suggested Purchase Amount 1,094,592 W Number of stocks purchased 97 Indication price Range Buying / Selling Buying / Selling [Stocks] High price 23,932 W 23,932 W~ ~ 20,929 W 112 % -1,223,651 W All selling 2019-08-20 3 months Current stock price Evaluation Stock price rise probability score Investment opinion Prospective purchase amount 11,300 W Low price 61.3 Normal 2,000,000 W 31.4 35.5 48.2 18.8 30.9 39.4 2019.03.26 2019.04.23 2019.05.23 2019.06.21 2019.07.19 2019.08.19 Stock price rise probability score A Sector 47.5 46.9 48.1 54.1 41.0 44.3 61.3B Sector 15.4 24.2 48.3 54.1 20.8 34.6 Total average 2019.05.23 2019.06.21 2019.07.19 2019.08.19 Total of increase rate Total score A Sector -1 % 2 % 11 % -32 % 7 % -12 % 54.7B Sector 36 % 50 % 11 % -160 % 40 % Total average 12 % 26 % -157 % 39 % 22 % 2019.04.23 47 47 48 54 41 44 15 24 48 54 21 35 31 36 48 19 31 39 0 10 20 30 40 50 60 2019.03.26 2019.04.23 2019.05.23 2019.06.21 2019.07.19 2019.08.19 Stock price rise probability score A sector B sector Total average -1% 2% 11% -32% 7% 36% 50% 11% -160% 40% 12% 26% -157% 39% 22% -200% -150% -100% -50% 0% 50% 100% 2019.04.23 2019.05.23 2019.06.21 2019.07.19 2019.08.19 Increase rate of stock price rise A sector B sector Total average ahngook pharm
- 3. 정보와 완전 정보 결 투자판단 있습니 위배 무단으 숙지하 Compliance notice ① The information provided by The Algorithm Company Analysis Consulting is obtained through reliable data and information and The Algorithm Company Analysis Program (TACAP), but its accuracy or completeness are not guaranteed. Furthermore, it may change over time.Therefore, we are not legally responsible for the results of the data provided by The Algorithm Company Analysis Consulting because of information errors or omissions. ② The Algorithm Company Analysis Consulting and all the information provided on it site are reference materials for investment decisions and the final responsibility of investment is up to users utilizing this information. ③ The Algorithm Company Analysis Consulting and its site do not do anything that violates the related laws such as discretionary transaction. ④ Users can not reallocate and recycle the information provided by The Algorithm Company Analysis Consulting firm let alone the information provided by its Site. ⑤ Be sure to know about application period of this algorithm analysis report in order to improve its accuracy. Tel : 070 - 4667 - 5009 Email : tacac@tacac.co.kr Homepage : tacac.co.kr Blog : tacac.blog.me SERVICES M&A, IPO, RECOVER, CORPORATE RESTRUCTURING, MANAGEMENT OF TECHNOLOGY, BUSINESS STRATEGY, FAMILY BUSINESS Request : http://tacac.co.kr/?page_id=1374 ① Consulting The Algori accuracy o change ove results of Consulting ② informatio investmen up ③ do anythin transaction ④ The Algori informatio ⑤ analysis re