lotte chilsung 005300 Algorithm Investment Report
•
0 likes•48 views

This document provides performance data for an algorithm company over several periods from 2016-2019, including sales, operating profit, net income, operating rate, net rate, return on equity, debt ratio, quick ratio, and reserve ratio. It also includes stock price data, earnings per share, book value per share, and dividend amounts. The document then provides analysis of the company's recent quarterly performance, an indication of its current stock price relative to suggested price ranges, and charts showing the company's stock price rise probability scores over time compared to different sectors.
![[Price for scheduled purchasing]
Arbitrarily made
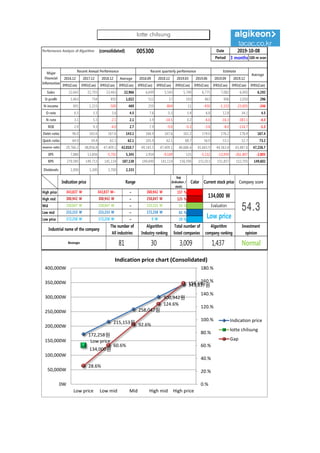
Algorithm stocks Trading Strategies (consolidated) 005300 Date
Period
Gap
(Indication /
stock)
Color
low price 172,258 W 172,258 W ~ 0 W 29 % -855,360 W -5
Low mid 215,153 W 215,153 W ~ 172,258 W 61 % -1,814,378 W -8
Mid 258,047 W 258,047 W ~ 215,153 W 93 % -2,773,396 W -11
High mid 300,942 W 300,942 W ~ 258,047 W 125 % -3,732,414 W All selling
Suggested Purchase
Amount 2,995,912 W
Number of stocks
purchased 22
Indication price Range Buying / Selling Buying / Selling [Stocks]
High price 343,837 W 343,837 W~ ~ 300,942 W 157 % -4,691,432 W All selling
2019-10-08
3 months
Current stock price Evaluation
Stock price rise
probability score
Investment opinion Prospective purchase amount
134,000 W Low price 32.2 Normal 8,000,000 W
39.9 46.2 35.3 39.6 36.5 34.4
2019.05.13 2019.06.11 2019.07.09 2019.08.06 2019.09.04 2019.10.07
Stock price rise
probability score
A Sector 43.2 46.1 42.7 48.3 45.4 47.1
32.2B Sector 36.7 46.3 27.9 48.3 27.5 21.7
Total average
2019.07.09 2019.08.06 2019.09.04 2019.10.07
Total of
increase rate
Total score
A Sector 6 % -8 % 12 % -6 % 4 %
-4 % 43.0B Sector 21 % -66 % 42 % -76 % -27 %
Total average 14 % -31 % 11 % -9 % -6 %
2019.06.11
43
46
43
48
45 47
37
46
28
48
28
22
40
46
35
40
36 34
0
10
20
30
40
50
60
2019.05.13 2019.06.11 2019.07.09 2019.08.06 2019.09.04 2019.10.07
Stock price rise probability score
A sector
B sector
Total average
6%
-8%
12%
-6%
4%
21%
-66%
42%
-76%
-27%
14%
-31%
11%
-9% -6%
-100%
-80%
-60%
-40%
-20%
0%
20%
40%
60%
2019.06.11 2019.07.09 2019.08.06 2019.09.04 2019.10.07
Increase rate of stock price rise
A sector
B sector
Total average
lotte chilsung](data:image/gif;base64,R0lGODlhAQABAIAAAAAAAP///yH5BAEAAAAALAAAAAABAAEAAAIBRAA7)
Recommended
Recommended
More Related Content
What's hot
What's hot (20)
Similar to lotte chilsung 005300 Algorithm Investment Report
Similar to lotte chilsung 005300 Algorithm Investment Report (20)
More from 알고리즘 기업분석 컨설팅-알기컨,algikeon
More from 알고리즘 기업분석 컨설팅-알기컨,algikeon (20)
Recently uploaded
Recently uploaded (8)
lotte chilsung 005300 Algorithm Investment Report
- 1. Performance Analysis of Algorithm (consolidated) 005300 Date Period 3 months 100-m won 2016.12 2017.12 2018.12 Average 2018.09 2018.12 2019.03 2019.06 2019.09 2019.12 IFRS(Con) IFRS(Con) IFRS(Con) IFRS(Con) IFRS(Con) IFRS(Con) IFRS(Con) IFRS(Con) IFRS(Con) IFRS(Con) IFRS(Con) Sales 22,642 22,793 23,463 22,966 6,699 5,543 5,749 6,775 7,082 6,005 6,192 O-profit 1,463 754 850 1,022 512 17 193 463 906 2,050 296 N-income 691 1,215 -500 469 259 -804 11 -450 -1,153 -23,005 -246 O-rate 6.5 3.3 3.6 4.5 7.6 0.3 3.4 6.8 12.8 34.1 4.5 N-rate 3.1 5.3 -2.1 2.1 3.9 -14.5 0.2 -6.6 -16.3 -383.1 -4.3 ROE 2.9 9.3 -4.0 2.7 7.9 -9.0 -0.3 -3.8 -8.0 -116.7 -1.3 Debt-ratio 96.0 165.6 167.6 143.1 166.9 167.6 161.2 174.0 176.2 178.4 167.4 Quick-ratio 64.9 59.4 62.1 62.1 105.9 62.1 68.7 56.0 53.1 52.7 73.2 reserve-ratio 29,766.2 48,856.8 47,409.1 42,010.7 49,145.5 47,409.1 46,686.4 45,665.9 44,563.4 43,487.6 47,226.7 EPS 7,880 13,856 -5,702 5,345 2,954 -9,169 125 -5,132 -13,959 -261,807 -2,805 BPS 270,585 149,713 141,114 187,138 149,690 141,114 156,590 151,013 151,857 152,705 149,602 Dividends 1,000 3,300 2,700 2,333 Major Financial Information Recent Annual Performance Recent quarterly performance Estimate Average 2019-10-08 Gap (Indication / stock) Color High price ~ 157 % High mid ~ 125 % Mid ~ 93 % Low mid ~ 61 % Low price ~ 29 % Normal 172,258 W 172,258 W 0 W Industrial name of the company The number of All industries Algorithm Industry ranking Total number of listed companies Algorithm company ranking Investment opinion Beverages 81 30 3,009 1,437 300,942 W 300,942 W 258,047 W 258,047 W 258,047 W 215,153 W Evaluation 343,837 W 343,837 W~ 300,942 W 134,000 W 54.3215,153 W 215,153 W 172,258 W Low price Indication price Range Current stock price Company score 172,258원 215,153원 258,047원 300,942원 343,837원 Low price 134,000원 28.6% 60.6% 92.6% 124.6% 156.6% 0.% 20.% 40.% 60.% 80.% 100.% 120.% 140.% 160.% 180.% 0W 50,000W 100,000W 150,000W 200,000W 250,000W 300,000W 350,000W 400,000W Low price Low mid Mid High mid High price Indication price chart (Consolidated) Indication price lotte chilsung Gap lotte chilsung
- 2. [Price for scheduled purchasing] Arbitrarily made Algorithm stocks Trading Strategies (consolidated) 005300 Date Period Gap (Indication / stock) Color low price 172,258 W 172,258 W ~ 0 W 29 % -855,360 W -5 Low mid 215,153 W 215,153 W ~ 172,258 W 61 % -1,814,378 W -8 Mid 258,047 W 258,047 W ~ 215,153 W 93 % -2,773,396 W -11 High mid 300,942 W 300,942 W ~ 258,047 W 125 % -3,732,414 W All selling Suggested Purchase Amount 2,995,912 W Number of stocks purchased 22 Indication price Range Buying / Selling Buying / Selling [Stocks] High price 343,837 W 343,837 W~ ~ 300,942 W 157 % -4,691,432 W All selling 2019-10-08 3 months Current stock price Evaluation Stock price rise probability score Investment opinion Prospective purchase amount 134,000 W Low price 32.2 Normal 8,000,000 W 39.9 46.2 35.3 39.6 36.5 34.4 2019.05.13 2019.06.11 2019.07.09 2019.08.06 2019.09.04 2019.10.07 Stock price rise probability score A Sector 43.2 46.1 42.7 48.3 45.4 47.1 32.2B Sector 36.7 46.3 27.9 48.3 27.5 21.7 Total average 2019.07.09 2019.08.06 2019.09.04 2019.10.07 Total of increase rate Total score A Sector 6 % -8 % 12 % -6 % 4 % -4 % 43.0B Sector 21 % -66 % 42 % -76 % -27 % Total average 14 % -31 % 11 % -9 % -6 % 2019.06.11 43 46 43 48 45 47 37 46 28 48 28 22 40 46 35 40 36 34 0 10 20 30 40 50 60 2019.05.13 2019.06.11 2019.07.09 2019.08.06 2019.09.04 2019.10.07 Stock price rise probability score A sector B sector Total average 6% -8% 12% -6% 4% 21% -66% 42% -76% -27% 14% -31% 11% -9% -6% -100% -80% -60% -40% -20% 0% 20% 40% 60% 2019.06.11 2019.07.09 2019.08.06 2019.09.04 2019.10.07 Increase rate of stock price rise A sector B sector Total average lotte chilsung
- 3. 정보와 완전 정보 결 투자판단 있습니 위배 무단으 숙지하 Compliance notice ① The information provided by The Algorithm Company Analysis Consulting is obtained through reliable data and information and The Algorithm Company Analysis Program (TACAP), but its accuracy or completeness are not guaranteed. Furthermore, it may change over time.Therefore, we are not legally responsible for the results of the data provided by The Algorithm Company Analysis Consulting because of information errors or omissions. ② The Algorithm Company Analysis Consulting and all the information provided on it site are reference materials for investment decisions and the final responsibility of investment is up to users utilizing this information. ③ The Algorithm Company Analysis Consulting and its site do not do anything that violates the related laws such as discretionary transaction. ④ Users can not reallocate and recycle the information provided by The Algorithm Company Analysis Consulting firm let alone the information provided by its Site. ⑤ Be sure to know about application period of this algorithm analysis report in order to improve its accuracy. Tel : 070 - 4667 - 5009 Email : tacac@tacac.co.kr Homepage : tacac.co.kr Blog : tacac.blog.me SERVICES M&A, IPO, RECOVER, CORPORATE RESTRUCTURING, MANAGEMENT OF TECHNOLOGY, BUSINESS STRATEGY, FAMILY BUSINESS Request : http://tacac.co.kr/?page_id=1374 ① Consulting The Algori accuracy o change ove results of Consulting ② informatio investmen up ③ do anythin transaction ④ The Algori informatio ⑤ analysis re