Wonik Qnc 074600 Algorithm Investment Report
•
0 likes•81 views

This document provides financial and stock performance data for an algorithm company over several periods from 2016-2019. It includes metrics like sales, operating profit, net income, debt ratios, and stock prices. The document also analyzes the company's stock price rise probability scores compared to sector averages and makes an investment opinion. It notes that the analysis is for reference only and users are responsible for their own investment decisions based on the information.
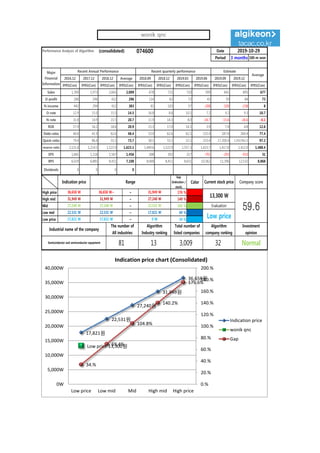
![[Price for scheduled purchasing]
Arbitrarily made
Algorithm stocks Trading Strategies (consolidated) 074600 Date
Period
Gap
(Indication /
stock)
Color
low price 17,821 W 17,821 W ~ 0 W 34 % -1,624,585 W -91
Low mid 22,531 W 22,531 W ~ 17,821 W 69 % -3,316,640 W -147
Mid 27,240 W 27,240 W ~ 22,531 W 105 % -5,008,695 W All selling
High mid 31,949 W 31,949 W ~ 27,240 W 140 % -6,700,750 W All selling
Suggested Purchase
Amount 4,778,750 W
Number of stocks
purchased 359
Indication price Range Buying / Selling Buying / Selling [Stocks]
High price 36,658 W 36,658 W~ ~ 31,949 W 176 % -8,392,804 W All selling
2019-10-29
3 months
Current stock price Evaluation
Stock price rise
probability score
Investment opinion Prospective purchase amount
13,300 W Low price 40.4 Normal 10,000,000 W
32.3 30.6 35.9 25.4 38.2 33.9
2019.05.31 2019.07.01 2019.07.29 2019.08.27 2019.09.26 2019.10.28
Stock price rise
probability score
A Sector 48.4 47.0 44.3 46.8 48.1 46.1
40.4B Sector 16.3 14.2 27.5 46.8 28.3 21.7
Total average
2019.07.29 2019.08.27 2019.09.26 2019.10.28
Total of
increase rate
Total score
A Sector -3 % -6 % 5 % 3 % -4 %
-2 % 45.7B Sector -15 % 48 % 41 % -65 % -31 %
Total average -6 % 15 % -41 % 33 % -13 %
2019.07.01
48 47
44 47 48 46
16 14
28
47
28
22
32 31
36
25
38
34
0
10
20
30
40
50
60
2019.05.31 2019.07.01 2019.07.29 2019.08.27 2019.09.26 2019.10.28
Stock price rise probability score
A sector
B sector
Total average
-3% -6%
5% 3%
-4%
-15%
48%
41%
-65%
-31%
-6%
15%
-41%
33%
-13%
-80%
-60%
-40%
-20%
0%
20%
40%
60%
2019.07.01 2019.07.29 2019.08.27 2019.09.26 2019.10.28
Increase rate of stock price rise
A sector
B sector
Total average
wonik qnc](data:image/gif;base64,R0lGODlhAQABAIAAAAAAAP///yH5BAEAAAAALAAAAAABAAEAAAIBRAA7)
Recommended
Recommended
More Related Content
What's hot
What's hot (20)
Similar to Wonik Qnc 074600 Algorithm Investment Report
Similar to Wonik Qnc 074600 Algorithm Investment Report (20)
More from 알고리즘 기업분석 컨설팅-알기컨,algikeon
More from 알고리즘 기업분석 컨설팅-알기컨,algikeon (20)
Recently uploaded
Recently uploaded (20)
Wonik Qnc 074600 Algorithm Investment Report
- 1. Performance Analysis of Algorithm (consolidated) 074600 Date Period 3 months 100-m won 2016.12 2017.12 2018.12 Average 2018.09 2018.12 2019.03 2019.06 2019.09 2019.12 IFRS(Con) IFRS(Con) IFRS(Con) IFRS(Con) IFRS(Con) IFRS(Con) IFRS(Con) IFRS(Con) IFRS(Con) IFRS(Con) IFRS(Con) Sales 1,390 1,973 2,665 2,009 678 721 710 599 641 895 677 O-profit 180 296 412 296 114 62 72 43 59 84 73 N-income 442 294 412 383 81 103 57 -208 -100 -238 8 O-rate 12.9 15.0 15.5 14.5 16.8 8.6 10.1 7.2 9.2 9.3 10.7 N-rate 31.8 14.9 15.5 20.7 11.9 14.3 8.0 -34.7 -15.6 -26.6 -0.1 ROE 27.9 16.2 18.6 20.9 15.3 17.0 14.1 3.9 7.4 4.8 12.6 Debt-ratio 40.6 41.9 62.6 48.4 53.9 62.6 62.1 131.0 187.8 269.4 77.4 Quick-ratio 79.4 86.4 55.1 73.7 58.1 55.1 52.1 223.4 17,200.4 1,592,962.5 97.2 reserve-ratio 2,131.8 1,214.5 1,522.9 1,623.1 1,449.6 1,522.9 1,557.3 1,423.7 1,417.8 1,412.0 1,488.4 EPS 1,681 1,118 1,567 1,456 308 392 217 -791 -293 -933 31 BPS 6,029 6,885 8,411 7,108 8,068 8,411 8,631 10,362 11,396 12,532 8,868 Dividends 0 0 0 0 Major Financial Information Recent Annual Performance Recent quarterly performance Estimate Average 2019-10-29 Gap (Indication / stock) Color High price ~ 176 % High mid ~ 140 % Mid ~ 105 % Low mid ~ 69 % Low price ~ 34 % Normal 17,821 W 17,821 W 0 W Industrial name of the company The number of All industries Algorithm Industry ranking Total number of listed companies Algorithm company ranking Investment opinion Semiconductor and semiconductor equipment 81 13 3,009 32 31,949 W 31,949 W 27,240 W 27,240 W 27,240 W 22,531 W Evaluation 36,658 W 36,658 W~ 31,949 W 13,300 W 59.622,531 W 22,531 W 17,821 W Low price Indication price Range Current stock price Company score 17,821원 22,531원 27,240원 31,949원 36,658원 Low price 13,300원 34.% 69.4% 104.8% 140.2% 175.6% 0.% 20.% 40.% 60.% 80.% 100.% 120.% 140.% 160.% 180.% 200.% 0W 5,000W 10,000W 15,000W 20,000W 25,000W 30,000W 35,000W 40,000W Low price Low mid Mid High mid High price Indication price chart (Consolidated) Indication price wonik qnc Gap wonik qnc
- 2. [Price for scheduled purchasing] Arbitrarily made Algorithm stocks Trading Strategies (consolidated) 074600 Date Period Gap (Indication / stock) Color low price 17,821 W 17,821 W ~ 0 W 34 % -1,624,585 W -91 Low mid 22,531 W 22,531 W ~ 17,821 W 69 % -3,316,640 W -147 Mid 27,240 W 27,240 W ~ 22,531 W 105 % -5,008,695 W All selling High mid 31,949 W 31,949 W ~ 27,240 W 140 % -6,700,750 W All selling Suggested Purchase Amount 4,778,750 W Number of stocks purchased 359 Indication price Range Buying / Selling Buying / Selling [Stocks] High price 36,658 W 36,658 W~ ~ 31,949 W 176 % -8,392,804 W All selling 2019-10-29 3 months Current stock price Evaluation Stock price rise probability score Investment opinion Prospective purchase amount 13,300 W Low price 40.4 Normal 10,000,000 W 32.3 30.6 35.9 25.4 38.2 33.9 2019.05.31 2019.07.01 2019.07.29 2019.08.27 2019.09.26 2019.10.28 Stock price rise probability score A Sector 48.4 47.0 44.3 46.8 48.1 46.1 40.4B Sector 16.3 14.2 27.5 46.8 28.3 21.7 Total average 2019.07.29 2019.08.27 2019.09.26 2019.10.28 Total of increase rate Total score A Sector -3 % -6 % 5 % 3 % -4 % -2 % 45.7B Sector -15 % 48 % 41 % -65 % -31 % Total average -6 % 15 % -41 % 33 % -13 % 2019.07.01 48 47 44 47 48 46 16 14 28 47 28 22 32 31 36 25 38 34 0 10 20 30 40 50 60 2019.05.31 2019.07.01 2019.07.29 2019.08.27 2019.09.26 2019.10.28 Stock price rise probability score A sector B sector Total average -3% -6% 5% 3% -4% -15% 48% 41% -65% -31% -6% 15% -41% 33% -13% -80% -60% -40% -20% 0% 20% 40% 60% 2019.07.01 2019.07.29 2019.08.27 2019.09.26 2019.10.28 Increase rate of stock price rise A sector B sector Total average wonik qnc
- 3. 정보와 완전 정보 결 투자판단 있습니 위배 무단으 숙지하 Compliance notice ① The information provided by The Algorithm Company Analysis Consulting is obtained through reliable data and information and The Algorithm Company Analysis Program (TACAP), but its accuracy or completeness are not guaranteed. Furthermore, it may change over time.Therefore, we are not legally responsible for the results of the data provided by The Algorithm Company Analysis Consulting because of information errors or omissions. ② The Algorithm Company Analysis Consulting and all the information provided on it site are reference materials for investment decisions and the final responsibility of investment is up to users utilizing this information. ③ The Algorithm Company Analysis Consulting and its site do not do anything that violates the related laws such as discretionary transaction. ④ Users can not reallocate and recycle the information provided by The Algorithm Company Analysis Consulting firm let alone the information provided by its Site. ⑤ Be sure to know about application period of this algorithm analysis report in order to improve its accuracy. Tel : 070 - 4667 - 5009 Email : tacac@tacac.co.kr Homepage : tacac.co.kr Blog : tacac.blog.me SERVICES M&A, IPO, RECOVER, CORPORATE RESTRUCTURING, MANAGEMENT OF TECHNOLOGY, BUSINESS STRATEGY, FAMILY BUSINESS Request : http://tacac.co.kr/?page_id=1374 ① Consulting The Algori accuracy o change ove results of Consulting ② informatio investmen up ③ do anythin transaction ④ The Algori informatio ⑤ analysis re