Download as PDF, PPTX
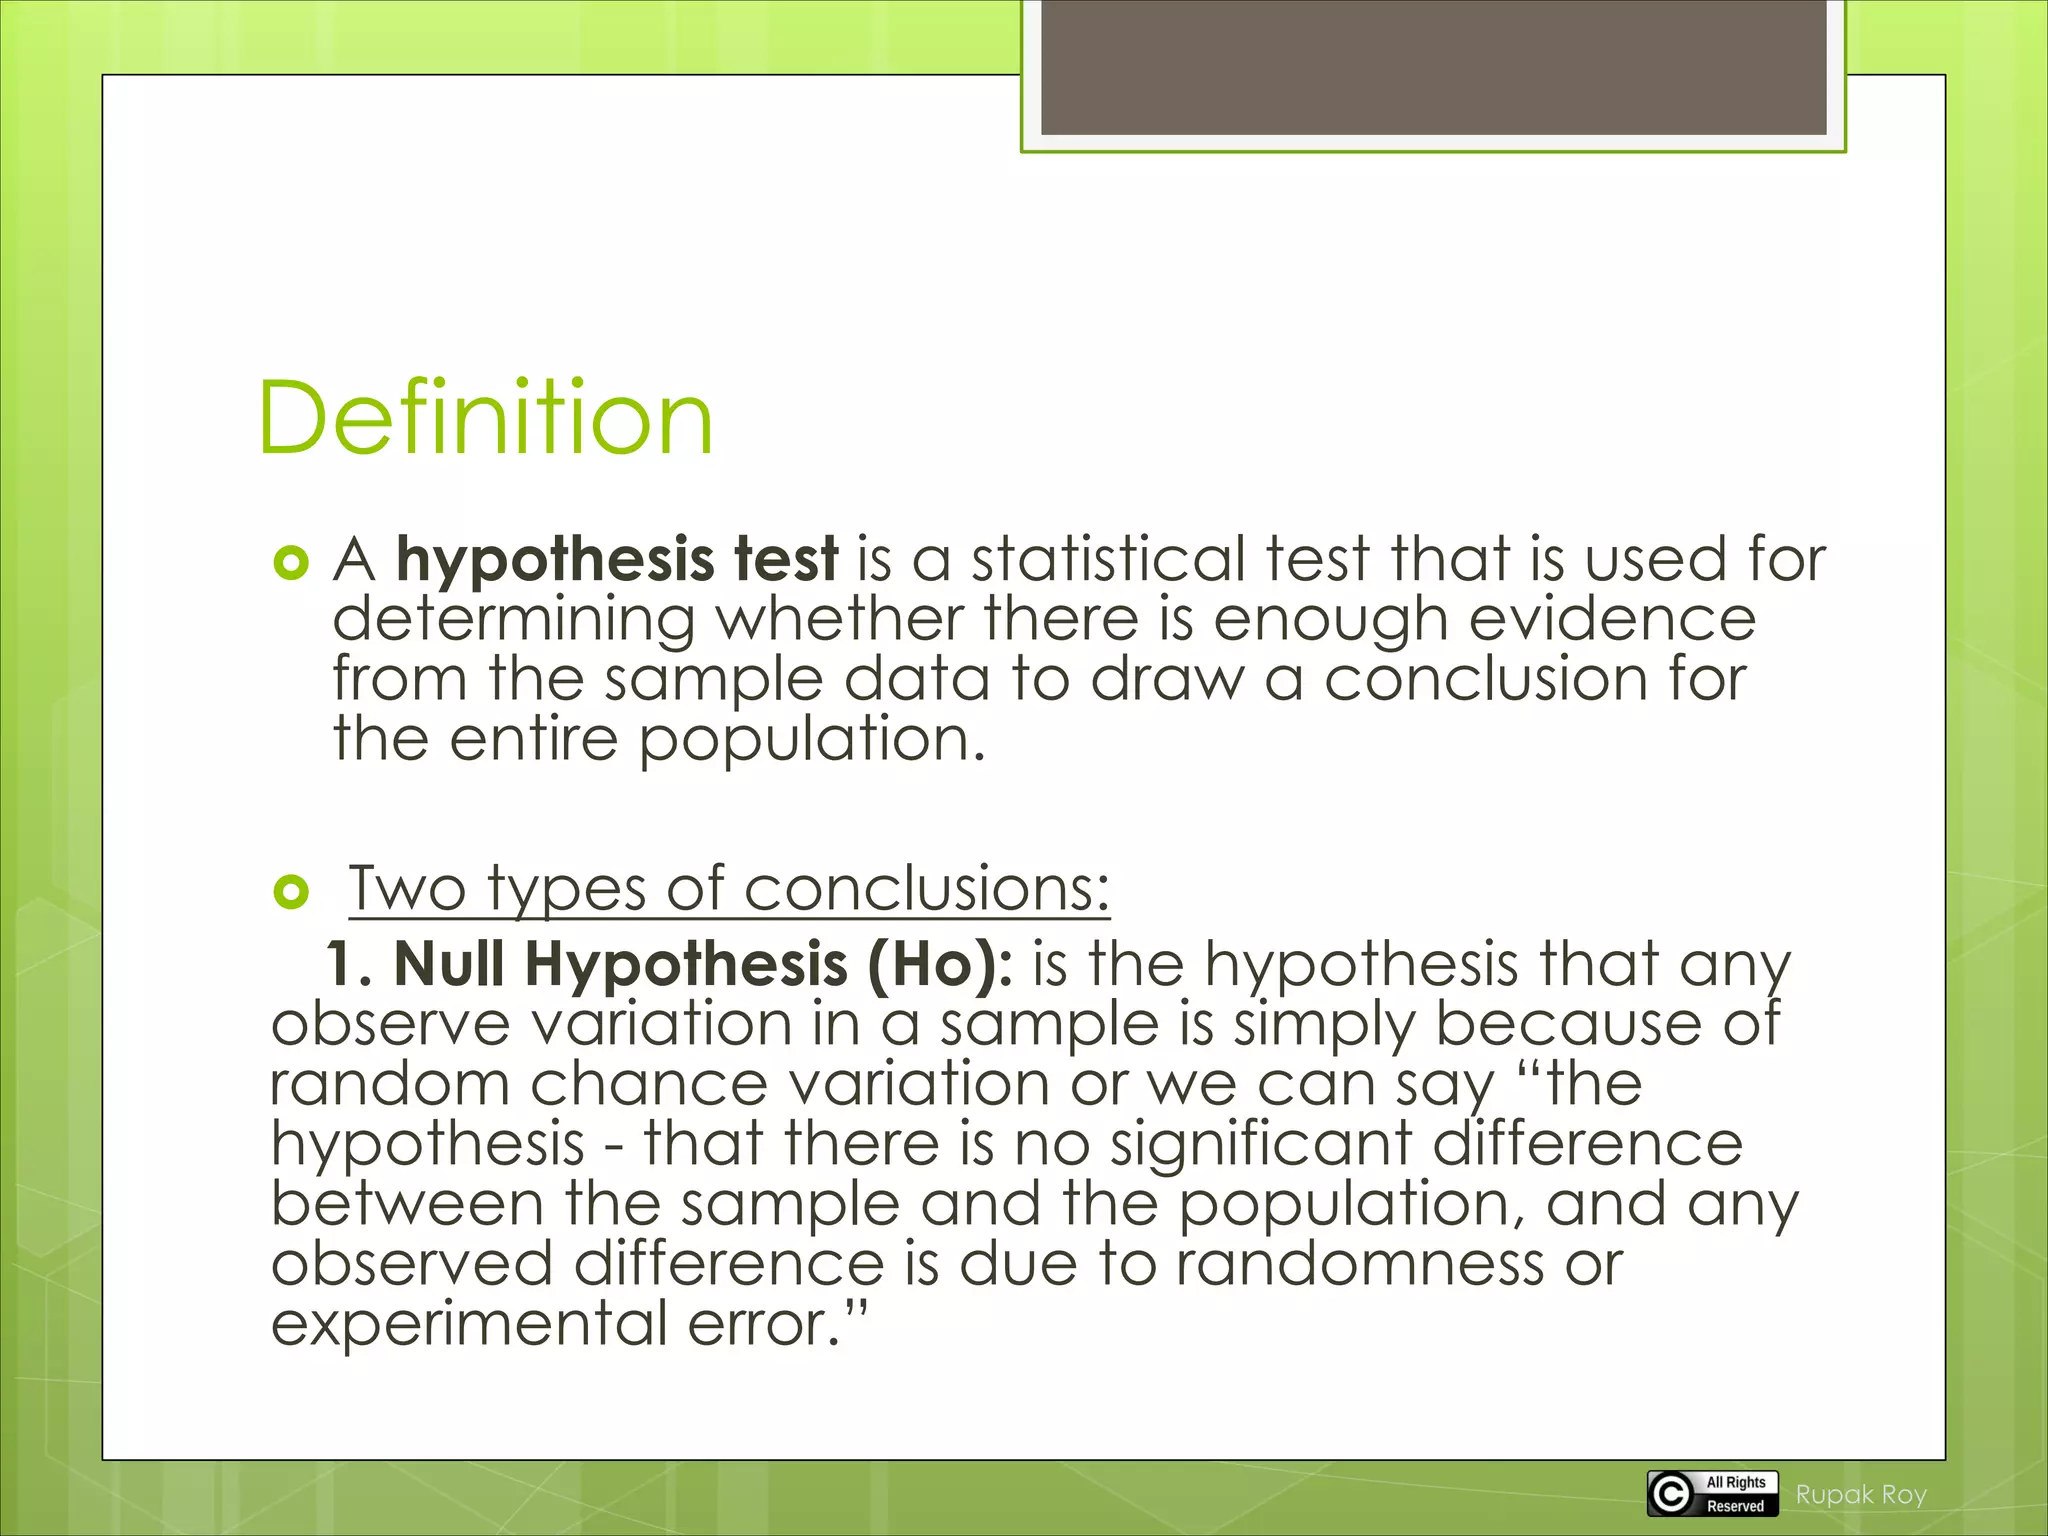
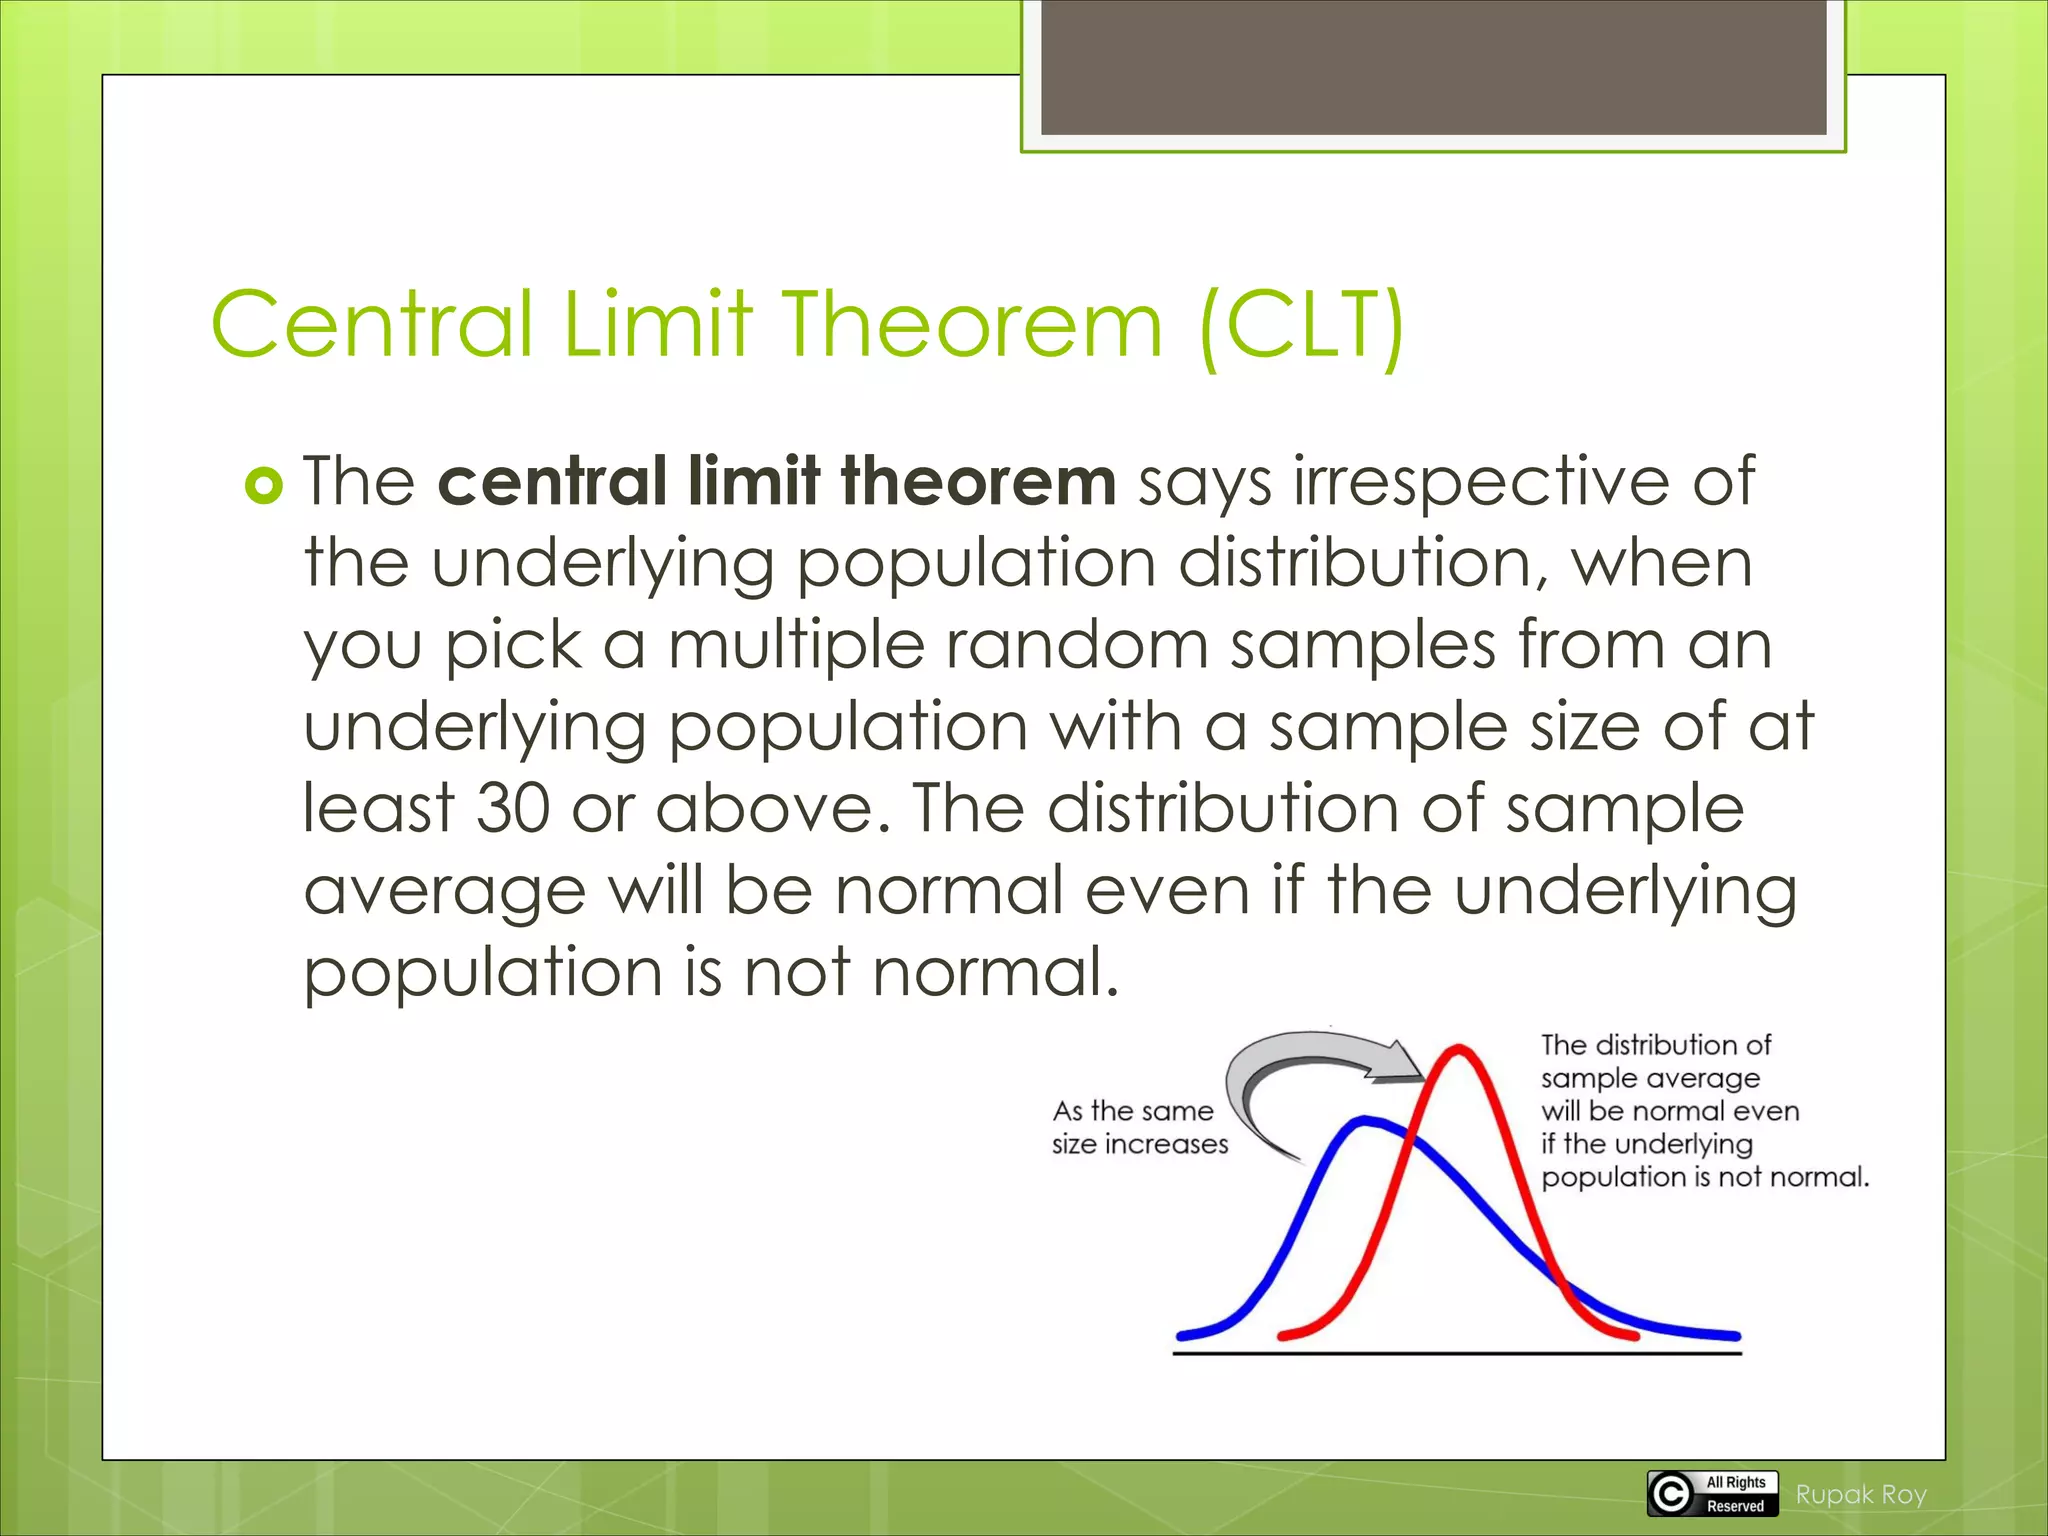
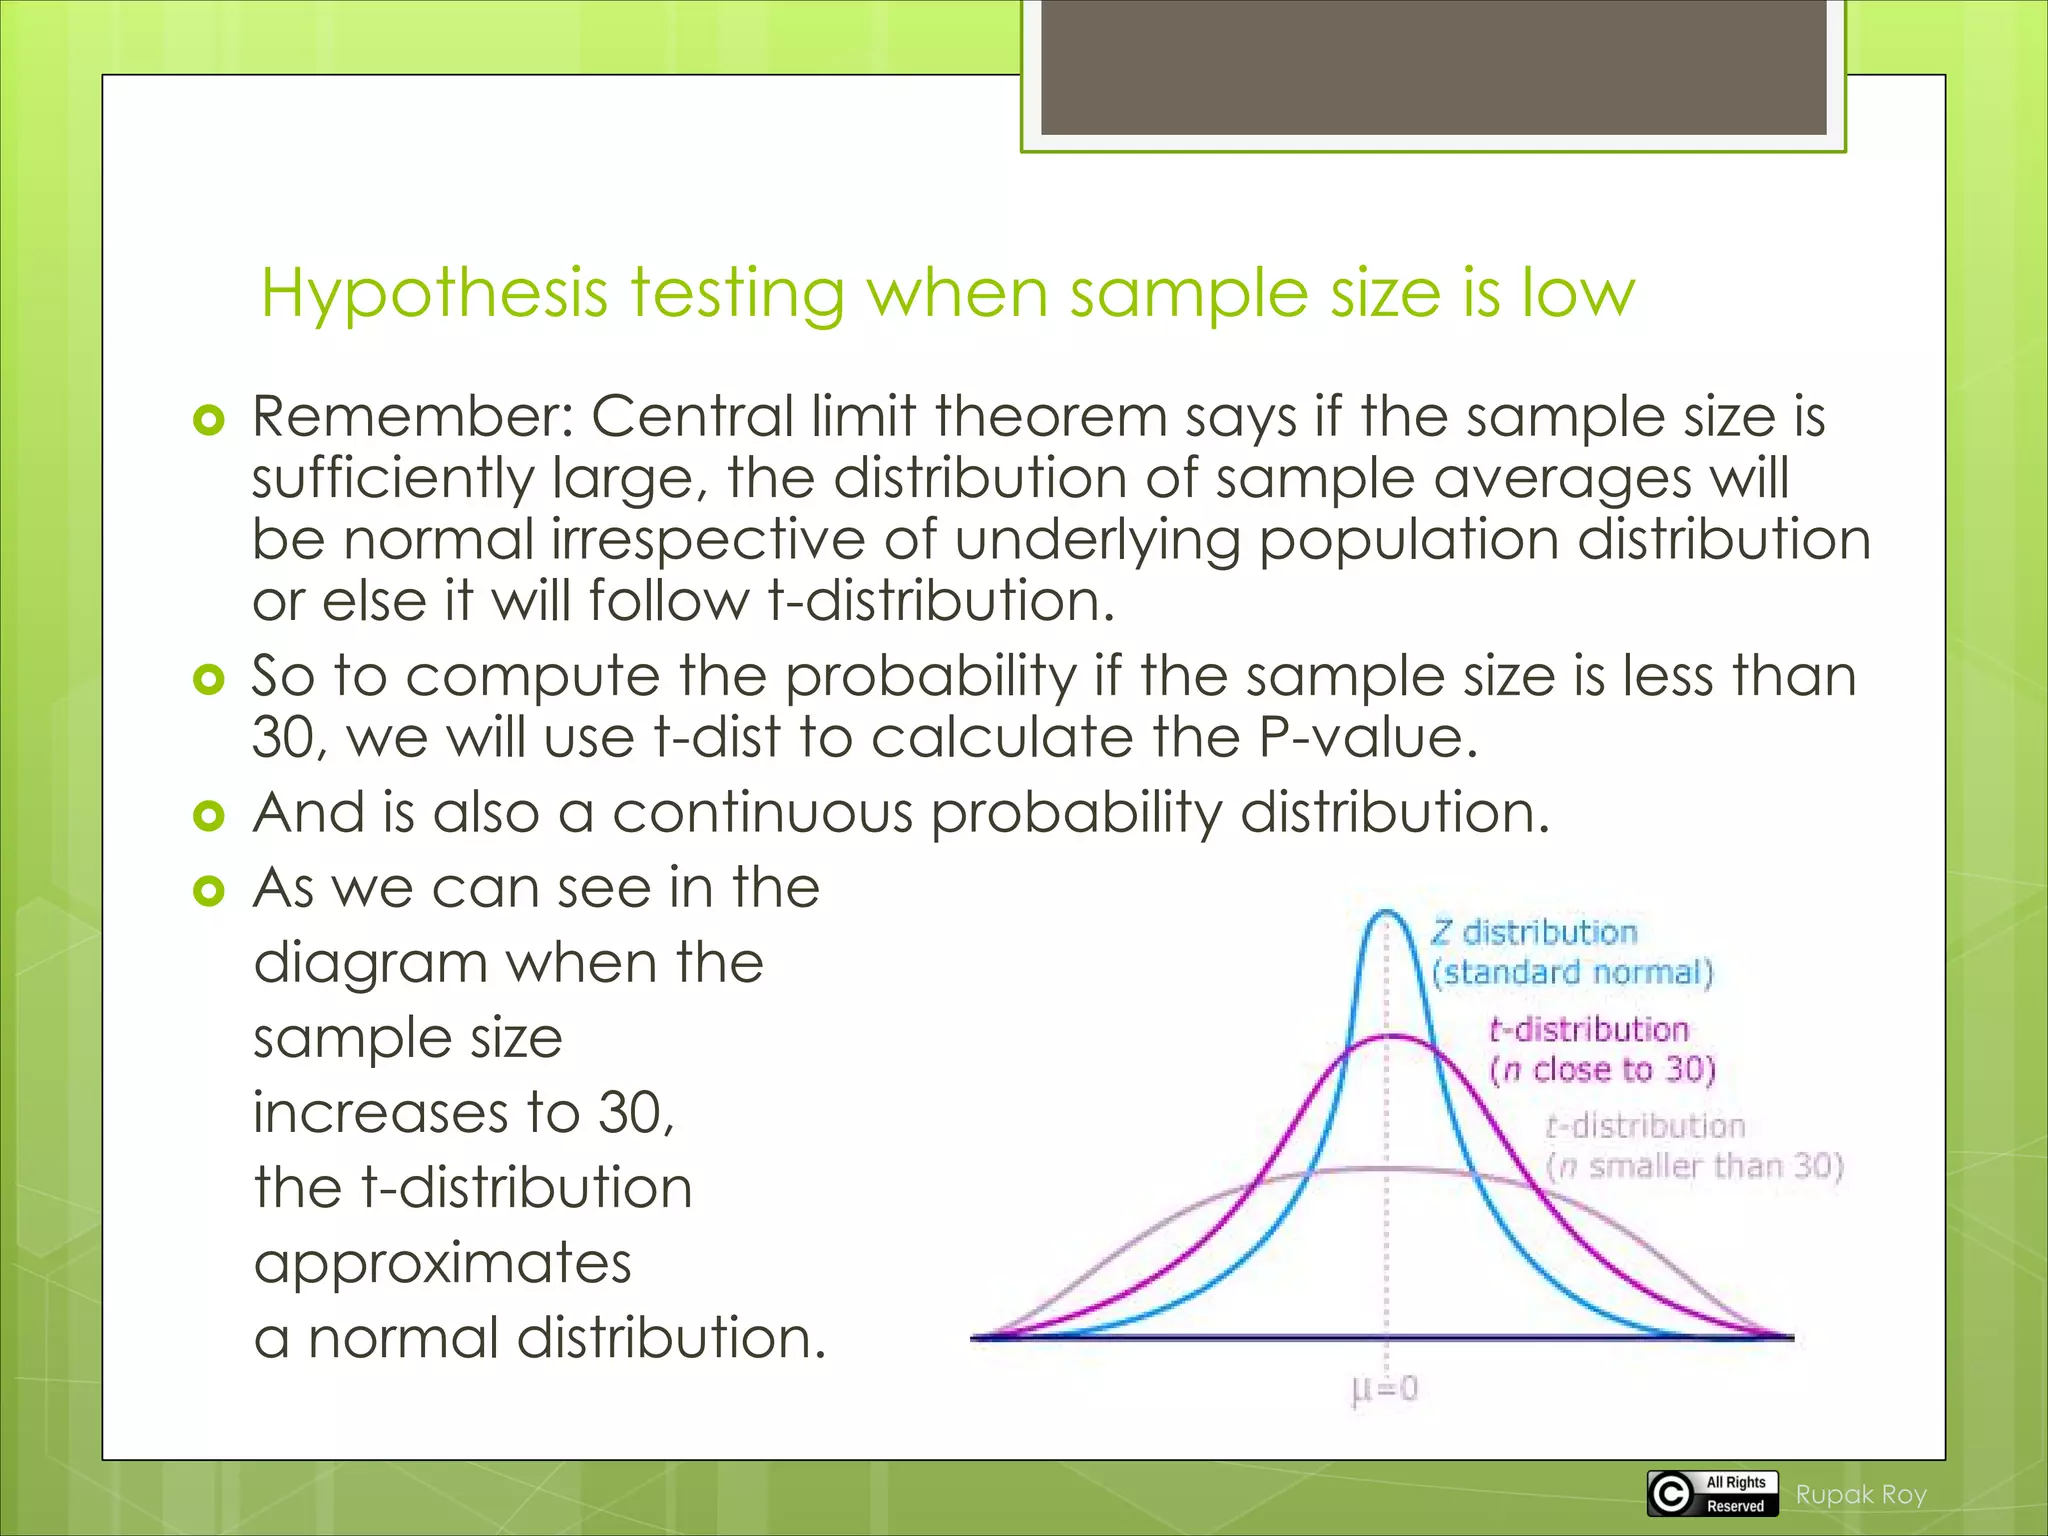
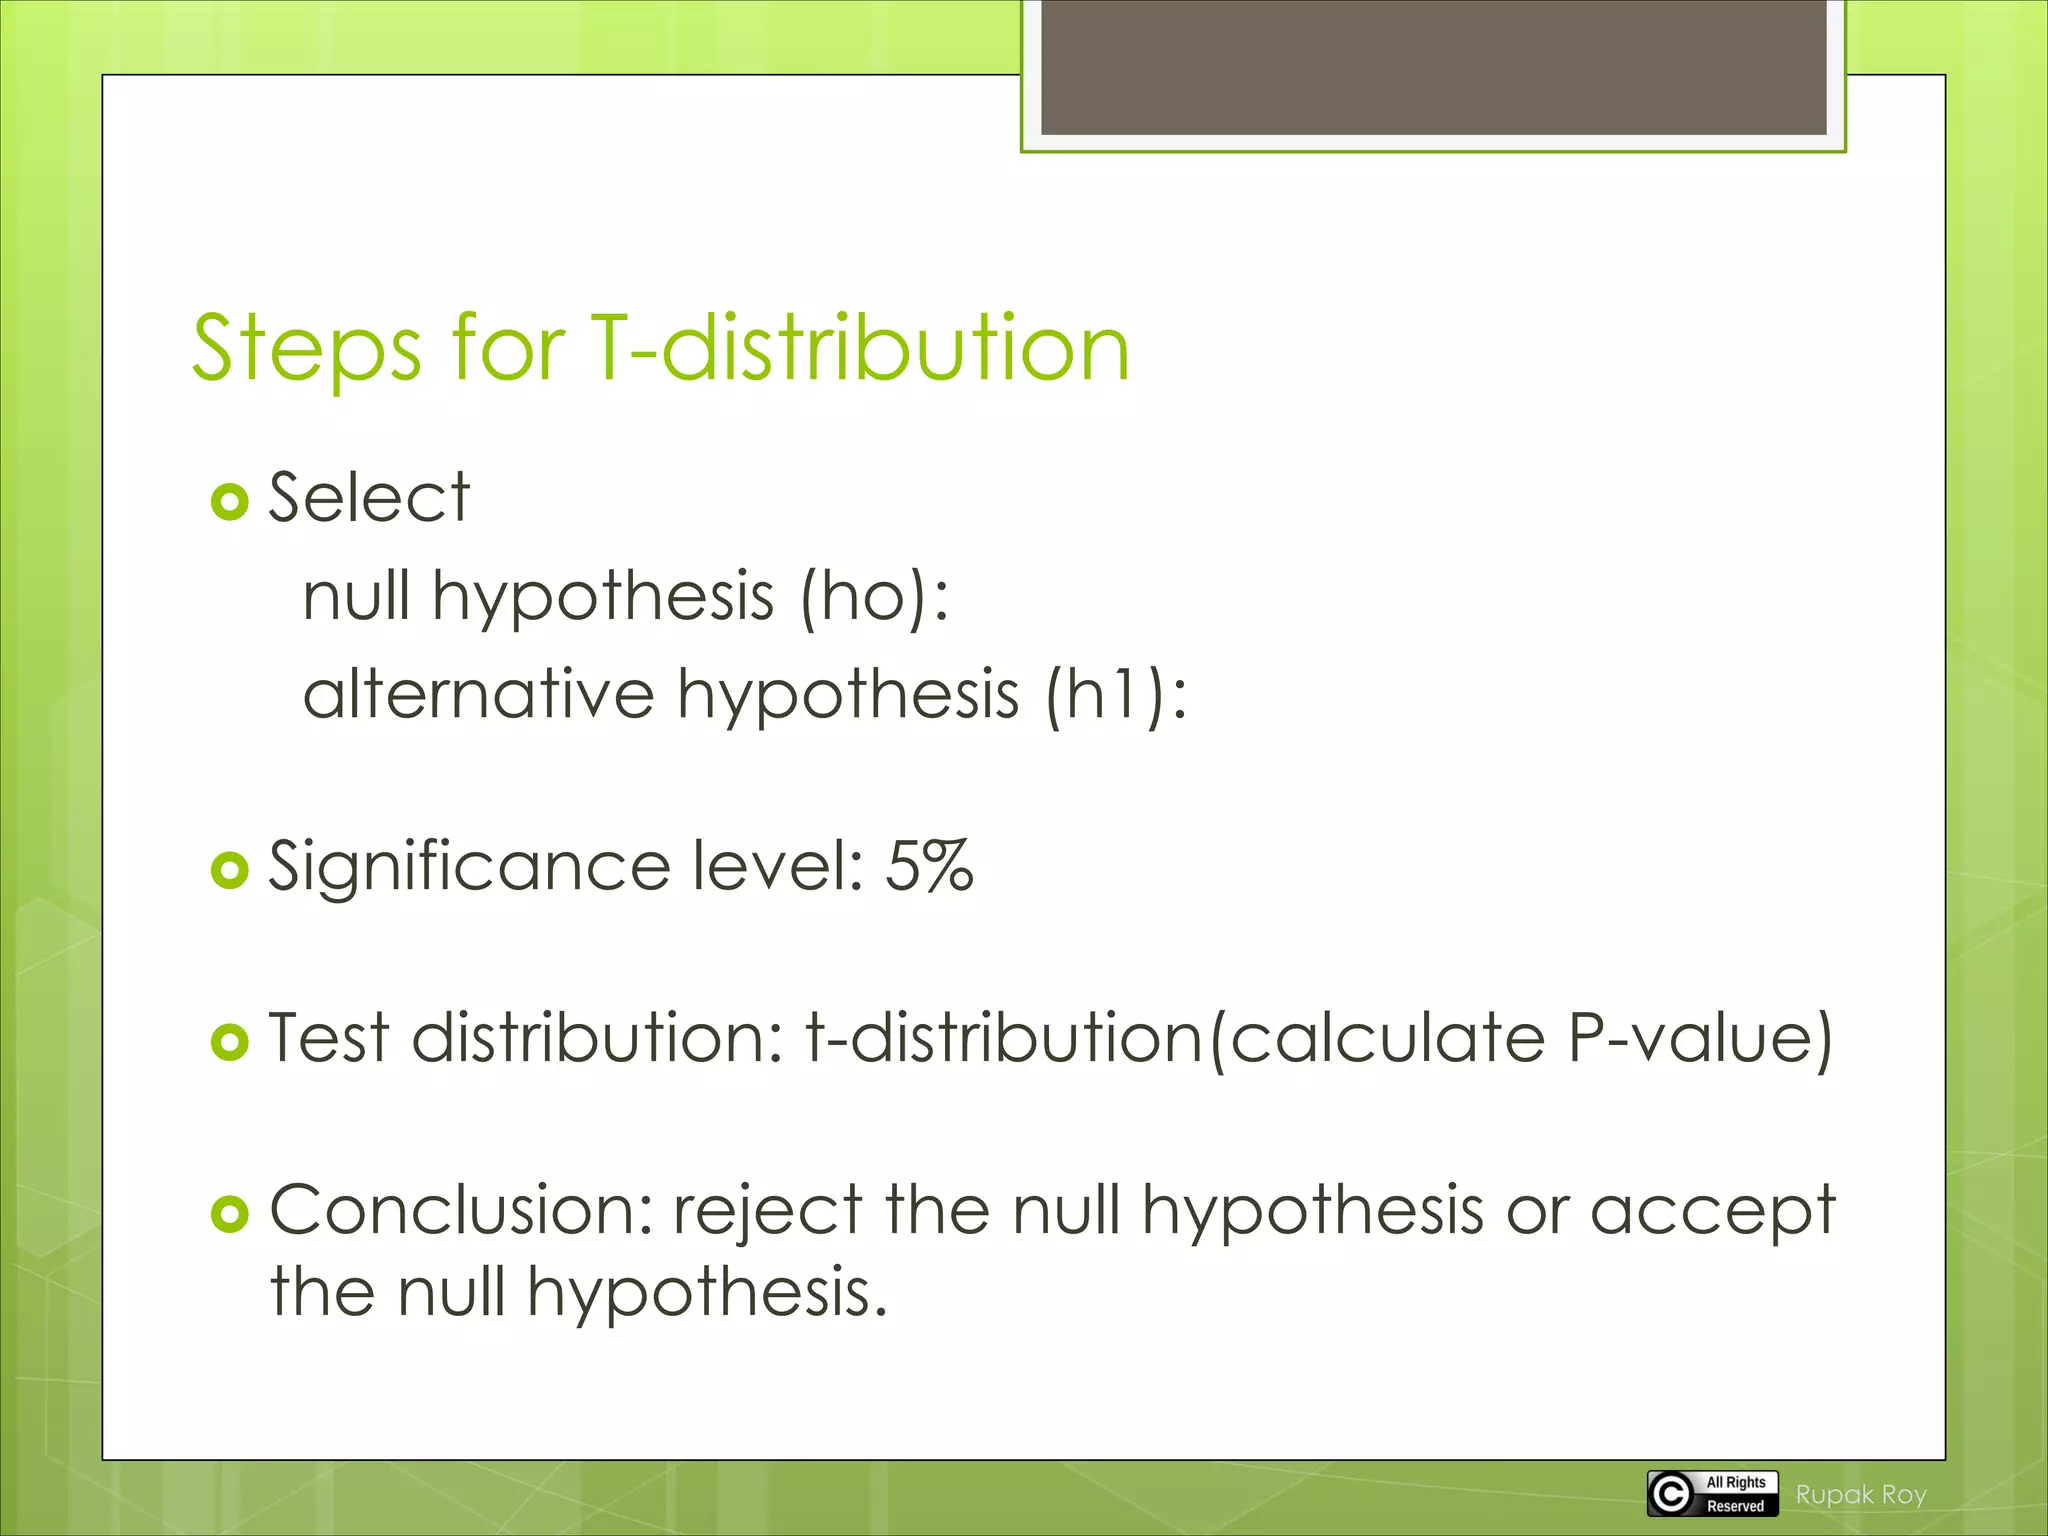
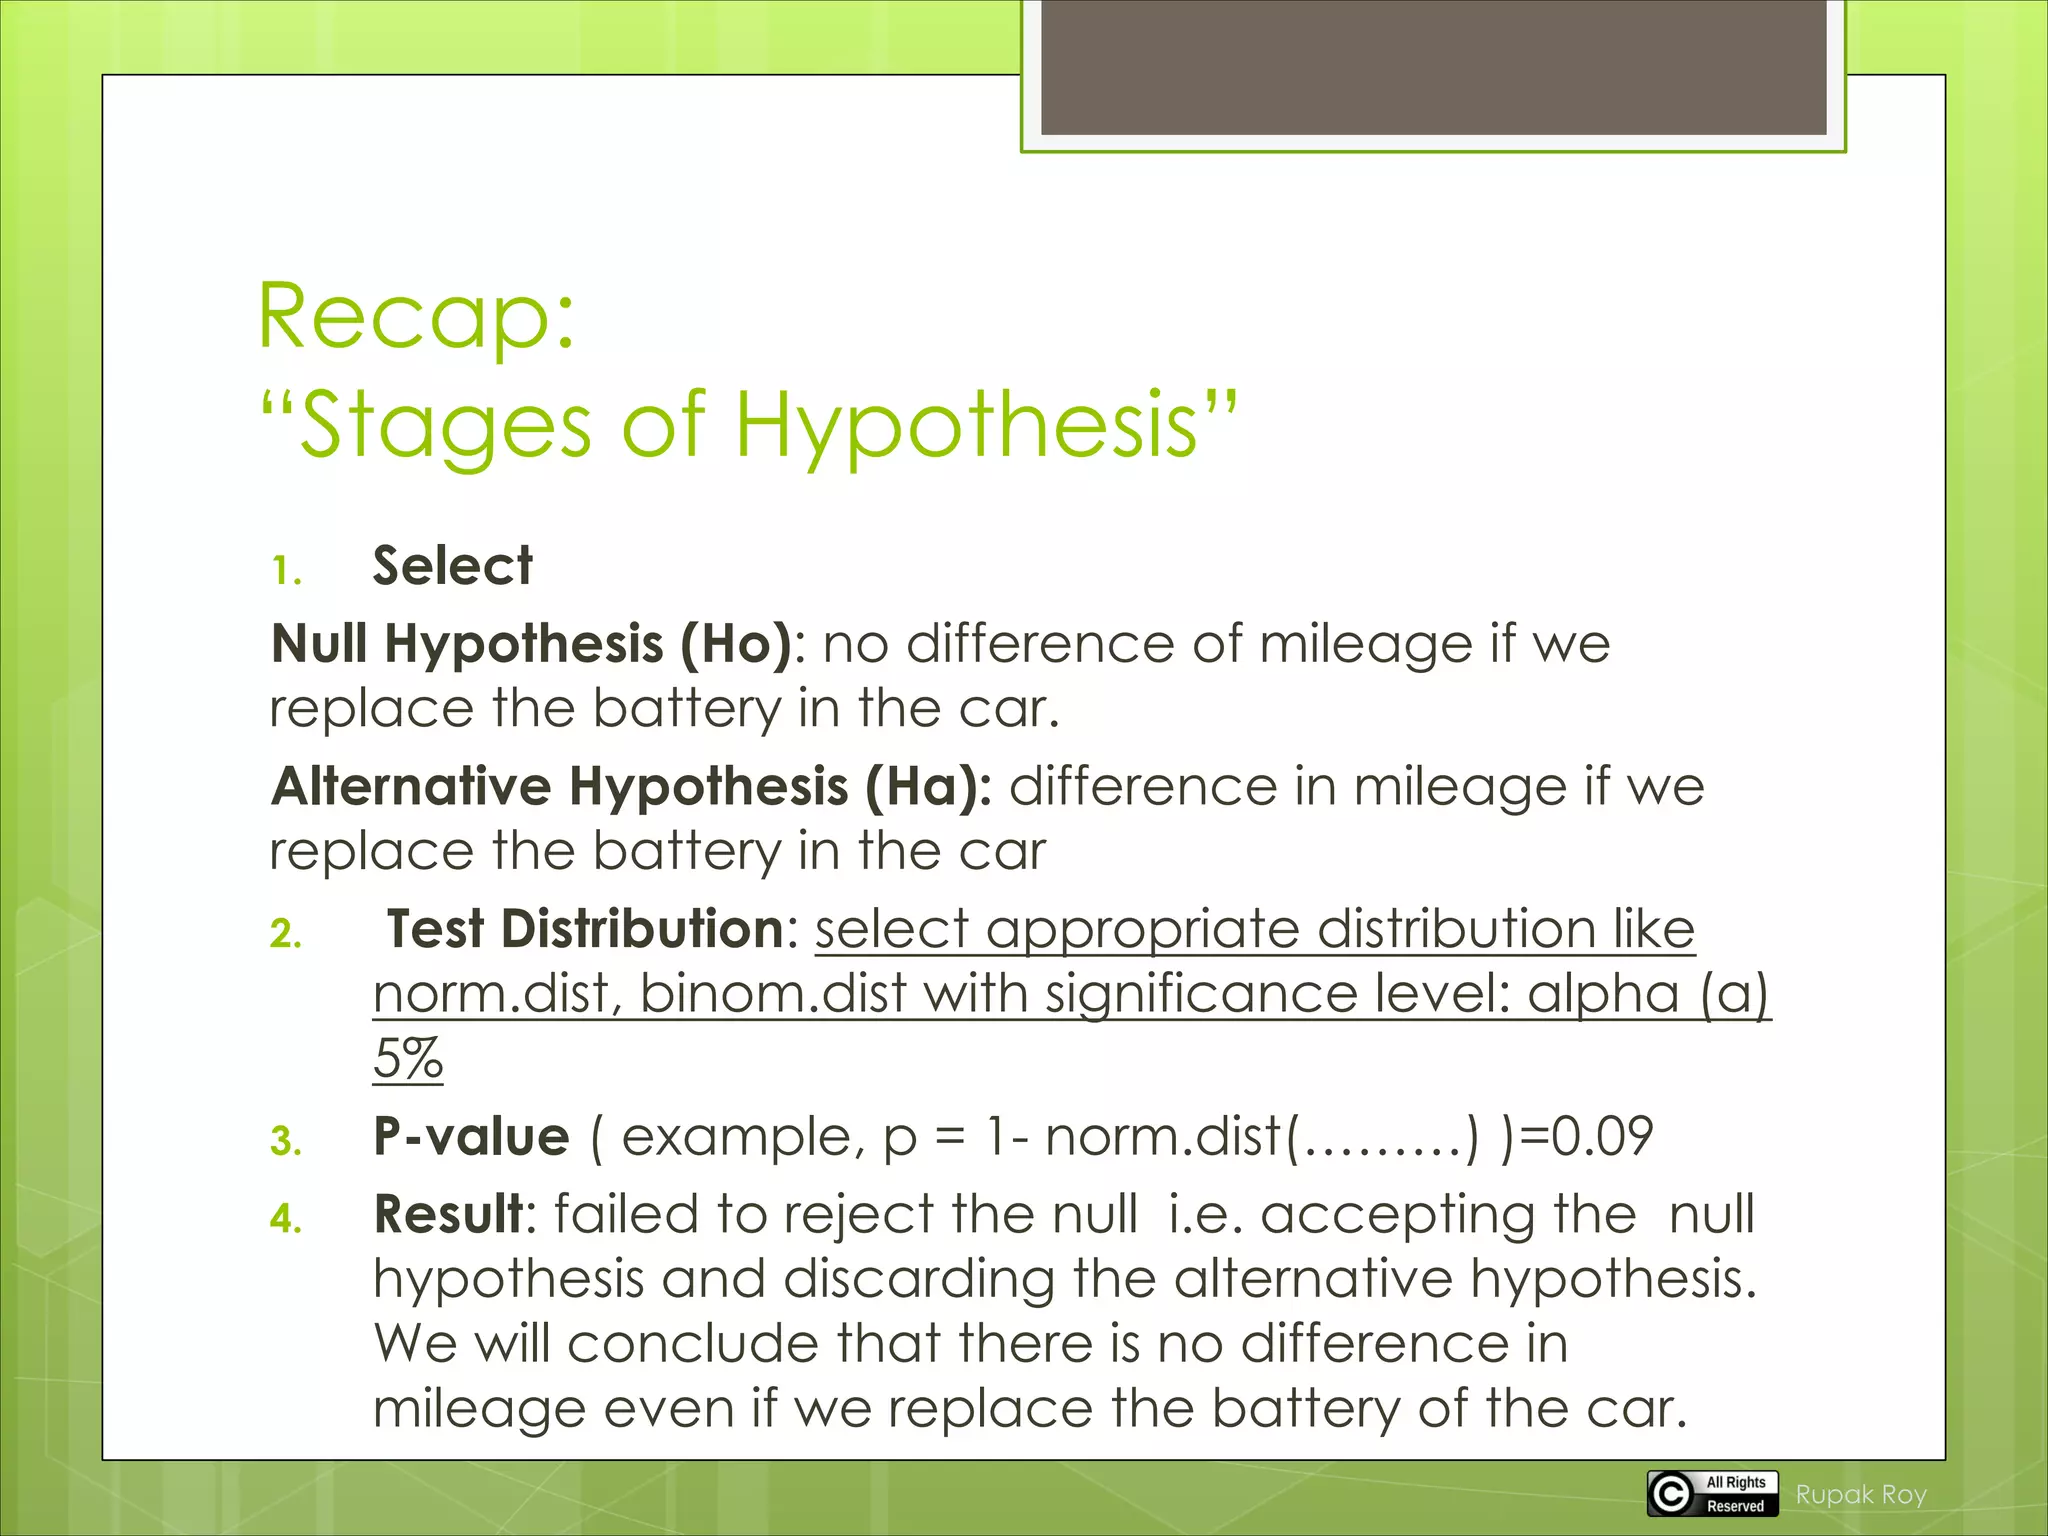


Hypothesis testing is a statistical method used to determine if there is sufficient evidence from sample data to draw conclusions about a population, involving a null hypothesis (H0) and an alternative hypothesis (H1). The significance level (alpha) helps decide whether to reject or accept the null hypothesis based on p-values, with a common threshold set at 0.05. The document also explains the Central Limit Theorem and provides examples of hypothesis testing with different distributions and sample sizes.


![3 es timation-of_parameters[1]](https://cdn.slidesharecdn.com/ss_thumbnails/3-estimationofparameters1-170318090736-thumbnail.jpg?width=640&height=640&fit=bounds)