Chapter 7; HypothesisTesting
• Cha
by; Yibekal .M
( BSC in PH,PHA & MPH in Epidemiology)
2.
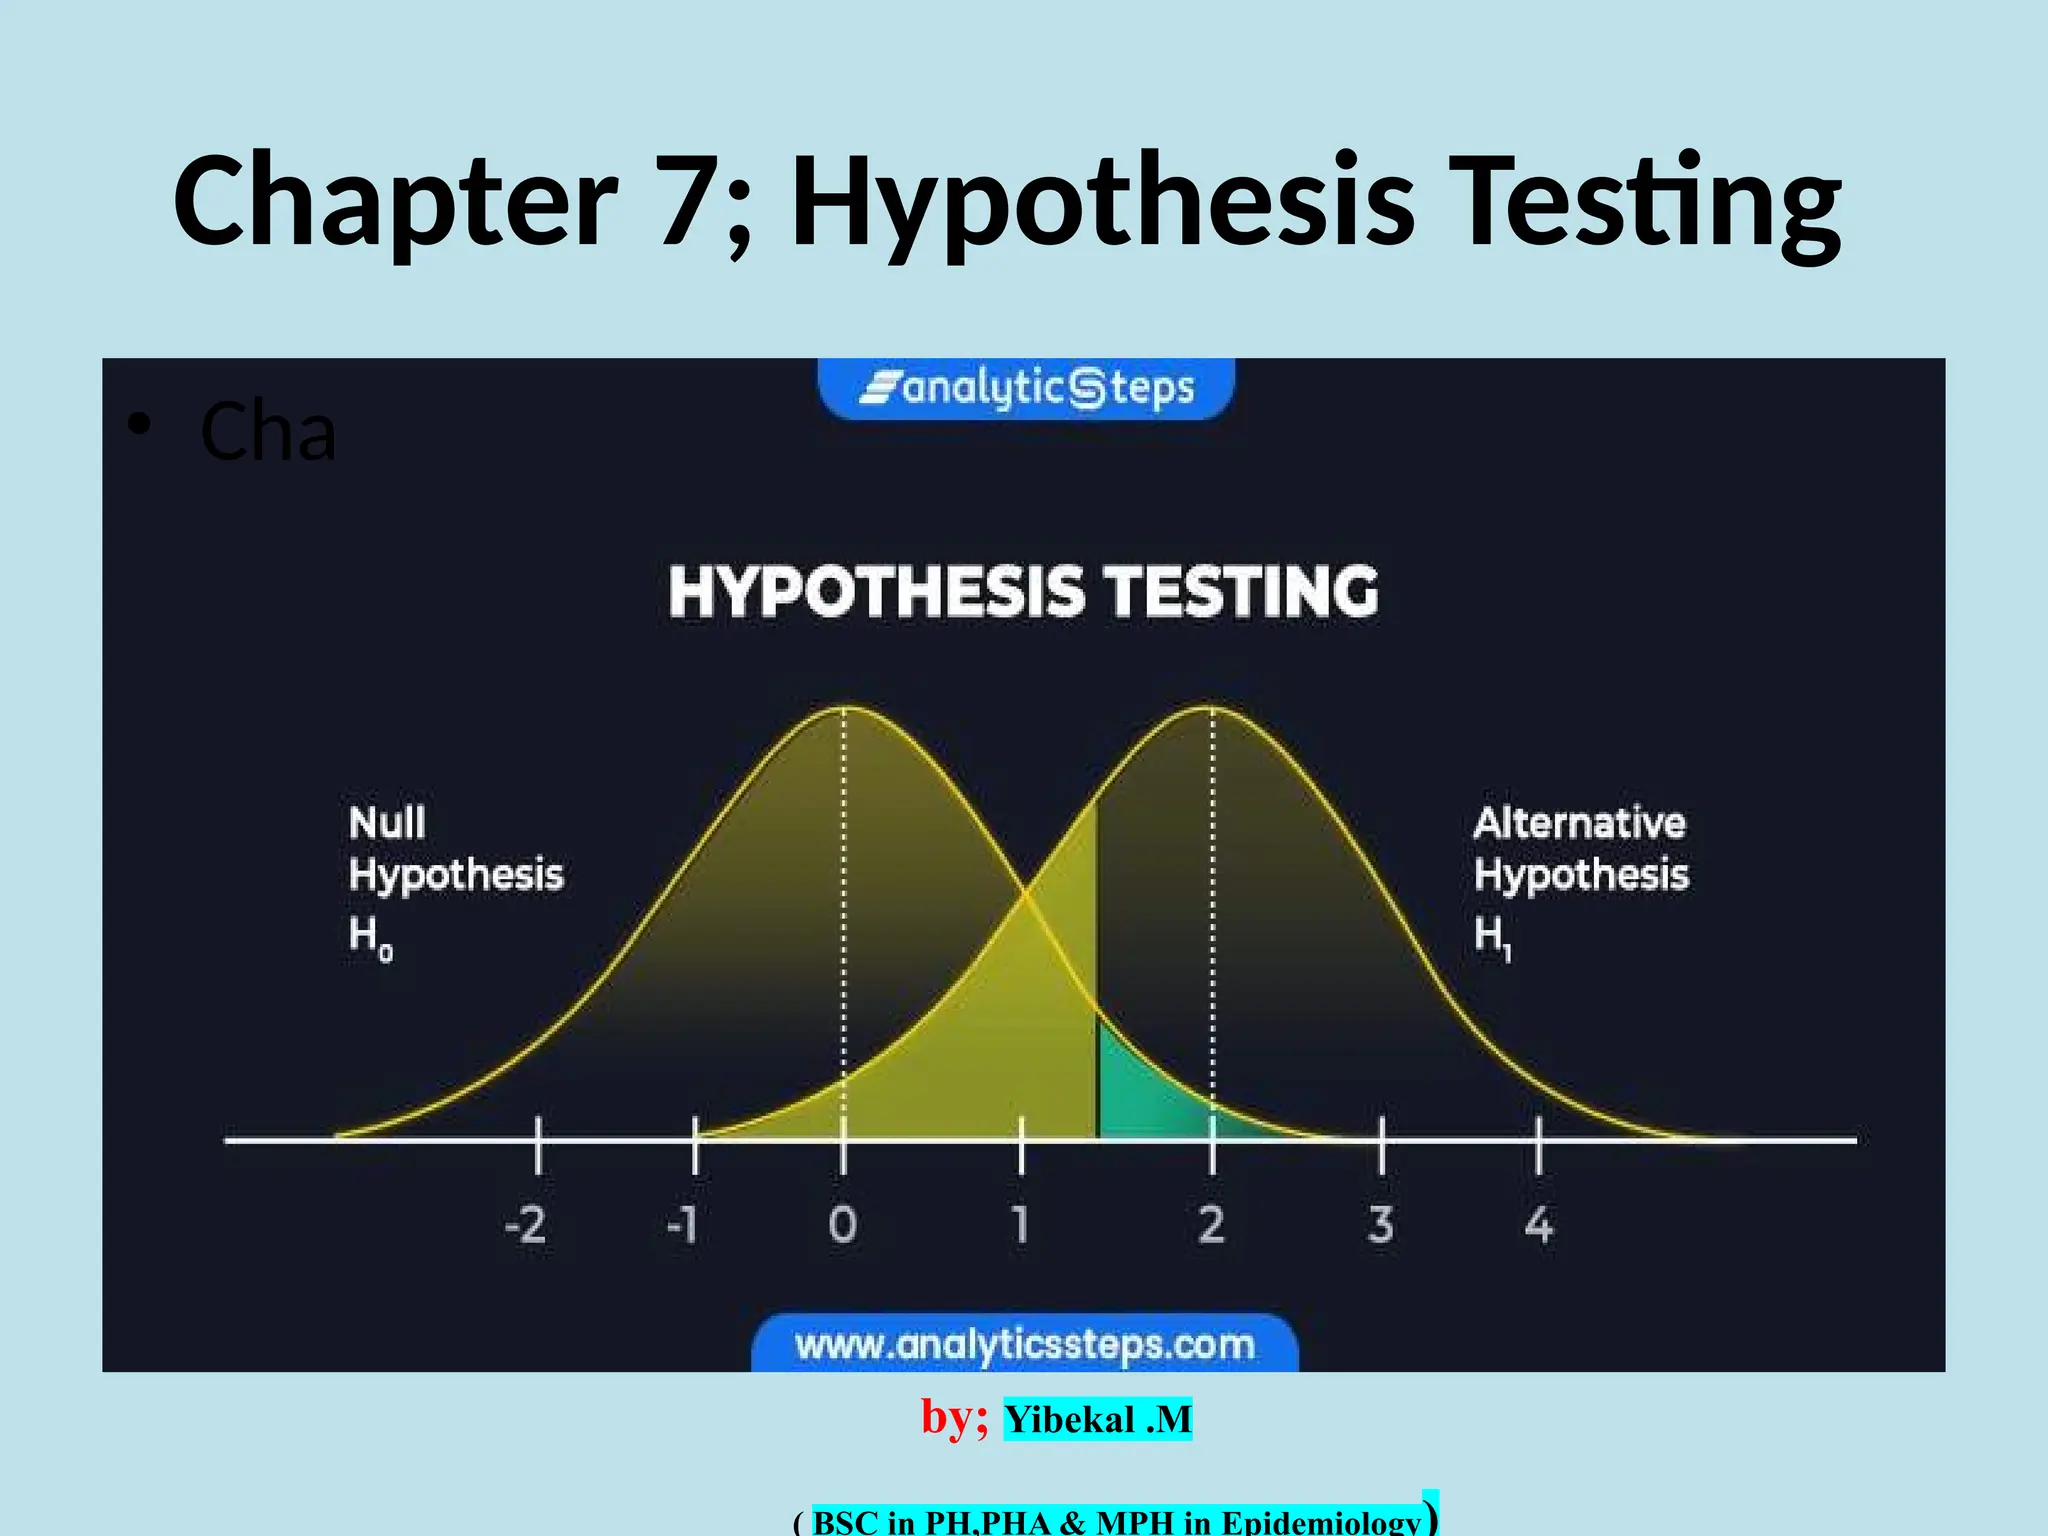
Hypothesis testing
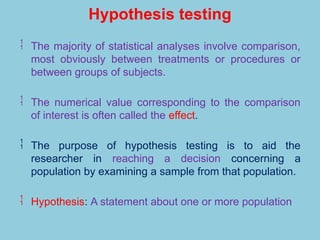
Themajority of statistical analyses involve comparison,
most obviously between treatments or procedures or
between groups of subjects.
The numerical value corresponding to the comparison
of interest is often called the effect.
The purpose of hypothesis testing is to aid the
researcher in reaching a decision concerning a
population by examining a sample from that population.
Hypothesis: A statement about one or more population
3.
Hypothesis testing…
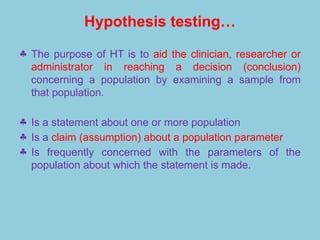
§ Thepurpose of HT is to aid the clinician, researcher or
administrator in reaching a decision (conclusion)
concerning a population by examining a sample from
that population.
§ Is a statement about one or more population
§ Is a claim (assumption) about a population parameter
§ Is frequently concerned with the parameters of the
population about which the statement is made.
4.
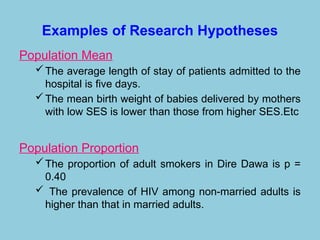
Examples of ResearchHypotheses
Population Mean
The average length of stay of patients admitted to the
hospital is five days.
The mean birth weight of babies delivered by mothers
with low SES is lower than those from higher SES.Etc
Population Proportion
The proportion of adult smokers in Dire Dawa is p =
0.40
The prevalence of HIV among non-married adults is
higher than that in married adults.
5.
Hypotheses testing
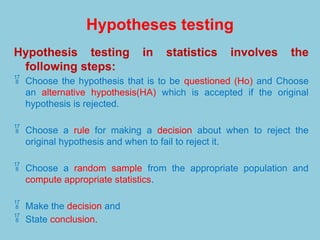
Hypothesis testingin statistics involves the
following steps:
Choose the hypothesis that is to be questioned (Ho) and Choose
an alternative hypothesis(HA) which is accepted if the original
hypothesis is rejected.
Choose a rule for making a decision about when to reject the
original hypothesis and when to fail to reject it.
Choose a random sample from the appropriate population and
compute appropriate statistics.
Make the decision and
State conclusion.
6.
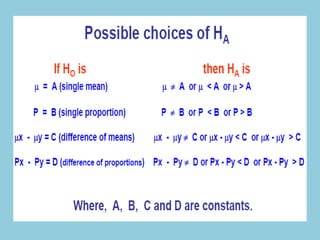
1. State nulland alternative hypotheses
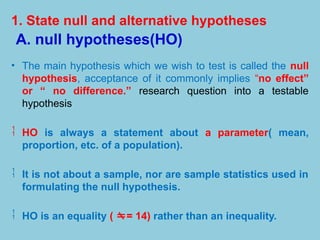
A. null hypotheses(HO)
• The main hypothesis which we wish to test is called the null
hypothesis, acceptance of it commonly implies “no effect”
or “ no difference.” research question into a testable
hypothesis
HO is always a statement about a parameter( mean,
proportion, etc. of a population).
It is not about a sample, nor are sample statistics used in
formulating the null hypothesis.
HO is an equality ( = 14) rather than an inequality.
7.
B. The AlternativeHypothesis, HA
• Is a statement of what we will believe is
true if our sample data causes us to reject
Ho.
• Is generally the hypothesis that is
believed (or needs to be supported) by the
researcher.
8.
The null andalternative hypotheses…
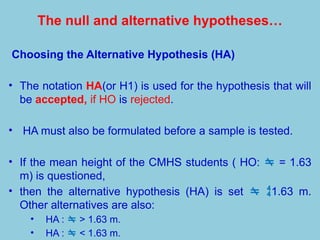
Choosing the Alternative Hypothesis (HA)
• The notation HA(or H1) is used for the hypothesis that will
be accepted, if HO is rejected.
• HA must also be formulated before a sample is tested.
• If the mean height of the CMHS students ( HO: = 1.63
m) is questioned,
• then the alternative hypothesis (HA) is set 1.63 m.
Other alternatives are also:
• HA : > 1.63 m.
• HA : < 1.63 m.
10.
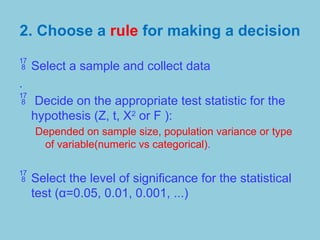
2. Choose arule for making a decision
Select a sample and collect data
.
Decide on the appropriate test statistic for the
hypothesis (Z, t, X2
or F ):
Depended on sample size, population variance or type
of variable(numeric vs categorical).
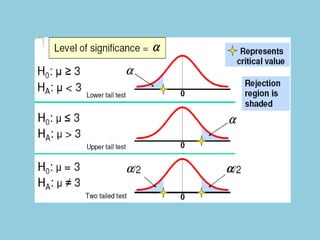
Select the level of significance for the statistical
test (α=0.05, 0.01, 0.001, ...)
11.
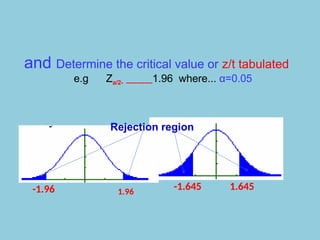
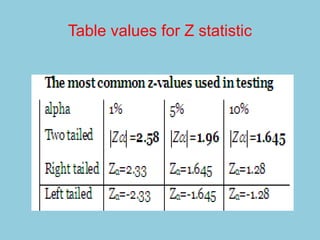
and Determine thecritical value or z/t tabulated
e.g Za/2- -------------1.96 where... α=0.05
-1.96 1.96
Rejection region
-1.645 1.645
12.
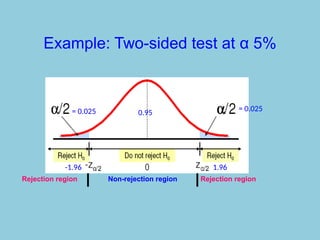
Example: Two-sided testat α 5%
Rejection region Non-rejection region Rejection region
= 0.025 = 0.025
0.95
1.96
-1.96
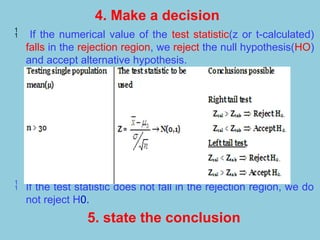
4. Make adecision
If the numerical value of the test statistic(z or t-calculated)
falls in the rejection region, we reject the null hypothesis(HO)
and accept alternative hypothesis.
If the test statistic does not fall in the rejection region, we do
not reject H0.
5. state the conclusion
16.
A. Hypothesis testabout population
mean (normally distributed)
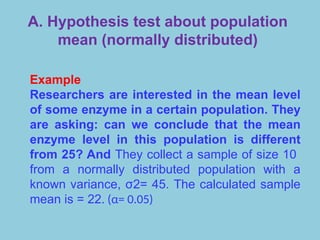
Example
Researchers are interested in the mean level
of some enzyme in a certain population. They
are asking: can we conclude that the mean
enzyme level in this population is different
from 25? And They collect a sample of size 10
from a normally distributed population with a
known variance, σ2= 45. The calculated sample
mean is = 22. (α= 0.05)
17.
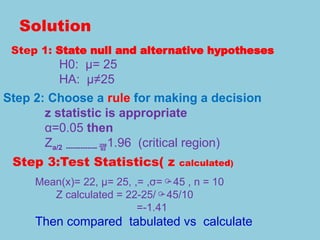
Solution
Step 1: Statenull and alternative hypotheses
H0: μ= 25
HA: μ≠25
Step 2: Choose a rule for making a decision
z statistic is appropriate
α=0.05 then
Za/2 ------------- 1.96 (critical region)
Step 3:Test Statistics( z calculated)
Mean(x)= 22, μ= 25, ,= ,σ=45 , n = 10
Z calculated = 22-25/45/10
=-1.41
Then compared tabulated vs calculate
18.
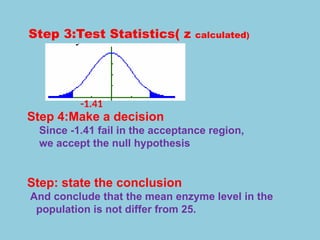
Step 3:Test Statistics(z calculated)
-1.41
Step 4:Make a decision
Since -1.41 fail in the acceptance region,
we accept the null hypothesis
Step: state the conclusion
And conclude that the mean enzyme level in the
population is not differ from 25.
19.
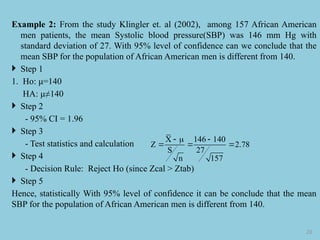
Example 2: Fromthe study Klingler et. al (2002), among 157 African American
men patients, the mean Systolic blood pressure(SBP) was 146 mm Hg with
standard deviation of 27. With 95% level of confidence can we conclude that the
mean SBP for the population of African American men is different from 140.
Step 1
1. Ho: μ=140
HA: μ≠140
Step 2
- 95% CI = 1.96
Step 3
- Test statistics and calculation
Step 4
- Decision Rule: Reject Ho (since Zcal > Ztab)
Step 5
Hence, statistically With 95% level of confidence it can be conclude that the mean
SBP for the population of African American men is different from 140.
20
X 146 140
Z 2.78
S 27
n 157
22
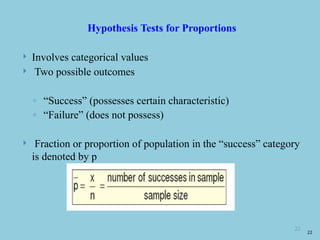
Hypothesis Tests forProportions
Involves categorical values
Two possible outcomes
◦ “Success” (possesses certain characteristic)
◦ “Failure” (does not possess)
Fraction or proportion of population in the “success” category
is denoted by p
22
22.
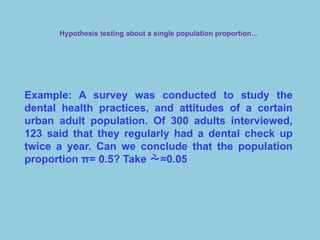
Hypothesis testing abouta single population proportion…
Example: A survey was conducted to study the
dental health practices, and attitudes of a certain
urban adult population. Of 300 adults interviewed,
123 said that they regularly had a dental check up
twice a year. Can we conclude that the population
proportion π= 0.5? Take =0.05
23.
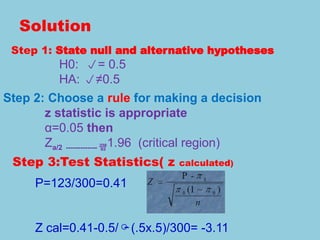
Solution
Step 1: Statenull and alternative hypotheses
H0: = 0.5
HA: ≠0.5
Step 2: Choose a rule for making a decision
z statistic is appropriate
α=0.05 then
Za/2 ------------- 1.96 (critical region)
Step 3:Test Statistics( z calculated)
P=123/300=0.41
Z cal=0.41-0.5/(.5x.5)/300= -3.11
24.
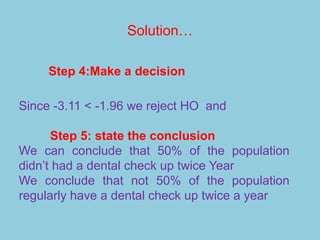
Solution…
Since -3.11 <-1.96 we reject HO and
Step 5: state the conclusion
We can conclude that 50% of the population
didn’t had a dental check up twice Year
We conclude that not 50% of the population
regularly have a dental check up twice a year
Step 4:Make a decision
26.
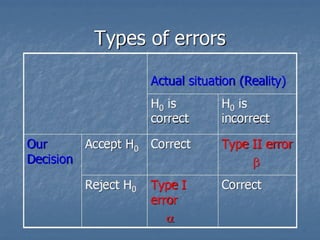
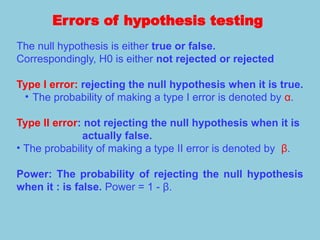
Errors of hypothesistesting
The null hypothesis is either true or false.
Correspondingly, H0 is either not rejected or rejected
Type I error: rejecting the null hypothesis when it is true.
• The probability of making a type I error is denoted by α.
Type II error: not rejecting the null hypothesis when it is
actually false.
• The probability of making a type II error is denoted by β.
Power: The probability of rejecting the null hypothesis
when it : is false. Power = 1 - β.
27.
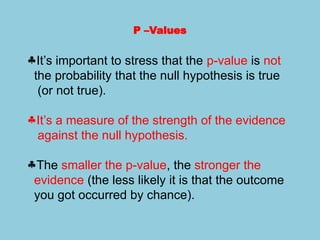
P –Values
§It’s importantto stress that the p-value is not
the probability that the null hypothesis is true
(or not true).
§It’s a measure of the strength of the evidence
against the null hypothesis.
§The smaller the p-value, the stronger the
evidence (the less likely it is that the outcome
you got occurred by chance).
28.
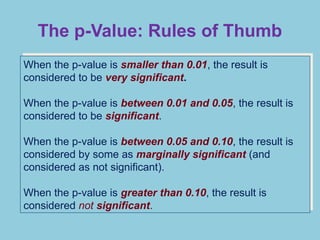
When the p-valueis smaller than 0.01, the result is
considered to be very significant.
When the p-value is between 0.01 and 0.05, the result is
considered to be significant.
When the p-value is between 0.05 and 0.10, the result is
considered by some as marginally significant (and
considered as not significant).
When the p-value is greater than 0.10, the result is
considered not significant.
The p-Value: Rules of Thumb
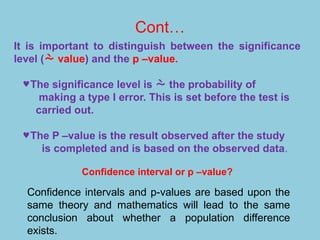
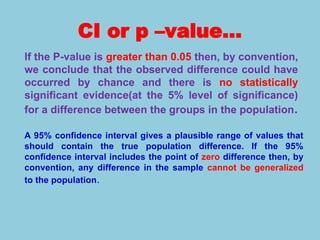
CI or p–value…
If the P-value is greater than 0.05 then, by convention,
we conclude that the observed difference could have
occurred by chance and there is no statistically
significant evidence(at the 5% level of significance)
for a difference between the groups in the population.
A 95% confidence interval gives a plausible range of values that
should contain the true population difference. If the 95%
confidence interval includes the point of zero difference then, by
convention, any difference in the sample cannot be generalized
to the population.