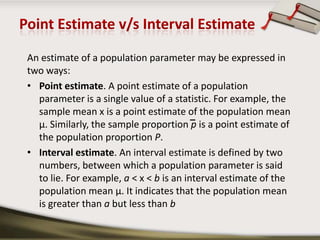
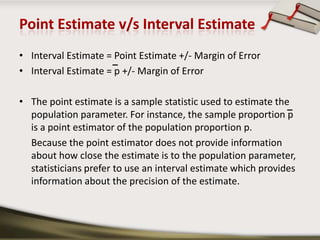
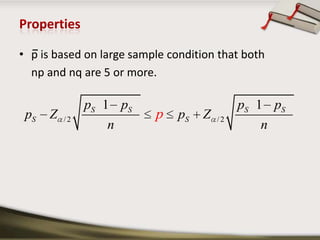
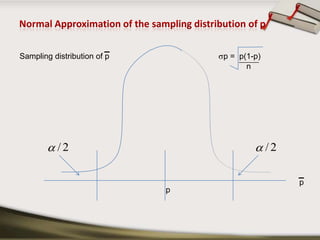
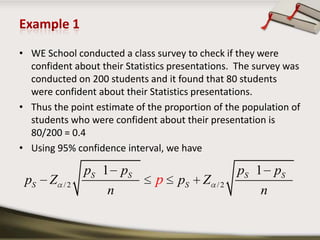
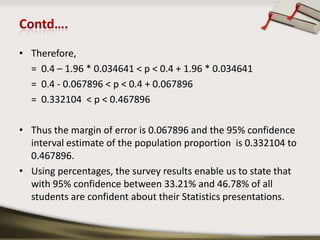
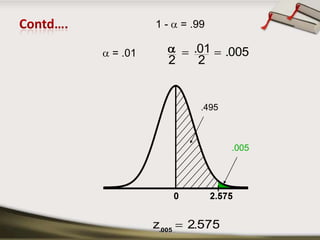
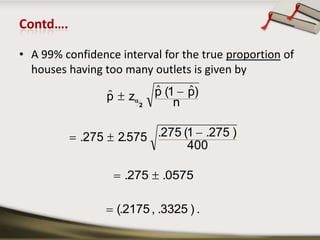
Interval Estimation for Proportions
Inference ProcessPopulationEstimates,  Tests and ConclusionsSample StatisticsSample x  p
Statistical EstimationEstimateInterval estimatePoint estimate confidence interval for mean
 confidence interval for proportion
 sample mean
 sample proportionPoint Estimate v/s Interval EstimateAn estimate of a population parameter may be expressed in two ways: Point estimate. A point estimate of a population parameter is a single value of a statistic. For example, the sample mean x is a point estimate of the population mean μ. Similarly, the sample proportion p is a point estimate of the population proportion P.Interval estimate. An interval estimate is defined by two numbers, between which a population parameter is said to lie. For example, a < x < b is an interval estimate of the population mean μ. It indicates that the population mean is greater than a but less than b
Point Estimate v/s Interval EstimateInterval Estimate = Point Estimate +/- Margin of ErrorInterval Estimate = p +/- Margin of ErrorThe point estimate is a sample statistic used to estimate the population parameter. For instance, the sample proportion p is a point estimator of the population proportion p.	Because the point estimator does not provide information about how close the estimate is to the population parameter, statisticians prefer to use an interval estimate which provides information about the precision of the estimate.
Propertiesp is based on large sample condition that both np and nq are 5 or more.
Normal Approximation of the sampling distribution of pSampling distribution of psp =  p(1-p)_____npp
Example 1WE School conducted a class survey to check if they were confident about their Statistics presentations.  The survey was conducted on 200 students and it found that 80 students were confident about their Statistics presentations.Thus the point estimate of the proportion of the population of students who were confident about their presentation is 80/200 = 0.4Using 95% confidence interval, we have
Contd….Therefore,	=  0.4 – 1.96 * 0.034641 < p < 0.4 + 1.96 * 0.034641	=  0.4 - 0.067896 < p < 0.4 + 0.067896 	=  0.332104  < p < 0.467896 Thus the margin of error is 0.067896 and the 95% confidence interval estimate of the population proportion  is 0.332104 to 0.467896. Using percentages, the survey results enable us to state that with 95% confidence between 33.21% and 46.78% of all students are confident about their Statistics presentations.
Example 2The Peacock Cable Television Company thinks that 40% of their customers have more outlets wired than they are paying for.A random sample of 400 houses reveals that 110 of the houses have excessive outlets.Construct a 99% confidence interval for the true proportion of houses having too many outlets.
Contd…..Do you feel the company is accurate in its belief about the proportion of customers who have more outlets wired than they are paying for? X = number of houses that have excessive outlets   = 110,n = 400,and the confidence level = .99.Thus,
Contd…..495.0051 - a = .99a = .01
Contd….A 99% confidence interval for the true proportion of houses having too many outlets is given by

Interval estimation for proportions

  • 1.
  • 2.
    Inference ProcessPopulationEstimates, Tests and ConclusionsSample StatisticsSample x p
  • 3.
    Statistical EstimationEstimateInterval estimatePointestimate confidence interval for mean
  • 4.
    confidence intervalfor proportion
  • 5.
  • 6.
    sample proportionPointEstimate v/s Interval EstimateAn estimate of a population parameter may be expressed in two ways: Point estimate. A point estimate of a population parameter is a single value of a statistic. For example, the sample mean x is a point estimate of the population mean μ. Similarly, the sample proportion p is a point estimate of the population proportion P.Interval estimate. An interval estimate is defined by two numbers, between which a population parameter is said to lie. For example, a < x < b is an interval estimate of the population mean μ. It indicates that the population mean is greater than a but less than b
  • 7.
    Point Estimate v/sInterval EstimateInterval Estimate = Point Estimate +/- Margin of ErrorInterval Estimate = p +/- Margin of ErrorThe point estimate is a sample statistic used to estimate the population parameter. For instance, the sample proportion p is a point estimator of the population proportion p. Because the point estimator does not provide information about how close the estimate is to the population parameter, statisticians prefer to use an interval estimate which provides information about the precision of the estimate.
  • 8.
    Propertiesp is basedon large sample condition that both np and nq are 5 or more.
  • 9.
    Normal Approximation ofthe sampling distribution of pSampling distribution of psp = p(1-p)_____npp
  • 10.
    Example 1WE Schoolconducted a class survey to check if they were confident about their Statistics presentations. The survey was conducted on 200 students and it found that 80 students were confident about their Statistics presentations.Thus the point estimate of the proportion of the population of students who were confident about their presentation is 80/200 = 0.4Using 95% confidence interval, we have
  • 11.
    Contd….Therefore, = 0.4– 1.96 * 0.034641 < p < 0.4 + 1.96 * 0.034641 = 0.4 - 0.067896 < p < 0.4 + 0.067896 = 0.332104 < p < 0.467896 Thus the margin of error is 0.067896 and the 95% confidence interval estimate of the population proportion is 0.332104 to 0.467896. Using percentages, the survey results enable us to state that with 95% confidence between 33.21% and 46.78% of all students are confident about their Statistics presentations.
  • 12.
    Example 2The PeacockCable Television Company thinks that 40% of their customers have more outlets wired than they are paying for.A random sample of 400 houses reveals that 110 of the houses have excessive outlets.Construct a 99% confidence interval for the true proportion of houses having too many outlets.
  • 13.
    Contd…..Do you feelthe company is accurate in its belief about the proportion of customers who have more outlets wired than they are paying for? X = number of houses that have excessive outlets = 110,n = 400,and the confidence level = .99.Thus,
  • 14.
  • 15.
    Contd….A 99% confidenceinterval for the true proportion of houses having too many outlets is given by