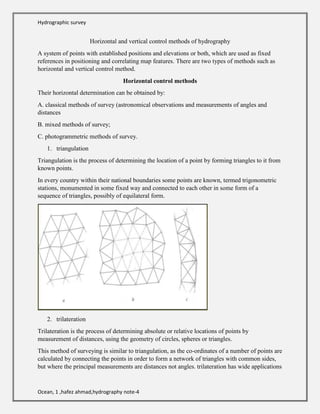
Hydrographic survey
Ocean, 1 ,hafez ahmad,hydrography note-4
Horizontal and vertical control methods of hydrography
A system of points with established positions and elevations or both, which are used as fixed
references in positioning and correlating map features. There are two types of methods such as
horizontal and vertical control method.
Horizontal control methods
Their horizontal determination can be obtained by:
A. classical methods of survey (astronomical observations and measurements of angles and
distances
B. mixed methods of survey;
C. photogrammetric methods of survey.
1. triangulation
Triangulation is the process of determining the location of a point by forming triangles to it from
known points.
In every country within their national boundaries some points are known, termed trigonometric
stations, monumented in some fixed way and connected to each other in some form of a
sequence of triangles, possibly of equilateral form.
2. trilateration
Trilateration is the process of determining absolute or relative locations of points by
measurement of distances, using the geometry of circles, spheres or triangles.
This method of surveying is similar to triangulation, as the co-ordinates of a number of points are
calculated by connecting the points in order to form a network of triangles with common sides,
but where the principal measurements are distances not angles. trilateration has wide applications
Hydrographic survey
Ocean, 2 ,hafez ahmad,hydrography note-4
and can totally replace triangulations; however, the two methods normally coexist giving rise to
mixed networks.
3. Traverse
A method of surveying in which a sequence of lengths and directions of lines between points on
the earth are obtained from field measurements, and used in determining positions of the points.
The traverse surveys are frequently used in topography when undertaking more specific surveys
over large areas or where lines of sight are obscured. These surveys are conducted by determining
the coordinates of numerous points, connected to form a polygonal network. With the exception
for the first and last points, the stations in a traverse have to be accessible and generally each
station is visible from both the preceding and the following, marks for measurement of angles and
distances.
4. Oriented Open Traverse (over-determined)
5. Not Oriented Closed Traverse
Hydrographic survey
Ocean, 3 ,hafez ahmad,hydrography note-4
6. Photogrammetric method
Photogrammetry is a widespread technique for topographic surveying of the ground or objects
through the use of photographs taken from different view points. Conventional Photogrammetry
is usually divided into two categories:
a. Terrestrial Photogrammetry, in which the photographs are taken from points on the
ground;
b. Aerial Photogrammetry, in which photographs are taken from aircraft.
7. Aerophotogrammetry (Air photogrammetry)
Almost all charts are created by air photogrammetry. Due to this technique it is possible to
generate topographical charts of large areas in relatively short times, instead of the many
years required for traditional techniques.
Aerial photographs can be produced in different ways, depending on the kind of chart to be
created and on the kind of camera to be used. Air photogrammetry generally employs
cameras with nadir photographs (also called nadir point or plumb point), that is with the optic
axis coincident with the vertical axis. This has the advantage of providing photograms with a
constant scale if the ground is flat as well as allowing photogram stereoscopic observation.
8. The digital photogrammetry
Hydrographic survey
Ocean, 4 ,hafez ahmad,hydrography note-4
9. Aerotriangulation (Aerial triangulation)
In the conduct of a photogrammetric survey, the co-ordinate determination of the ground
control points is generally the phase which requires the greatest employment of time, at least
5 point for every model, which is for every pair. To reduce the number required, the co
ordinates of some can be also obtained through photogrammetric methods, through aerial
triangulation.
10. Inter-visibility of Geodetic Stations
Vertical control methods
1. Geometric levelling (Spirit levelling method)
Levelling are operations which allow the measurement of difference orthometric heights (or
Geoid elevations) between points or their difference in elevation.
The principle of the geometric levelling is: consider two points (A and B) to be a brief distance
apart, not more than around 100 meters.
2. Trigonometric levelling (Trigonometrically heighting)
Trigonometric levelling is based on the use of a theodolite for the measurement of zenithal angles.
It is employed for any distances, from a few meters to over 10 kms; it is often used for the
determination of the elevations of positions in triangulation, it is also applied in other cases, such
as when the distance between the points, for which the difference of elevation is required, is already
known.
3. Altimetry with GPS (GNSS Vertical Control Method)
GPS (exploiting the relative positioning) generates the base-line components between the surveyed
positions, from which the XYZ geocentric co-ordinates are obtained in the WGS84 reference
system. The ϕ, λ & h ellipsoidal co-ordinates are obtained with transformation formulae.
Hydrographic survey
Ocean, 5 ,hafez ahmad,hydrography note-4
Theodolite
The theodolite is an instrument which measures azimuth angles, via a graduated horizontal
circle, and zenithal angles, via a graduated vertical circle.
Precision of theodolites in the measurement of angles varies from 0.1" to 10"; the tacheometris
are differentiated from theodolites due to their lower obtainable precisions, from 10" to 10',
in angular measurements.
In a theodolite three axes can be identified:
a. the primary axis, around which the alidade rotates
b. the secondary axis, around which the telescope rotates;
c. the axis of collimation of the telescope.
The principal parts of a theodolite are:
a. the base (or tribrach), provided with a pedestal and three adjusting screws (levelling screws)
on the basal plate which is the lowest part of the theodolite connected to the head of the tripod
(or stand and legs), so as to be able, within certain limits, to centre the instrument over the
reference mark. The lower spirit level or circular level (also termed universal level or bull’s eye
level) and the optic lead are anchored to it.
b. the alidade is a generally U-shaped frame, which can rotate around the vertical axis passing
through the center of the instrument (primary axis) and contains the engraved horizontal circle
reading index. An upper spirit level (termed spirit bubble or sensitive bubble) is anchored to it to
make the primary axis vertical and to set the origin of the zenith angles to the zenith, residual errors
excepted.
c. the graduated horizontal circle, situated above the pedestal and under the alidade.
d. the telescope, hinged to the alidade so that its axis of collimation is perpendicular to its axis of
rotation. The telescope has a magnification from 28 to 45 times, thus increasing the precision of
the measurements.
e. the vertical circle, rigidly connected to the telescope, for reading of the zenithal angles The
theodolite can be of two types, depending on the system of lock used for the horizontal circle:
repeating and reiterating
GPS The system is divided into:
a. The spatial segment: is formed by 24 satellites in near circular orbit around the Earth at a height
of about 20,200 kms. The satellites are distributed in groups of 4 about 6 circular orbits tilted 55°
to the equatorial plane with a revolution period of about 12 hours. This constellation distribution
ensures the visibility of at least 4 satellites (often 6 to 8) at all times and places with an elevation
above 15° degrees from the horizon, which is fundamental for the positioning.
The satellites have the followings functions:
• To transmit information to users through a radio signal;
Hydrographic survey
Ocean, 6 ,hafez ahmad,hydrography note-4
• To maintain an accurate reference time due to the high degree of accuracy (from 10-12 to 10-14
sec) of the caesium and rubidium atomic clocks on board;
• To receive and to store information from the control segment;
• To make corrections to orbits.
The satellites have been launched in different epochs, starting in 1978, in blocks which replaced
earlier models with more advance ones.
b. Control segment: comprises 5 monitoring stations and an additional sixth at Sunnyvale, USA,
where a copy of all the selected data and all the attached operations are preserved. Among the five
stations, all of which are provided with meteorological stations for the evaluation of the
troposphere affects on the radio signals sent by satellites, three stations (Ascension, Diego Garcia
and Kwajalein) have the ability to send messages to the satellites and one (Colorado Springs, USA)
is the Master station, where the necessary calculations for the determination of the new orbits are
performed.
In summary the tasks of the control segment are:
• To continuously track the satellites and to process the received data for the calculation of the
timing-space position (Ephemeris);
• To check the general state of the system, in particular the satellite clocks;
• To implement orbit corrections;
• To upload new data to the satellites, including the forecast Ephemeris for the next 12 or
24 hours, which are then transmitted to users.
c. The user segment: is made up of users equipped with receivers with GPS antennas. These are
passive systems in that they are able to acquire data without emitting some signal. Various types
of receivers exist depending on the strategy used to analyze the received signal and the required
positional accuracy.
d. The signal structure: Every satellite continually emits electromagnetic waves on carefully
chosen frequencies to a very small sector on the earth’s surface and is thus relatively sheltered
from interference. These carrier waves transport the information to the user through code
modulation. The onboard clocks produce a primary frequency f0 = 10.23 MHz; from this primary
frequency the three fundamental parts of the GPS signal are precisely originated.
1. A topographic map of the ocean floor, or the bed of a lake.
2. Generally, bathymetric maps show depths by contour lines and gradient tints.
Bathymetric charts are designed to present accurate, measurable description and visual
presentation of the submerged terrain.
Hydrographic survey
Ocean, 7 ,hafez ahmad,hydrography note-4
1. A chart specifically designed to meet the requirements of marine navigation, showing depth of
water, nature of bottom, elevations, configuration and characteristics of coasts, dangers and aids
to navigation.
2 Safety navigation is the primary issue.
3 Used by mariners
4 It is a map that depicts the configuration of the shoreline and seafloor.
Waypoints are sets of coordinates that identify a point in physical space. Coordinates used can
vary depending on the application. For terrestrial navigation these coordinates can include
longitude and latitude. Air navigation also includes altitude. Waypoints have only become
widespread for navigational use by the layman since the development of advanced navigational
systems, such as the Global Positioning System (GPS) and certain other types of radio navigation.
Waypoints located on the surface of the Earth are usually defined in two dimensions (e.g.,
longitude and latitude)
Acoustic methods
1: Single beam echo sounders
These echo sounders are devices for depth determination by measuring the time interval between the
emission of a sonic or ultrasonic pulse and the return of its echo from the seabed. Traditionally, the main
purpose of the echo sounder is to produce a consistent and high resolution vertical
seabed profile on echo trace. The echo trace, after a cautious interpretation, is sampled and digitized
manually to produce soundings. During the last decade, the technology applied in SBES has progressively
improved with automatic digitisers, recorders without moving parts and annotation of positions on the echo
trace. Recently, built-in computers and signal processors have allowed more sophisticated real time signal
processing and data presentation on graphical color displays, rather than a paper recorder.
2: Multibeam systems
MBES are a valuable tool for depth determination when full seafloor coverage is required. These systems
may allow complete seafloor ensonification with the consequent increase in resolution and detection
capability. Principles of operation. Multibeam principle of operation is, in general, based on a fan shaped
transmission pulse directed towards the seafloor and, after the reflection of the acoustic energy by the
seabed; several beams are electronically formed, using signal processing techniques, with known beam
angles.
Hydrographic surveying deals with the configuration of the bottom and adjacent land areas of
oceans, lakes, rivers, harbours, and other water forms on Earth. In strict sense, it is defined merely
as the surveying of a water area; however, in modern usage it may include a wide variety of other
objectives such as measurements of tides, current, gravity, earth magnetism, and determinations
of the physical and chemical properties of water. The principal objective of most hydrographic
surveys, is to obtain basic data for the compilation of nautical charts with emphasis on the features
Hydrographic survey
Ocean, 8 ,hafez ahmad,hydrography note-4
that may affect safe navigation. Other objectives include acquiring the information necessary for
related marine navigational products and for coastal zone management, engineering, and science.
The purpose of hydrographic surveying is:
• To collect, with systematic surveys at sea, along the coast and inland, georeferenced data related
to:
♦ Shoreline configuration, including man made infrastructure for maritime navigation i.e. all those
features on shore that are of interest to mariners.
♦ Depths in the area of interest (including all potential hazards to navigation and other marine
activities).
♦ Sea bottom composition.
♦ Tides and Currents.
♦ Physical properties of the water column.
• To process the information collected in order to create organized databases capable of feeding
the production of thematic maps, nautical charts and other types of documentation for the
following most common uses :
♦ Maritime navigation and traffic management.
♦ Naval operations.
♦ Coastal zone management.
♦ Marine environment preservation.
♦ Exploitation of marine resources and laying of submarine cables/pipelines.
♦ Maritime boundaries definition (Law of the Sea implementation).
♦ Scientific studies.
Survey Specifications
Requirements for hydrographic surveys arise as the result of policy decisions, product user reports or
requests, national defence needs, and other demands. The inception of a specific hydrographic survey
project follows an evaluation of all known requirements and the establishment of priorities. Among the
many objective and subjective factors that influence the establishment of priorities are national and
agency goal, quantitative and qualitative measures of shipping and boating, the adequacy of existing
surveys, and the rate of change of the submarine topography in the area
Survey Planning
Survey planning covers a wide range of activities from the development of an idea for a survey within the
Hydrographic survey
Ocean, 9 ,hafez ahmad,hydrography note-4
Hydrographic Office and its subsequent issue as Project Instructions / Hydrographic Instructions (HIs), to
the detailed planning and organization of a surveying ship to fulfil a practical task. It covers inter
departmental liaison at Government level, diplomatic cooperation and the allocation of numerous expensive
resources. It also covers prioritization of resources and day to day running of a survey ship employed on
surveying task. Survey planning involves blending of these activities into a coherent pattern aimed at the
achievement of a specific task.
A survey begins long before actual data collection starts. Some elements, which must be decided, are7:
• Exact area of the survey.
• Type of survey (reconnaissance or standard) and scale to meet standards of chart to be produced.
• Scope of the survey (short or long term).
• Platforms available (ships, launches, aircraft, leased vessels, cooperative agreements).
• Support work required (aerial or satellite photography, geodetics, tides).
• Limiting factors (budget, political or operational constraints, positioning systems limitations, logistics).
Once these issues are decided, all information available in the survey area is reviewed. This includes aerial
photography, satellite data, topographic maps, existing nautical charts, geodetic information, tidal
information, and anything else affecting the survey. HO will normally undertake this strategic planning of
surveys in cooperation with other organizations and, from this, Projects Instructions / Hydrographic
Instructions (HIs) will be compiled by the Hydrographer and issued for compliance. Details provided in
Project Instructions / HIs will include some or all of the following, depending on the type of survey
required8:
• Survey limits.
• Data requirement and resolution.
• Method of positional control, together with the accuracy expected.
• Use to be made of sonar.
• How the survey report is to be rendered and target date if appropriate.
• A general, and at times detailed, description of the reason for the survey priorities, methods to be
employed, particular observations to be made and other relevant guidance or instruction.
Development of a general survey plan and subsequent site specific survey plans will create a more
efficient survey. The general survey plan addresses the way that surveys are planned, performed, and
processed. This plan must be well thought out and robust to account for as many contingencies as possible.
This plan includes training, software, equipment maintenance and upgrades, logistics, all data requirements,
schedule, safety, and weather. The site specific survey plan will address local notifications, survey lines,
datum, data density, and specific equipment and personnel that will meet the general survey plan
requirements. Few are described below:
• Training of surveyors should be catered during a survey operation in order to ensure appropriate
competencies are maintained.
Hydrographic survey
Ocean, 10 ,hafez ahmad,hydrography note-4
• Data logging and processing software are critical in a survey operation. These should be user friendly
and personnel employed on these need to be well conversant with its all functions.
• Suitable survey platform and equipment should be selected. Some equipment will lend itself to particular
types of surveys and others will be more general in use. It is paramount that a proper selection is made.
• The purpose for the survey will usually dictate the data requirement (density, coverage, and precision).
However, if there are no impact to cost and schedule, then as many requirements should be addressed as
possible.
• Schedule is often a critical element in a hydrographic survey. The data requirement usually has as a
specific deliverable date assigned, such that the survey data collection and processing occur within a very
specific time frame. This requires that the personnel and equipment resources be adequate to meet this need.
In some cases, if the schedule cannot be met, then the survey simply will not be requested and other sources
will be used. Considering this, it is important to plan and analyze all aspects of a general survey plan with
the ability to meet schedule as a prime element.
Safety is the primary consideration. It is incumbent on the person in charge in the field to evaluate
every situation for possible hazards. If there is an identified hazard, then it needs to be addressed
before continuing with the activity.
4. Notifications to the local authorities / harbor master office should be made with enough time to
allow
them to notify the local mariners.
• Survey lines for multibeam surveys should follow the contours of the harbour bottom. This will
reduce the changes in bottom coverage created by different water depths. However, when using a
single beam survey system, the lines should run perpendicular to contours. This will help in
determining changes in the bottom relief.
Multibeam survey lines also need to be spaced so as to achieve the proper amount of overlap or data
density to meet the survey standard.
• An integral part of the data of a survey is the reference datum. It is required, by good survey practice, to
clearly indicate by note on the published survey the actual vertical and horizontal reference used, and the
procedures used to establish the datum for the survey. WGS-84 is being used worldwide.
• Data density will vary based on method of survey, water depth, and need. The method of survey will
be determined by equipment available for the survey, the personnel, and survey site conditions. If only a
single beam survey system is available, then data density will be less. With a multibeam system, the
greater the water depth the less dense the data will be, unless multiple passes are made. The type of
survey will dictate the data redundancy or data overlap requirements.
• It is important to standardize the equipment as much as possible to limit training, maintenance and
overheads.
1: Data Gathering
Hydrographic survey
Ocean, 11 ,hafez ahmad,hydrography note-4
Data gathering is dependent upon various factors. The survey requirements, the platform and equipment
available and the time specified for a particular task will determine the amount of data to be collected. A
large amount of data can be collected using latest hydrographic software’s and tools like multibeam echo
sounders. In particular, the purpose of the survey will usually dictate the data requirement (data density,
data coverage, and data precision). However, if there is no impact to cost and schedule, then as many data
may be collected as possible during field survey. The data collection be made in methodical manner
starting from one side of the area ending on other. It should be noted that data redundancy and data
density are not the same thing. Data density is the number of soundings per unit of area, while data
redundancy refers to data overlap or data collected at a different time at the same location. The type of
survey defines data redundancy or data overlap requirements. Full coverage surveys deal more with data
density insuring that all bottom features/obstructions have been located. These need to be clearly
understood by those requesting the survey and those doing the survey to insure compliance with the
standards specified by IHO.
2:Data Processing
Data processing must be done under strict quality control criteria. Hydrographic data is either collected by
automated systems or converted into an automated format. Final data processing and plotting are
accomplished using onboard or office-based computer systems. A standard approach for a hydrographic
survey is the collect-process-collect methodology9. The data collected is processed and subsequently gaps
and areas with questionable data re-surveyed. Most of the hydrographic systems are capable of performing
“field-finish” operations, wherein survey data is collected, processed, plotted and analyzed in the field.
Comprehensive survey planning is required for an integrated approach that generates the base line for all
real-time and post processing operation with the system.
3: Data Analysis
The accuracy of the results of survey measurement should always be quoted to show how good or
reliable they are. Since no equipment is entirely free of errors, therefore, errors are introduced in all
observations. In addition, errors are introduced in computations by approximations in formulae or by
rounding. Observational techniques are designed to eliminate all but small random errors, which can then
be analyzed by rigorous techniques to quantify the accuracy of the observations.
4: Data Quality
Quality is about “fitness for the use”. It has to do with the extent to which a data set, or map output
satisfied the needs of the person judging it. Error is the difference between actual and true data.
Error is a major issue in quality. It is often used as an umbrella term to describe all the types of the
effects that cause data to depart from what they should be12. To allow a comprehensive assessment
of the quality of
survey data, it is necessary to record or document certain information together with the survey
data. Such information is important to allow exploitation of survey data by a variety of users with
different requirements, especially as requirements may not be known when survey data is
collected. The process of documenting the data quality is called data attribution; the information
on the data quality is called metadata. Metadata should comprise at least information on:
• The survey in general as e.g. date, area, equipment used, name of survey platform.
Hydrographic survey
Ocean, 12 ,hafez ahmad,hydrography note-4
• The geodetic reference system used, i.e. horizontal and vertical datum; including ties to WGS 84
if a local datum is used.
• Calibration procedures and results.
• Sound velocity.
• Tidal datum and reduction.
• Accuracies achieved and the respective confidence levels.
Metadata should preferably be in digital form and an integral part of the survey record. If this is
not feasible similar information should be included in the documentation of a survey. Data quality
can be achieved by effective quality control either by automatic or manual means.
• Automatic (Non-interactive) Quality Control: In this, the coordinates (i.e. positions and depths)
obtained should be controlled automatically by a programme using suitable statistical algorithms
which have been documented, tested and demonstrated to produce repeatable and accurate results.
• Manual (Interactive) Quality Control: In this, the use of 3-D visualization tools is strongly
recommended. These tools should allow viewing the data using a zoom facility. The interactive
processing system should also offer different display modes for visualization, e.g. depth plot, error
plot, single profile, single beam, backscatter imagery etc. and should allow for the visualization of
the survey data in conjunction with other useful information as e.g. shoreline, wrecks, aids to
navigation etc. editing of data should be possible in all modes and include an audit trail. If feasible,
data displays should be geo-referenced. The flags set during the automatic stage, which correspond
to depths shallower than the surrounding area, should require explicit operator action, at least, for
Special Order and Order 1 surveys. If the operator overrules flags set during the automatic stage,
this should be documented. If a flag is set by the operator, the type of flag used should indicate
this.
Zone of confidence
The ZOC concept was developed by the IHO to provide a mean of classifying bathymetric data.
ZOC provide a simple and logical mean of displaying to the mariner the confidence that the
national charting authority places on any particular selection of bathymetric data. It seeks to
classify areas for navigation by identifying the various levels of confidence that can be placed in
the underlying data using a combination of the following criteria:
* Depth and position accuracy,
* Thoroughness of seafloor search, and
* Conformance to an approved quality plan.
Under this concept six ZOCs were developed and subsequently approved for inclusion as a part of
IHO S- 57. ZOCs A1, A2, and B are generated from modern and future surveys with, critically,
ZOCs A1 and A2 requiring a full area search. ZOCs C and D reflect low accuracy and poor quality
data whilst ZOC U represents data which is un-assessed at the time of publication. ZOCs are
Hydrographic survey
Ocean, 13 ,hafez ahmad,hydrography note-4
designed to be depicted on paper charts, as an insert diagram in place of the current reliability
diagram, and on electronic displays. It must be emphasized that ZOCs are a charting standard and
are not intended to be used for specifying standards for hydrographic surveys or for the
management of data quality. The depth and position accuracy specified for each ZOC refer to the
errors of the final depicted soundings and include not only survey errors but also any other errors
introduced in the chart production process.

Hydrography documents

  • 1.
    Hydrographic survey Ocean, 1,hafez ahmad,hydrography note-4 Horizontal and vertical control methods of hydrography A system of points with established positions and elevations or both, which are used as fixed references in positioning and correlating map features. There are two types of methods such as horizontal and vertical control method. Horizontal control methods Their horizontal determination can be obtained by: A. classical methods of survey (astronomical observations and measurements of angles and distances B. mixed methods of survey; C. photogrammetric methods of survey. 1. triangulation Triangulation is the process of determining the location of a point by forming triangles to it from known points. In every country within their national boundaries some points are known, termed trigonometric stations, monumented in some fixed way and connected to each other in some form of a sequence of triangles, possibly of equilateral form. 2. trilateration Trilateration is the process of determining absolute or relative locations of points by measurement of distances, using the geometry of circles, spheres or triangles. This method of surveying is similar to triangulation, as the co-ordinates of a number of points are calculated by connecting the points in order to form a network of triangles with common sides, but where the principal measurements are distances not angles. trilateration has wide applications
  • 2.
    Hydrographic survey Ocean, 2,hafez ahmad,hydrography note-4 and can totally replace triangulations; however, the two methods normally coexist giving rise to mixed networks. 3. Traverse A method of surveying in which a sequence of lengths and directions of lines between points on the earth are obtained from field measurements, and used in determining positions of the points. The traverse surveys are frequently used in topography when undertaking more specific surveys over large areas or where lines of sight are obscured. These surveys are conducted by determining the coordinates of numerous points, connected to form a polygonal network. With the exception for the first and last points, the stations in a traverse have to be accessible and generally each station is visible from both the preceding and the following, marks for measurement of angles and distances. 4. Oriented Open Traverse (over-determined) 5. Not Oriented Closed Traverse
  • 3.
    Hydrographic survey Ocean, 3,hafez ahmad,hydrography note-4 6. Photogrammetric method Photogrammetry is a widespread technique for topographic surveying of the ground or objects through the use of photographs taken from different view points. Conventional Photogrammetry is usually divided into two categories: a. Terrestrial Photogrammetry, in which the photographs are taken from points on the ground; b. Aerial Photogrammetry, in which photographs are taken from aircraft. 7. Aerophotogrammetry (Air photogrammetry) Almost all charts are created by air photogrammetry. Due to this technique it is possible to generate topographical charts of large areas in relatively short times, instead of the many years required for traditional techniques. Aerial photographs can be produced in different ways, depending on the kind of chart to be created and on the kind of camera to be used. Air photogrammetry generally employs cameras with nadir photographs (also called nadir point or plumb point), that is with the optic axis coincident with the vertical axis. This has the advantage of providing photograms with a constant scale if the ground is flat as well as allowing photogram stereoscopic observation. 8. The digital photogrammetry
  • 4.
    Hydrographic survey Ocean, 4,hafez ahmad,hydrography note-4 9. Aerotriangulation (Aerial triangulation) In the conduct of a photogrammetric survey, the co-ordinate determination of the ground control points is generally the phase which requires the greatest employment of time, at least 5 point for every model, which is for every pair. To reduce the number required, the co ordinates of some can be also obtained through photogrammetric methods, through aerial triangulation. 10. Inter-visibility of Geodetic Stations Vertical control methods 1. Geometric levelling (Spirit levelling method) Levelling are operations which allow the measurement of difference orthometric heights (or Geoid elevations) between points or their difference in elevation. The principle of the geometric levelling is: consider two points (A and B) to be a brief distance apart, not more than around 100 meters. 2. Trigonometric levelling (Trigonometrically heighting) Trigonometric levelling is based on the use of a theodolite for the measurement of zenithal angles. It is employed for any distances, from a few meters to over 10 kms; it is often used for the determination of the elevations of positions in triangulation, it is also applied in other cases, such as when the distance between the points, for which the difference of elevation is required, is already known. 3. Altimetry with GPS (GNSS Vertical Control Method) GPS (exploiting the relative positioning) generates the base-line components between the surveyed positions, from which the XYZ geocentric co-ordinates are obtained in the WGS84 reference system. The ϕ, λ & h ellipsoidal co-ordinates are obtained with transformation formulae.
  • 5.
    Hydrographic survey Ocean, 5,hafez ahmad,hydrography note-4 Theodolite The theodolite is an instrument which measures azimuth angles, via a graduated horizontal circle, and zenithal angles, via a graduated vertical circle. Precision of theodolites in the measurement of angles varies from 0.1" to 10"; the tacheometris are differentiated from theodolites due to their lower obtainable precisions, from 10" to 10', in angular measurements. In a theodolite three axes can be identified: a. the primary axis, around which the alidade rotates b. the secondary axis, around which the telescope rotates; c. the axis of collimation of the telescope. The principal parts of a theodolite are: a. the base (or tribrach), provided with a pedestal and three adjusting screws (levelling screws) on the basal plate which is the lowest part of the theodolite connected to the head of the tripod (or stand and legs), so as to be able, within certain limits, to centre the instrument over the reference mark. The lower spirit level or circular level (also termed universal level or bull’s eye level) and the optic lead are anchored to it. b. the alidade is a generally U-shaped frame, which can rotate around the vertical axis passing through the center of the instrument (primary axis) and contains the engraved horizontal circle reading index. An upper spirit level (termed spirit bubble or sensitive bubble) is anchored to it to make the primary axis vertical and to set the origin of the zenith angles to the zenith, residual errors excepted. c. the graduated horizontal circle, situated above the pedestal and under the alidade. d. the telescope, hinged to the alidade so that its axis of collimation is perpendicular to its axis of rotation. The telescope has a magnification from 28 to 45 times, thus increasing the precision of the measurements. e. the vertical circle, rigidly connected to the telescope, for reading of the zenithal angles The theodolite can be of two types, depending on the system of lock used for the horizontal circle: repeating and reiterating GPS The system is divided into: a. The spatial segment: is formed by 24 satellites in near circular orbit around the Earth at a height of about 20,200 kms. The satellites are distributed in groups of 4 about 6 circular orbits tilted 55° to the equatorial plane with a revolution period of about 12 hours. This constellation distribution ensures the visibility of at least 4 satellites (often 6 to 8) at all times and places with an elevation above 15° degrees from the horizon, which is fundamental for the positioning. The satellites have the followings functions: • To transmit information to users through a radio signal;
  • 6.
    Hydrographic survey Ocean, 6,hafez ahmad,hydrography note-4 • To maintain an accurate reference time due to the high degree of accuracy (from 10-12 to 10-14 sec) of the caesium and rubidium atomic clocks on board; • To receive and to store information from the control segment; • To make corrections to orbits. The satellites have been launched in different epochs, starting in 1978, in blocks which replaced earlier models with more advance ones. b. Control segment: comprises 5 monitoring stations and an additional sixth at Sunnyvale, USA, where a copy of all the selected data and all the attached operations are preserved. Among the five stations, all of which are provided with meteorological stations for the evaluation of the troposphere affects on the radio signals sent by satellites, three stations (Ascension, Diego Garcia and Kwajalein) have the ability to send messages to the satellites and one (Colorado Springs, USA) is the Master station, where the necessary calculations for the determination of the new orbits are performed. In summary the tasks of the control segment are: • To continuously track the satellites and to process the received data for the calculation of the timing-space position (Ephemeris); • To check the general state of the system, in particular the satellite clocks; • To implement orbit corrections; • To upload new data to the satellites, including the forecast Ephemeris for the next 12 or 24 hours, which are then transmitted to users. c. The user segment: is made up of users equipped with receivers with GPS antennas. These are passive systems in that they are able to acquire data without emitting some signal. Various types of receivers exist depending on the strategy used to analyze the received signal and the required positional accuracy. d. The signal structure: Every satellite continually emits electromagnetic waves on carefully chosen frequencies to a very small sector on the earth’s surface and is thus relatively sheltered from interference. These carrier waves transport the information to the user through code modulation. The onboard clocks produce a primary frequency f0 = 10.23 MHz; from this primary frequency the three fundamental parts of the GPS signal are precisely originated. 1. A topographic map of the ocean floor, or the bed of a lake. 2. Generally, bathymetric maps show depths by contour lines and gradient tints. Bathymetric charts are designed to present accurate, measurable description and visual presentation of the submerged terrain.
  • 7.
    Hydrographic survey Ocean, 7,hafez ahmad,hydrography note-4 1. A chart specifically designed to meet the requirements of marine navigation, showing depth of water, nature of bottom, elevations, configuration and characteristics of coasts, dangers and aids to navigation. 2 Safety navigation is the primary issue. 3 Used by mariners 4 It is a map that depicts the configuration of the shoreline and seafloor. Waypoints are sets of coordinates that identify a point in physical space. Coordinates used can vary depending on the application. For terrestrial navigation these coordinates can include longitude and latitude. Air navigation also includes altitude. Waypoints have only become widespread for navigational use by the layman since the development of advanced navigational systems, such as the Global Positioning System (GPS) and certain other types of radio navigation. Waypoints located on the surface of the Earth are usually defined in two dimensions (e.g., longitude and latitude) Acoustic methods 1: Single beam echo sounders These echo sounders are devices for depth determination by measuring the time interval between the emission of a sonic or ultrasonic pulse and the return of its echo from the seabed. Traditionally, the main purpose of the echo sounder is to produce a consistent and high resolution vertical seabed profile on echo trace. The echo trace, after a cautious interpretation, is sampled and digitized manually to produce soundings. During the last decade, the technology applied in SBES has progressively improved with automatic digitisers, recorders without moving parts and annotation of positions on the echo trace. Recently, built-in computers and signal processors have allowed more sophisticated real time signal processing and data presentation on graphical color displays, rather than a paper recorder. 2: Multibeam systems MBES are a valuable tool for depth determination when full seafloor coverage is required. These systems may allow complete seafloor ensonification with the consequent increase in resolution and detection capability. Principles of operation. Multibeam principle of operation is, in general, based on a fan shaped transmission pulse directed towards the seafloor and, after the reflection of the acoustic energy by the seabed; several beams are electronically formed, using signal processing techniques, with known beam angles. Hydrographic surveying deals with the configuration of the bottom and adjacent land areas of oceans, lakes, rivers, harbours, and other water forms on Earth. In strict sense, it is defined merely as the surveying of a water area; however, in modern usage it may include a wide variety of other objectives such as measurements of tides, current, gravity, earth magnetism, and determinations of the physical and chemical properties of water. The principal objective of most hydrographic surveys, is to obtain basic data for the compilation of nautical charts with emphasis on the features
  • 8.
    Hydrographic survey Ocean, 8,hafez ahmad,hydrography note-4 that may affect safe navigation. Other objectives include acquiring the information necessary for related marine navigational products and for coastal zone management, engineering, and science. The purpose of hydrographic surveying is: • To collect, with systematic surveys at sea, along the coast and inland, georeferenced data related to: ♦ Shoreline configuration, including man made infrastructure for maritime navigation i.e. all those features on shore that are of interest to mariners. ♦ Depths in the area of interest (including all potential hazards to navigation and other marine activities). ♦ Sea bottom composition. ♦ Tides and Currents. ♦ Physical properties of the water column. • To process the information collected in order to create organized databases capable of feeding the production of thematic maps, nautical charts and other types of documentation for the following most common uses : ♦ Maritime navigation and traffic management. ♦ Naval operations. ♦ Coastal zone management. ♦ Marine environment preservation. ♦ Exploitation of marine resources and laying of submarine cables/pipelines. ♦ Maritime boundaries definition (Law of the Sea implementation). ♦ Scientific studies. Survey Specifications Requirements for hydrographic surveys arise as the result of policy decisions, product user reports or requests, national defence needs, and other demands. The inception of a specific hydrographic survey project follows an evaluation of all known requirements and the establishment of priorities. Among the many objective and subjective factors that influence the establishment of priorities are national and agency goal, quantitative and qualitative measures of shipping and boating, the adequacy of existing surveys, and the rate of change of the submarine topography in the area Survey Planning Survey planning covers a wide range of activities from the development of an idea for a survey within the
  • 9.
    Hydrographic survey Ocean, 9,hafez ahmad,hydrography note-4 Hydrographic Office and its subsequent issue as Project Instructions / Hydrographic Instructions (HIs), to the detailed planning and organization of a surveying ship to fulfil a practical task. It covers inter departmental liaison at Government level, diplomatic cooperation and the allocation of numerous expensive resources. It also covers prioritization of resources and day to day running of a survey ship employed on surveying task. Survey planning involves blending of these activities into a coherent pattern aimed at the achievement of a specific task. A survey begins long before actual data collection starts. Some elements, which must be decided, are7: • Exact area of the survey. • Type of survey (reconnaissance or standard) and scale to meet standards of chart to be produced. • Scope of the survey (short or long term). • Platforms available (ships, launches, aircraft, leased vessels, cooperative agreements). • Support work required (aerial or satellite photography, geodetics, tides). • Limiting factors (budget, political or operational constraints, positioning systems limitations, logistics). Once these issues are decided, all information available in the survey area is reviewed. This includes aerial photography, satellite data, topographic maps, existing nautical charts, geodetic information, tidal information, and anything else affecting the survey. HO will normally undertake this strategic planning of surveys in cooperation with other organizations and, from this, Projects Instructions / Hydrographic Instructions (HIs) will be compiled by the Hydrographer and issued for compliance. Details provided in Project Instructions / HIs will include some or all of the following, depending on the type of survey required8: • Survey limits. • Data requirement and resolution. • Method of positional control, together with the accuracy expected. • Use to be made of sonar. • How the survey report is to be rendered and target date if appropriate. • A general, and at times detailed, description of the reason for the survey priorities, methods to be employed, particular observations to be made and other relevant guidance or instruction. Development of a general survey plan and subsequent site specific survey plans will create a more efficient survey. The general survey plan addresses the way that surveys are planned, performed, and processed. This plan must be well thought out and robust to account for as many contingencies as possible. This plan includes training, software, equipment maintenance and upgrades, logistics, all data requirements, schedule, safety, and weather. The site specific survey plan will address local notifications, survey lines, datum, data density, and specific equipment and personnel that will meet the general survey plan requirements. Few are described below: • Training of surveyors should be catered during a survey operation in order to ensure appropriate competencies are maintained.
  • 10.
    Hydrographic survey Ocean, 10,hafez ahmad,hydrography note-4 • Data logging and processing software are critical in a survey operation. These should be user friendly and personnel employed on these need to be well conversant with its all functions. • Suitable survey platform and equipment should be selected. Some equipment will lend itself to particular types of surveys and others will be more general in use. It is paramount that a proper selection is made. • The purpose for the survey will usually dictate the data requirement (density, coverage, and precision). However, if there are no impact to cost and schedule, then as many requirements should be addressed as possible. • Schedule is often a critical element in a hydrographic survey. The data requirement usually has as a specific deliverable date assigned, such that the survey data collection and processing occur within a very specific time frame. This requires that the personnel and equipment resources be adequate to meet this need. In some cases, if the schedule cannot be met, then the survey simply will not be requested and other sources will be used. Considering this, it is important to plan and analyze all aspects of a general survey plan with the ability to meet schedule as a prime element. Safety is the primary consideration. It is incumbent on the person in charge in the field to evaluate every situation for possible hazards. If there is an identified hazard, then it needs to be addressed before continuing with the activity. 4. Notifications to the local authorities / harbor master office should be made with enough time to allow them to notify the local mariners. • Survey lines for multibeam surveys should follow the contours of the harbour bottom. This will reduce the changes in bottom coverage created by different water depths. However, when using a single beam survey system, the lines should run perpendicular to contours. This will help in determining changes in the bottom relief. Multibeam survey lines also need to be spaced so as to achieve the proper amount of overlap or data density to meet the survey standard. • An integral part of the data of a survey is the reference datum. It is required, by good survey practice, to clearly indicate by note on the published survey the actual vertical and horizontal reference used, and the procedures used to establish the datum for the survey. WGS-84 is being used worldwide. • Data density will vary based on method of survey, water depth, and need. The method of survey will be determined by equipment available for the survey, the personnel, and survey site conditions. If only a single beam survey system is available, then data density will be less. With a multibeam system, the greater the water depth the less dense the data will be, unless multiple passes are made. The type of survey will dictate the data redundancy or data overlap requirements. • It is important to standardize the equipment as much as possible to limit training, maintenance and overheads. 1: Data Gathering
  • 11.
    Hydrographic survey Ocean, 11,hafez ahmad,hydrography note-4 Data gathering is dependent upon various factors. The survey requirements, the platform and equipment available and the time specified for a particular task will determine the amount of data to be collected. A large amount of data can be collected using latest hydrographic software’s and tools like multibeam echo sounders. In particular, the purpose of the survey will usually dictate the data requirement (data density, data coverage, and data precision). However, if there is no impact to cost and schedule, then as many data may be collected as possible during field survey. The data collection be made in methodical manner starting from one side of the area ending on other. It should be noted that data redundancy and data density are not the same thing. Data density is the number of soundings per unit of area, while data redundancy refers to data overlap or data collected at a different time at the same location. The type of survey defines data redundancy or data overlap requirements. Full coverage surveys deal more with data density insuring that all bottom features/obstructions have been located. These need to be clearly understood by those requesting the survey and those doing the survey to insure compliance with the standards specified by IHO. 2:Data Processing Data processing must be done under strict quality control criteria. Hydrographic data is either collected by automated systems or converted into an automated format. Final data processing and plotting are accomplished using onboard or office-based computer systems. A standard approach for a hydrographic survey is the collect-process-collect methodology9. The data collected is processed and subsequently gaps and areas with questionable data re-surveyed. Most of the hydrographic systems are capable of performing “field-finish” operations, wherein survey data is collected, processed, plotted and analyzed in the field. Comprehensive survey planning is required for an integrated approach that generates the base line for all real-time and post processing operation with the system. 3: Data Analysis The accuracy of the results of survey measurement should always be quoted to show how good or reliable they are. Since no equipment is entirely free of errors, therefore, errors are introduced in all observations. In addition, errors are introduced in computations by approximations in formulae or by rounding. Observational techniques are designed to eliminate all but small random errors, which can then be analyzed by rigorous techniques to quantify the accuracy of the observations. 4: Data Quality Quality is about “fitness for the use”. It has to do with the extent to which a data set, or map output satisfied the needs of the person judging it. Error is the difference between actual and true data. Error is a major issue in quality. It is often used as an umbrella term to describe all the types of the effects that cause data to depart from what they should be12. To allow a comprehensive assessment of the quality of survey data, it is necessary to record or document certain information together with the survey data. Such information is important to allow exploitation of survey data by a variety of users with different requirements, especially as requirements may not be known when survey data is collected. The process of documenting the data quality is called data attribution; the information on the data quality is called metadata. Metadata should comprise at least information on: • The survey in general as e.g. date, area, equipment used, name of survey platform.
  • 12.
    Hydrographic survey Ocean, 12,hafez ahmad,hydrography note-4 • The geodetic reference system used, i.e. horizontal and vertical datum; including ties to WGS 84 if a local datum is used. • Calibration procedures and results. • Sound velocity. • Tidal datum and reduction. • Accuracies achieved and the respective confidence levels. Metadata should preferably be in digital form and an integral part of the survey record. If this is not feasible similar information should be included in the documentation of a survey. Data quality can be achieved by effective quality control either by automatic or manual means. • Automatic (Non-interactive) Quality Control: In this, the coordinates (i.e. positions and depths) obtained should be controlled automatically by a programme using suitable statistical algorithms which have been documented, tested and demonstrated to produce repeatable and accurate results. • Manual (Interactive) Quality Control: In this, the use of 3-D visualization tools is strongly recommended. These tools should allow viewing the data using a zoom facility. The interactive processing system should also offer different display modes for visualization, e.g. depth plot, error plot, single profile, single beam, backscatter imagery etc. and should allow for the visualization of the survey data in conjunction with other useful information as e.g. shoreline, wrecks, aids to navigation etc. editing of data should be possible in all modes and include an audit trail. If feasible, data displays should be geo-referenced. The flags set during the automatic stage, which correspond to depths shallower than the surrounding area, should require explicit operator action, at least, for Special Order and Order 1 surveys. If the operator overrules flags set during the automatic stage, this should be documented. If a flag is set by the operator, the type of flag used should indicate this. Zone of confidence The ZOC concept was developed by the IHO to provide a mean of classifying bathymetric data. ZOC provide a simple and logical mean of displaying to the mariner the confidence that the national charting authority places on any particular selection of bathymetric data. It seeks to classify areas for navigation by identifying the various levels of confidence that can be placed in the underlying data using a combination of the following criteria: * Depth and position accuracy, * Thoroughness of seafloor search, and * Conformance to an approved quality plan. Under this concept six ZOCs were developed and subsequently approved for inclusion as a part of IHO S- 57. ZOCs A1, A2, and B are generated from modern and future surveys with, critically, ZOCs A1 and A2 requiring a full area search. ZOCs C and D reflect low accuracy and poor quality data whilst ZOC U represents data which is un-assessed at the time of publication. ZOCs are
  • 13.
    Hydrographic survey Ocean, 13,hafez ahmad,hydrography note-4 designed to be depicted on paper charts, as an insert diagram in place of the current reliability diagram, and on electronic displays. It must be emphasized that ZOCs are a charting standard and are not intended to be used for specifying standards for hydrographic surveys or for the management of data quality. The depth and position accuracy specified for each ZOC refer to the errors of the final depicted soundings and include not only survey errors but also any other errors introduced in the chart production process.