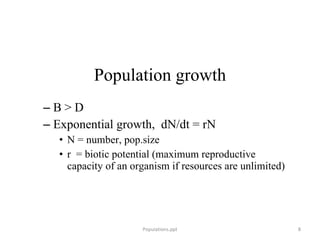
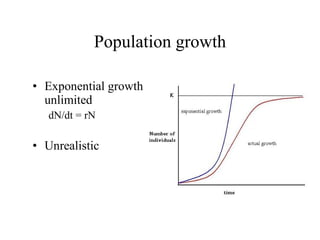
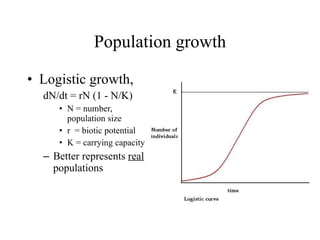
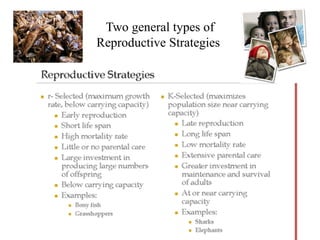
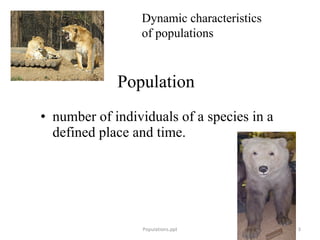
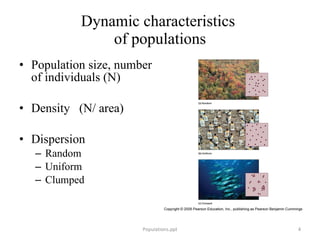
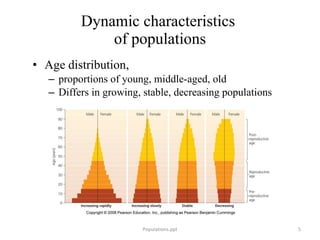
Population Dynamics Populations.ppt
Vocabulary Population Biotic Potential Carrying Capacity r-Selection K-Selection Survivorship Curve Populations.ppt
Population   number of individuals of a species in a defined place and time. Populations.ppt Dynamic characteristics  of populations
Dynamic characteristics  of populations Population size, number of individuals (N) Density  (N/ area) Dispersion Random Uniform Clumped Populations.ppt
Dynamic characteristics  of populations Age distribution, proportions of young, middle-aged, old Differs in growing, stable, decreasing populations Populations.ppt
Changes in populations Growth  Expansion of species’ populations may lead to evolution of new species Decline Shrinking species’ populations may lead to extinction Small populations Narrowly specialized species Populations.ppt
Changes in populations Δ N = +B +I –D –E +B = births  (birth rate) +I  = immigrants  (immigration rate) –  D = deaths  (death rate) –  E = emigrants  (emigration rate) (For many [most] natural populations I and E are minimal.) Populations.ppt
Population growth B > D Exponential growth,  dN/dt = rN N = number, pop.size r  = biotic potential (maximum reproductive capacity of an organism if resources are unlimited) Populations.ppt
Population growth Exponential growth unlimited dN/dt = rN  Unrealistic
Carrying Capacity The population size that the environment can sustain for a long period of time. Determined by Renewable resources (water, light, etc) Nonrenewable resources (land)
Population growth Logistic growth,  dN/dt = rN (1 - N/K) N = number,  population size r  = biotic potential K = carrying capacity Better represents  real  populations
Population growth Logistic growth,  dN/dt = rN (1 - N/K) N = number,  population size r  = biotic potential, “intrinsic rate of increase.” K = carrying capacity Better represents  real  populations
Logistic model Logistic model works, to a point. Real organisms have time lags for growth, time to develop eggs, flowers, etc. Real populations may exceed carrying capacity. Kaibab Deer Populations.ppt
Various species have various strategies for coping with a variable world. Populations.ppt
Two general types of Reproductive Strategies
 
Survivorship Curves • Plots surviving individuals at different age groups r-strategists have Type III K-strategists have Type I Populations.ppt
Survivorship Curves Populations.ppt Type I survivorship curves are characterized by high survival in early and middle life, followed a rapid decline in survivorship in later life. Humans are one  species that show this pattern of survivorship. Type II curves are an intermediate between Type I and III, where roughly constant mortality rate is experienced regardless of age. Some birds follow this pattern of survival. In Type III curves, the greatest mortality is experienced early on in life, with relatively low rates of death for those surviving this bottleneck. This type of curve is characteristic of species that produce a large number of offspring. One example of a species that follows this type of survivorship curve is the cockroach.

Population dynamics

  • 1.
  • 2.
    Vocabulary Population BioticPotential Carrying Capacity r-Selection K-Selection Survivorship Curve Populations.ppt
  • 3.
    Population number of individuals of a species in a defined place and time. Populations.ppt Dynamic characteristics of populations
  • 4.
    Dynamic characteristics of populations Population size, number of individuals (N) Density (N/ area) Dispersion Random Uniform Clumped Populations.ppt
  • 5.
    Dynamic characteristics of populations Age distribution, proportions of young, middle-aged, old Differs in growing, stable, decreasing populations Populations.ppt
  • 6.
    Changes in populationsGrowth Expansion of species’ populations may lead to evolution of new species Decline Shrinking species’ populations may lead to extinction Small populations Narrowly specialized species Populations.ppt
  • 7.
    Changes in populationsΔ N = +B +I –D –E +B = births (birth rate) +I = immigrants (immigration rate) – D = deaths (death rate) – E = emigrants (emigration rate) (For many [most] natural populations I and E are minimal.) Populations.ppt
  • 8.
    Population growth B> D Exponential growth, dN/dt = rN N = number, pop.size r = biotic potential (maximum reproductive capacity of an organism if resources are unlimited) Populations.ppt
  • 9.
    Population growth Exponentialgrowth unlimited dN/dt = rN Unrealistic
  • 10.
    Carrying Capacity Thepopulation size that the environment can sustain for a long period of time. Determined by Renewable resources (water, light, etc) Nonrenewable resources (land)
  • 11.
    Population growth Logisticgrowth, dN/dt = rN (1 - N/K) N = number, population size r = biotic potential K = carrying capacity Better represents real populations
  • 12.
    Population growth Logisticgrowth, dN/dt = rN (1 - N/K) N = number, population size r = biotic potential, “intrinsic rate of increase.” K = carrying capacity Better represents real populations
  • 13.
    Logistic model Logisticmodel works, to a point. Real organisms have time lags for growth, time to develop eggs, flowers, etc. Real populations may exceed carrying capacity. Kaibab Deer Populations.ppt
  • 14.
    Various species havevarious strategies for coping with a variable world. Populations.ppt
  • 15.
    Two general typesof Reproductive Strategies
  • 16.
  • 17.
    Survivorship Curves •Plots surviving individuals at different age groups r-strategists have Type III K-strategists have Type I Populations.ppt
  • 18.
    Survivorship Curves Populations.pptType I survivorship curves are characterized by high survival in early and middle life, followed a rapid decline in survivorship in later life. Humans are one species that show this pattern of survivorship. Type II curves are an intermediate between Type I and III, where roughly constant mortality rate is experienced regardless of age. Some birds follow this pattern of survival. In Type III curves, the greatest mortality is experienced early on in life, with relatively low rates of death for those surviving this bottleneck. This type of curve is characteristic of species that produce a large number of offspring. One example of a species that follows this type of survivorship curve is the cockroach.

Editor's Notes

  • #4 A species is often defined as a group of organisms capable of interbreeding and producing fertile offspring
  • #6 Compare birth rate to death rate
  • #9 dN/dt = change in number of individuals per unit time
  • #10 dN/dt = change in number of individuals per unit time
  • #12 dN/dt = change in number of individuals per unit time
  • #14 Kaibob deer – in AZ, kill predators to protect deer, but then grew rapidly, until ate resources and began to starve.