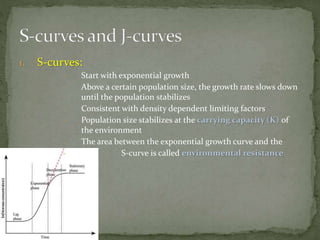
J. Voytilla
 Populations can change over time due to many
factors/variables
 These limiting factors may be classified as
1. Density dependent factors
2. Density independent factors
 Density Dependent:
- In general these are biotic
- Their effects increase as population size increases
- Act as negative feedback mechanisms which function to
regulate or stabilize a population size
- Can be further divided into INTERNAL and EXTERNAL
FACTORS
1. Internal Factors
- Act within a species
- E.g. Limited food supply, territory, density dependent
fertility
2. External Factors
- Act between different species
- E.g. Predation and disease
 Density Independent:
- In general tend to be abiotic
- Effects are not related to population density
- E.g. Weather, climate, volcanic eruptions, floods.
- Not part of a feedback system
These two types of limiting factors give rise to two
different growth patterns...........
1. S-curves:
- Start with exponential growth
- Above a certain population size, the growth rate slows down
until the population stabilizes
- Consistent with density dependent limiting factors
- Population size stabilizes at the carrying capacity (K) of
the environment
- The area between the exponential growth curve and the
- S-curve is called environmental resistance
2. J-curves:
- Show a boom and bust pattern
- Population grows exponentially then crashes
- These collapses/crashes are called diebacks
- Population often exceeds K before the collapse occurs which
is referred to as overshoot
- Typical of microbes, invertebrates, fish, and small mammals
 S- and J-curves are idealized
 In nature both types of limiting factors act on the same
population and the result is an S/J combo curve
 The growth rate of the human population is slowing as we
reach the K of our environment.
 The growth rate peaked at 2.1% per annum in 1965-70
 It is now about 1.3% and falling, but more in some regions
than others
 Back in the day world population was increasing slowly due
to environmental resistance, diseases, epidemics, famine,
and natural catastrophes.
 What changed????
 Current Population:
http://math.berkeley.edu/~galen/popclk.html
 Global Village links:
http://www.gnostic.org/eupho/iftheworld.htm
http://www.100people.org/statistics_100stats.php?section=st
atistics
https://www.youtube.com/watch?v=FtYjUv2x65g
http://www.nationsonline.org/oneworld/global-village.htm
Are there too many humans alive on the planet?
Have we exceeded K of the Earth?
Are we heading for a population crash?
 Think about what happens as families start to
congregate around the same spring or river...
 Adopted by the UN Development Programme as a
measure of the “well-being” of a country.
 Combines measurements of life expectancy, standards
of living, education, and GDP per capita into one
value.
 Used to rank countries
 http://www.nationmaster.com/graph/eco_hum_dev_i
nd-economy-human-development-index
 http://hdr.undp.org/en/statistics/
 Countries are also economically classified based on industrial
development and GDP.
 MEDCs are industrialized nations with high GDPs
- Relatively rich population and starvation is unlikely
- High level of resource use per capita
- Relatively low population growth rates
 LEDCs are less industrialized or have none at all
- May have plenty of natural capital but usually this is exported
and processed in MEDCs
- Lower GDP and high poverty rates
- Large population sector with low standard of living
- High population growth rates
 The 4 main factors that affect population size are:
1. Birth rate
2. Death Rate
3. Immigration
4. Emigration
The measures of population change are
1. Crude birth rate
2. Crude death rate
3. Doubling rate
4. Natural Increase rate
1. Crude Birth Rate (CBR)
- The number of births per 1000 individuals in a
population per year.
- Calculated by dividing the number of births by the
population size and multiplying by 1000
- Write this out as a formula.
The CBR for the world is about 20.3 per 1000 per year
2. Crude Death Rate (CDR)
- The number of deaths per 1000 individuals in a
population per year.
- Calculated by dividing the number of deaths by the
population size and multiplying by 1000
- Write this out as a formula
The CDR of the world is about 9.6 per 1000 per year
3. Natural Increase Rate (NIR)
NIR = (CBR – CDR) / 10
This gives the NIR as a %
Does not consider immigration/emigration
4. Doubling Time
- The time in years that it takes a population to double its
size
Doubling Time = 70 / NIR
E.g. If NIR = 2%, then how long will it take the population
to double in size?
Region Pop
106
Area
km2
x 106
Births
106
Deaths
106
CBR CDR NIR Pop
Density
World 6000 131 121.0 55.8
Asia 3500 31 88.2 29.4
India 1000 3 29.0 10.0
Africa 730 29 30.7 10.0
Tanzania 30 0.9 1.3 0.4
Europe 730 22.7 8.5 8.2
Switzerland 7 0.04 0.09 0.07
N. America 460 21.8 9.3 3.6
USA 270 9.6 4.3 2.4
 Population Growth can be defined in terms of birth rate, death
rate, doubling time, migration, and fertility rate
 Total Fertility Rate (TFR): the average number of children that
each woman has over her lifetime. It shows the potential for
population change in a country
- A TFR > 2.0 results in a population increase
- A TFR < 2.0 results in a population decrease
- A TFR = 2.0 results in a stable population.
 Fertility Rate differs from Birth Rate in that Birth Rate is a % of
the population, not of each woman.
 TFR’s are generally lower in MEDC’s than in LEDC’s
 Population size is not the only factor that determines our
species’ impact on the environment
i.e. Resource use and pollution
- Amount of wealth, including its distribution
- Resource desire
- Resource need
Many environmental impact models are based on the assumption
that all individuals in a population have the same resource use
and waste profile and thus impact the environment equally.
Why is this assumption incorrect?
Can you identify some groups within your population with different
resource use and waste profiles?
Malthusian Theory versus Boserup’s Theory
 Thomas Malthus was an English clergyman and economist who lived
back in the day (1766-1834). He wrote of a theory of competition for
resources that influenced Charles Darwin and many others.
 Ester Boserup was a Danish economist and writer (1905-1999) who
worked for many organizations, including the UN. She wrote about
population growth and agricultural development from a technocentric
perspective.
 In pairs, research their respective theories.
- Outline each theory in point form as it pertains to population growth
- Identify the limitations and assumptions of each theory
- We will discuss this together as a group.
 3 billion women will decided the fate of our population.
 If the fertility rate is 2.0, the population will stabilize a bit
and rise to 10.8 billion by 2050.
 If every second woman has 3 instead of 2 children (TFR =
2.5) the population will rise to 27 billion by 2150. However if instead every
second woman has just 1 child (TFR = 1.5), then the population will drop to
3.6 billion
 Currently TFR is about 3.0
- 1.7 in MEDC’s
- 3.0 in LEDC’s (sometimes as high as 6!)
 Check out Hans Rosling’s TED Talk on population growth:
https://www.ted.com/talks/hans_rosling_on_global_population_growth
 Does not seem to be correlated with GNP nor personal
wealth. Some reasons could be:
1. High mortality rates for infants and youth
2. Security in old age
3. Children are an economic asset in agricultural societies
4. Status of women. In many countries women are considered
worthy only for making children and their social status depends on
the number, especially boys. Education has allowed women to gain
status outside of the context of mere baby factories and has
contributed toward low fertility rates of MEDC’s.
5. Unavailability of contraception
 Think of at least 5 ways to reduce family size that work
to fix the problems rather than impose legislation
PopulationPyramids
Also called Age-Sex pyramids
Show how many individuals
are alive in different age
groups (called cohorts) in a
country or region for any
given year.
They also show the male-
female ratio
Population numbers are on
the x-axis and age groups are
on the y-axis
Typesof Pyramid Shapes
Stage 1. Expanding – High CBR, rapid fall
in each upward age group due to high
CDR, short life expectancy.
Stage 2. Expanding – High CBR, fall in
CDR as more individuals live to middle
age, slightly longer life expectancy.
Stage 3. Stationary – declining CBR, low
CDR, more individuals live to old age.
Stage 4. Contracting - low CBR, low
CDR, higher dependency ratio (those
that cannot work), longer life expectancy.
LEDC’s tend to be stage 1 or 2
MEDC’s tend to be stage 3 or 4
 Let’s look at some examples:
http://populationpyramid.net/
1. Find at least 5 pieces of information about the
population that we selected.
2. What changes to the population are evident in the
predicted pyramid for 2025?
 DTM describes the pattern of decline in mortality and
natality (fertility) of a country due to social and economic
development.
 Can be described as a 5-stage model
1. Pre-industrial
2. LEDC
3. Wealthier LEDC
4. MEDC - stable
5. MEDC – population decline
Check out Richard Allaway’s video:
http://www.youtube.com/watch?v=0dK3mL35nkk
3.1 Human population dynamics

3.1 Human population dynamics

  • 1.
  • 2.
     Populations canchange over time due to many factors/variables  These limiting factors may be classified as 1. Density dependent factors 2. Density independent factors
  • 3.
     Density Dependent: -In general these are biotic - Their effects increase as population size increases - Act as negative feedback mechanisms which function to regulate or stabilize a population size - Can be further divided into INTERNAL and EXTERNAL FACTORS
  • 4.
    1. Internal Factors -Act within a species - E.g. Limited food supply, territory, density dependent fertility 2. External Factors - Act between different species - E.g. Predation and disease
  • 5.
     Density Independent: -In general tend to be abiotic - Effects are not related to population density - E.g. Weather, climate, volcanic eruptions, floods. - Not part of a feedback system These two types of limiting factors give rise to two different growth patterns...........
  • 6.
    1. S-curves: - Startwith exponential growth - Above a certain population size, the growth rate slows down until the population stabilizes - Consistent with density dependent limiting factors - Population size stabilizes at the carrying capacity (K) of the environment - The area between the exponential growth curve and the - S-curve is called environmental resistance
  • 7.
    2. J-curves: - Showa boom and bust pattern - Population grows exponentially then crashes - These collapses/crashes are called diebacks - Population often exceeds K before the collapse occurs which is referred to as overshoot - Typical of microbes, invertebrates, fish, and small mammals
  • 8.
     S- andJ-curves are idealized  In nature both types of limiting factors act on the same population and the result is an S/J combo curve  The growth rate of the human population is slowing as we reach the K of our environment.  The growth rate peaked at 2.1% per annum in 1965-70  It is now about 1.3% and falling, but more in some regions than others  Back in the day world population was increasing slowly due to environmental resistance, diseases, epidemics, famine, and natural catastrophes.  What changed????
  • 9.
     Current Population: http://math.berkeley.edu/~galen/popclk.html Global Village links: http://www.gnostic.org/eupho/iftheworld.htm http://www.100people.org/statistics_100stats.php?section=st atistics https://www.youtube.com/watch?v=FtYjUv2x65g http://www.nationsonline.org/oneworld/global-village.htm
  • 10.
    Are there toomany humans alive on the planet? Have we exceeded K of the Earth? Are we heading for a population crash?  Think about what happens as families start to congregate around the same spring or river...
  • 11.
     Adopted bythe UN Development Programme as a measure of the “well-being” of a country.  Combines measurements of life expectancy, standards of living, education, and GDP per capita into one value.  Used to rank countries  http://www.nationmaster.com/graph/eco_hum_dev_i nd-economy-human-development-index  http://hdr.undp.org/en/statistics/
  • 12.
     Countries arealso economically classified based on industrial development and GDP.  MEDCs are industrialized nations with high GDPs - Relatively rich population and starvation is unlikely - High level of resource use per capita - Relatively low population growth rates  LEDCs are less industrialized or have none at all - May have plenty of natural capital but usually this is exported and processed in MEDCs - Lower GDP and high poverty rates - Large population sector with low standard of living - High population growth rates
  • 13.
     The 4main factors that affect population size are: 1. Birth rate 2. Death Rate 3. Immigration 4. Emigration The measures of population change are 1. Crude birth rate 2. Crude death rate 3. Doubling rate 4. Natural Increase rate
  • 14.
    1. Crude BirthRate (CBR) - The number of births per 1000 individuals in a population per year. - Calculated by dividing the number of births by the population size and multiplying by 1000 - Write this out as a formula. The CBR for the world is about 20.3 per 1000 per year
  • 15.
    2. Crude DeathRate (CDR) - The number of deaths per 1000 individuals in a population per year. - Calculated by dividing the number of deaths by the population size and multiplying by 1000 - Write this out as a formula The CDR of the world is about 9.6 per 1000 per year
  • 16.
    3. Natural IncreaseRate (NIR) NIR = (CBR – CDR) / 10 This gives the NIR as a % Does not consider immigration/emigration 4. Doubling Time - The time in years that it takes a population to double its size Doubling Time = 70 / NIR E.g. If NIR = 2%, then how long will it take the population to double in size?
  • 17.
    Region Pop 106 Area km2 x 106 Births 106 Deaths 106 CBRCDR NIR Pop Density World 6000 131 121.0 55.8 Asia 3500 31 88.2 29.4 India 1000 3 29.0 10.0 Africa 730 29 30.7 10.0 Tanzania 30 0.9 1.3 0.4 Europe 730 22.7 8.5 8.2 Switzerland 7 0.04 0.09 0.07 N. America 460 21.8 9.3 3.6 USA 270 9.6 4.3 2.4
  • 18.
     Population Growthcan be defined in terms of birth rate, death rate, doubling time, migration, and fertility rate  Total Fertility Rate (TFR): the average number of children that each woman has over her lifetime. It shows the potential for population change in a country - A TFR > 2.0 results in a population increase - A TFR < 2.0 results in a population decrease - A TFR = 2.0 results in a stable population.  Fertility Rate differs from Birth Rate in that Birth Rate is a % of the population, not of each woman.  TFR’s are generally lower in MEDC’s than in LEDC’s
  • 19.
     Population sizeis not the only factor that determines our species’ impact on the environment i.e. Resource use and pollution - Amount of wealth, including its distribution - Resource desire - Resource need Many environmental impact models are based on the assumption that all individuals in a population have the same resource use and waste profile and thus impact the environment equally. Why is this assumption incorrect? Can you identify some groups within your population with different resource use and waste profiles?
  • 20.
    Malthusian Theory versusBoserup’s Theory  Thomas Malthus was an English clergyman and economist who lived back in the day (1766-1834). He wrote of a theory of competition for resources that influenced Charles Darwin and many others.  Ester Boserup was a Danish economist and writer (1905-1999) who worked for many organizations, including the UN. She wrote about population growth and agricultural development from a technocentric perspective.  In pairs, research their respective theories. - Outline each theory in point form as it pertains to population growth - Identify the limitations and assumptions of each theory - We will discuss this together as a group.
  • 21.
     3 billionwomen will decided the fate of our population.  If the fertility rate is 2.0, the population will stabilize a bit and rise to 10.8 billion by 2050.  If every second woman has 3 instead of 2 children (TFR = 2.5) the population will rise to 27 billion by 2150. However if instead every second woman has just 1 child (TFR = 1.5), then the population will drop to 3.6 billion  Currently TFR is about 3.0 - 1.7 in MEDC’s - 3.0 in LEDC’s (sometimes as high as 6!)  Check out Hans Rosling’s TED Talk on population growth: https://www.ted.com/talks/hans_rosling_on_global_population_growth
  • 22.
     Does notseem to be correlated with GNP nor personal wealth. Some reasons could be: 1. High mortality rates for infants and youth 2. Security in old age 3. Children are an economic asset in agricultural societies 4. Status of women. In many countries women are considered worthy only for making children and their social status depends on the number, especially boys. Education has allowed women to gain status outside of the context of mere baby factories and has contributed toward low fertility rates of MEDC’s. 5. Unavailability of contraception
  • 23.
     Think ofat least 5 ways to reduce family size that work to fix the problems rather than impose legislation
  • 24.
    PopulationPyramids Also called Age-Sexpyramids Show how many individuals are alive in different age groups (called cohorts) in a country or region for any given year. They also show the male- female ratio Population numbers are on the x-axis and age groups are on the y-axis
  • 25.
    Typesof Pyramid Shapes Stage1. Expanding – High CBR, rapid fall in each upward age group due to high CDR, short life expectancy. Stage 2. Expanding – High CBR, fall in CDR as more individuals live to middle age, slightly longer life expectancy. Stage 3. Stationary – declining CBR, low CDR, more individuals live to old age. Stage 4. Contracting - low CBR, low CDR, higher dependency ratio (those that cannot work), longer life expectancy. LEDC’s tend to be stage 1 or 2 MEDC’s tend to be stage 3 or 4
  • 26.
     Let’s lookat some examples: http://populationpyramid.net/ 1. Find at least 5 pieces of information about the population that we selected. 2. What changes to the population are evident in the predicted pyramid for 2025?
  • 27.
     DTM describesthe pattern of decline in mortality and natality (fertility) of a country due to social and economic development.  Can be described as a 5-stage model 1. Pre-industrial 2. LEDC 3. Wealthier LEDC 4. MEDC - stable 5. MEDC – population decline Check out Richard Allaway’s video: http://www.youtube.com/watch?v=0dK3mL35nkk

Editor's Notes

  • #24 1. education, 2. improve health, 3. provide contraception, 4. increase family income, 5. improve resource management