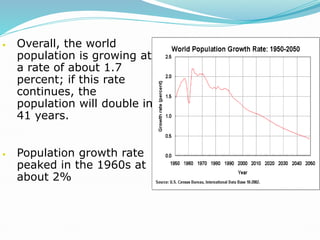
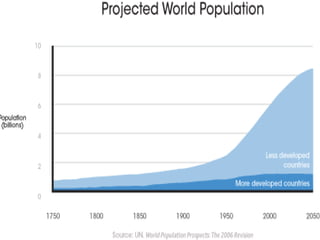
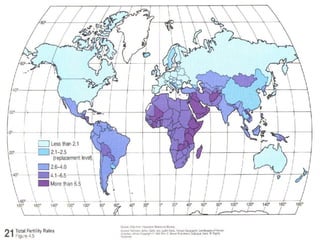
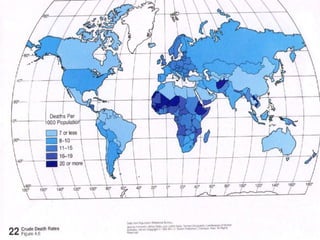
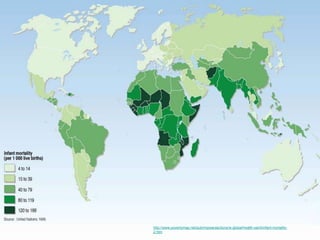
The Human Population
and its Impact
Chapter 6
and
Chapter 23-4
The Human
Population
Over Time
The time it takes our
population to double
has decreased
sharply.
It only has taken
about 12 years to go
from 6-7 billion
people.
We are projected to
hit 9 billion near the
year 2050.
Estimates say
stabilization around
2100. (10.5 billion)
Human Population Over Time
 What’s your number?
http://www.bbc.co.uk/news/world-15391515
Population Clock (census)
http://www.census.gov/popclock/
 Population growth video
https://www.youtube.com/watch?v=khFjdmp9sZk
3
Why our population has grown
so quickly….
 Humans have the ability to expand into all climate zones
and habitats
 Modern agriculture has allowed us to produce food very
efficiently and in large quantities
 Death rates decreased because of improved sanitation
and healthcare (biggest influence)
 The current global population growth rate is around 1.3%
per year (and slowing). Most of this growth happens in
developing countries.
 If growth rate is slowing…why is our population still growing?
• Overall, the world
population is growing at
a rate of about 1.7
percent; if this rate
continues, the
population will double in
41 years.
• Population growth rate
peaked in the 1960s at
about 2%
Carrying Capacity
 Under ideal conditions populations will grow exponentially until
limiting factors cause growth to slow.
 Carrying Capacity: maximum number of individuals an
ecosystem can support
 Determined by limiting factors
 Carrying capacity for humans on earth is highly debated.
 Innovation and technology
 Rules other populations follow don’t apply to us
 Cultural carrying capacity: the maximum number of people who
could live in reasonable freedom and comfort indefinitely
without decreasing the ability of the earth to sustain future
generations.
 What standard of living are we willing to accept?
Factors Affecting Growth
 When inputs into a system are larger than the outputs the
system will grow
 Births, Deaths, Immigration and Emigration
 Crude birth rate: births per 1000
 Crude death rate: deaths per 1000
 Fertility Rates
 Replacement level fertility (number to replace the parents)
 Average 2.1-2.5 (babies dying before reproductive years)
 Gauges changes in population size
 Total fertility (estimate of average number of children born to women)
 Lower in developed countries
 US about 2.1
 On average declining worldwide
 China 1.5 TFR (one child policy)
 What factors affect birth and fertility rates?
 Labor force
 Cost of raising and educating children
 Urbanization
 Infant deaths
 Education for women
 Marrying age
 Access to contraceptives
 What factors affect death rates?
 Access to nutrition, medical care, clean water
 Community support for elders
 Increased life expectancy
 Usually higher for women
 Decrease in infant mortality
Infant Mortality
 Good measure of a
nation’s quality of life
 Measured as number of
infant deaths per 1000
births
 World average is 46
 40 countries have a lower
IMR than the US. Why?
 Inadequate prenatal care,
drug addiction, teenage
pregnancies,
socioeconomic variances
http://www.povertymap.net/pub/mipwa/sections/w-global/health-sanit/infant-mortality-
2.htm
 Factors affecting Migration (immigration and emigration)
 Net Migration Rate: difference between immigration and
emigration per 1000 people in a given year (only effects
individual countries)
 Better jobs and economic improvement
 Religious, ethnic, or political conflicts
 Lack of access to basic needs (food, water, etc.)
 Environmental refugees
Exponential Growth
Calculations
 Calculating and Predicting Rates of Growth—The
Rule of 70
 With populations that are growing exponentially we can
use the rule of 70 to predict rates of growth and
population doubling times.
 **Assumes growth rate is constant. Estimate only.**
 Doubling time (dt) = 70/ % growth rate
 or
 % growth rate = 70/dt
Practice Problems
 If the starting population of 5 rabbits grows at 2%
each year, how long will it take the population to
double?
 If the doubling time for a population is 7 years what is
the growth rate over this time period?
Population Pyramids
 Graph (histogram) that allows us to see the population
growth within a country broken down by age groups and
gender
 horizontal axis: gender
 male: left-hand female: right-hand
 absolute number of people or %
 vertical axis: age
 5-year or 10-year age groups
 Ages categorized as…
 Pre-reproductive: ages 0-14
 Reproductive: ages 15-44
 Post-reproductive: ages 44+
Population Pyramids
 We classify our pyramids based on the shape they
take.
 Rapidly Growing: large amounts of people in the pre-
reproductive and reproductive years
 Very large bottom of the pyramid
 Growing Slowly: more individuals in the pre-
reproductive and reproductive years
 Bottom of pyramid is slightly larger than the rest
 Stable (zero population growth): population is evenly
distributed throughout age groups
 Pyramid is relatively even top to bottom
 Declining (negative growth): more individuals in the
post-reproductive age groups
 Bottom of pyramid is smaller than the top
Rapid Growth
Expanding Slowly
Stable—Zero Population Growth
Declining
The US Baby Boom.
Population Pyramids
 We also see differences based on economics. Is the
country developed or developing?
 Allows us to project future growth based on age
structure.
World Population Pyramid
 Using the data for the total population of the world
(from 2010), construct an age structure pyramid. We
will use this as a reference for other countries we
discuss.
 You will first need to convert the numbers into
percentages for both males and females.
 Divide the number in each category by the total
population.
 When finished with world pyramid, grab individual
country pyramid and answer comparison questions.
Demographic Transition
 Movement of a nation from high population growth to low
population as it develops economically (from subsistence
economy to affluence).
 Traced through graphs of a population change over time (birth
rates and death rates)
 Illustrates how countries will influence the environment as they
transition
 most countries will go through this transition in the next few
decades due to technological and economic development
 Transition as a result of five stages
 Stage 1—Birth and death rates are both high
 Stage 2—Death rates fall; birth rates remain high; growth rate
rises
 Stage 3—Birth rates fall as standard of living rises; growth rate
falls
 Stage 4 and 5—Growth rate continues to fall to zero or to a
negative rate
Stage 1
 high birth rates, high
(at time erratic) death
rates, low growth
rates, low total
population
 stage for much of
human history,
traditional societies
 practically no country
today
Stage 2
 high birth rates,
declining death rates,
rising growth rates
 improvements in
sanitation (water) and
medicine
 “developing countries”
 much of Africa today,
some countries of
Asia (Afghanistan,
Nepal, etc.)
Population Pyramid and Demographic
Transition
 Stage 2: wide base
 stage 3: wide middle
 stage 4: slender
 stage 5: narrow base
Stage 3
 continued decline of
death rates, declining
birth rates, growth
rates decline from high
to lower levels
 “moderately developed
countries”
 economic change:
urbanization (incentive
to have fewer children)
 Mexico today
Population Pyramid and Demographic
Transition
 Stage 2: wide base
stage 3: wide middle
 stage 4: slender
 stage 5: narrow base
Stage 4 & 5
 Stage 4: low birth
rates, low death rates,
low growth rates
 United States today
 Stage 5: low birth
rates, rising death
rates, declining growth
rates (if birth rates
drop below death
rates: negative growth
rates)
 several countries of
Europe today (Austria)
Population Pyramid and Demographic Transition
 Stage 2: wide base
 stage 3: wide middle
 stage 4: slender
 stage 5: narrow base
Population Pyramid and Demographic
Transition
 Stage 2: wide base
 stage 3: wide middle
 stage 4: slender
 stage 5: narrow base
38
 by comparing age structure diagrams between
countries it is possible to infer social changes that
occurred within the country and predict future
population changes
39
40
Solutions for slowing population
growth
 economic development
 reduction of poverty
 Education
 family planning
 reproductive health care
 empowering women
economic solutions—get people
out of poverty.
 “failing states”- rapid population growth, extreme
poverty and environmental degradation leads to the
government no longer ensuring the personal security
of their people and they can’t provide basic services.
Leads to people perpetually trapped in poverty.
 civil war and terrorism are common
 low income, less developed
 lack of skilled workers, financial capital
 stuck in stage 2 of transition
 ex. Somalia, Haiti
43
empowering women
 women will have fewer children if they are educated, can
control their own fertility, and earn an income of their own
 Microloans for skilled trades (weaving, sewing, etc.) to earn
income
 in many societies women have fewer rights and
educational and economic opportunities
 patriarchal societies (sons valued)--India
 women account for 66% of all hours worked but only 10% of
income earned (worldwide)
44
family planning
 helps couples choose how many children to have and when to
have them
 educating men and women
 birth spacing, birth control, health care for women and infants
 the older a women is when she has her first child will decrease the
total number of children
 reduces number of pregnancies and abortions (major decrease
in TFR)
 lack of access to services hinders efforts
Problems with a growing
population
 “graying of a population” (Japan)
 Characteristic of highly developed countries
 Women choosing not to have children..pursue career instead
 who will care for the elders?
 income to provide for social services
 economic impacts (smaller workforce)
 some countries providing incentives to have more
children (Europe)
 may be balanced out with a large number of
immigrants
Impacts
 Developed and Developing countries have different
impacts
 most of the world lives in developing countries, but
developed countries consume more resources
 ecological footprints and wealth gap
 Affluence
 Measure Impact using IPAT equation
 Impact= population x affluence x technology
 As a population grows resources need to be available to
meet the needs of the people
 land use (housing and agriculture)
 Sanitation and health care
 Access to clean water

HumanPopulationUpdated.ppt

  • 1.
    The Human Population andits Impact Chapter 6 and Chapter 23-4
  • 2.
    The Human Population Over Time Thetime it takes our population to double has decreased sharply. It only has taken about 12 years to go from 6-7 billion people. We are projected to hit 9 billion near the year 2050. Estimates say stabilization around 2100. (10.5 billion)
  • 3.
    Human Population OverTime  What’s your number? http://www.bbc.co.uk/news/world-15391515 Population Clock (census) http://www.census.gov/popclock/  Population growth video https://www.youtube.com/watch?v=khFjdmp9sZk 3
  • 4.
    Why our populationhas grown so quickly….  Humans have the ability to expand into all climate zones and habitats  Modern agriculture has allowed us to produce food very efficiently and in large quantities  Death rates decreased because of improved sanitation and healthcare (biggest influence)  The current global population growth rate is around 1.3% per year (and slowing). Most of this growth happens in developing countries.  If growth rate is slowing…why is our population still growing?
  • 5.
    • Overall, theworld population is growing at a rate of about 1.7 percent; if this rate continues, the population will double in 41 years. • Population growth rate peaked in the 1960s at about 2%
  • 7.
    Carrying Capacity  Underideal conditions populations will grow exponentially until limiting factors cause growth to slow.  Carrying Capacity: maximum number of individuals an ecosystem can support  Determined by limiting factors  Carrying capacity for humans on earth is highly debated.  Innovation and technology  Rules other populations follow don’t apply to us  Cultural carrying capacity: the maximum number of people who could live in reasonable freedom and comfort indefinitely without decreasing the ability of the earth to sustain future generations.  What standard of living are we willing to accept?
  • 8.
    Factors Affecting Growth When inputs into a system are larger than the outputs the system will grow  Births, Deaths, Immigration and Emigration  Crude birth rate: births per 1000  Crude death rate: deaths per 1000  Fertility Rates  Replacement level fertility (number to replace the parents)  Average 2.1-2.5 (babies dying before reproductive years)  Gauges changes in population size  Total fertility (estimate of average number of children born to women)  Lower in developed countries  US about 2.1  On average declining worldwide  China 1.5 TFR (one child policy)
  • 10.
     What factorsaffect birth and fertility rates?  Labor force  Cost of raising and educating children  Urbanization  Infant deaths  Education for women  Marrying age  Access to contraceptives  What factors affect death rates?  Access to nutrition, medical care, clean water  Community support for elders  Increased life expectancy  Usually higher for women  Decrease in infant mortality
  • 13.
    Infant Mortality  Goodmeasure of a nation’s quality of life  Measured as number of infant deaths per 1000 births  World average is 46  40 countries have a lower IMR than the US. Why?  Inadequate prenatal care, drug addiction, teenage pregnancies, socioeconomic variances
  • 14.
  • 15.
     Factors affectingMigration (immigration and emigration)  Net Migration Rate: difference between immigration and emigration per 1000 people in a given year (only effects individual countries)  Better jobs and economic improvement  Religious, ethnic, or political conflicts  Lack of access to basic needs (food, water, etc.)  Environmental refugees
  • 16.
    Exponential Growth Calculations  Calculatingand Predicting Rates of Growth—The Rule of 70  With populations that are growing exponentially we can use the rule of 70 to predict rates of growth and population doubling times.  **Assumes growth rate is constant. Estimate only.**  Doubling time (dt) = 70/ % growth rate  or  % growth rate = 70/dt
  • 17.
    Practice Problems  Ifthe starting population of 5 rabbits grows at 2% each year, how long will it take the population to double?  If the doubling time for a population is 7 years what is the growth rate over this time period?
  • 18.
    Population Pyramids  Graph(histogram) that allows us to see the population growth within a country broken down by age groups and gender  horizontal axis: gender  male: left-hand female: right-hand  absolute number of people or %  vertical axis: age  5-year or 10-year age groups  Ages categorized as…  Pre-reproductive: ages 0-14  Reproductive: ages 15-44  Post-reproductive: ages 44+
  • 19.
    Population Pyramids  Weclassify our pyramids based on the shape they take.  Rapidly Growing: large amounts of people in the pre- reproductive and reproductive years  Very large bottom of the pyramid  Growing Slowly: more individuals in the pre- reproductive and reproductive years  Bottom of pyramid is slightly larger than the rest  Stable (zero population growth): population is evenly distributed throughout age groups  Pyramid is relatively even top to bottom  Declining (negative growth): more individuals in the post-reproductive age groups  Bottom of pyramid is smaller than the top
  • 21.
  • 22.
  • 23.
  • 24.
  • 25.
  • 26.
    Population Pyramids  Wealso see differences based on economics. Is the country developed or developing?  Allows us to project future growth based on age structure.
  • 27.
    World Population Pyramid Using the data for the total population of the world (from 2010), construct an age structure pyramid. We will use this as a reference for other countries we discuss.  You will first need to convert the numbers into percentages for both males and females.  Divide the number in each category by the total population.  When finished with world pyramid, grab individual country pyramid and answer comparison questions.
  • 28.
    Demographic Transition  Movementof a nation from high population growth to low population as it develops economically (from subsistence economy to affluence).  Traced through graphs of a population change over time (birth rates and death rates)  Illustrates how countries will influence the environment as they transition  most countries will go through this transition in the next few decades due to technological and economic development  Transition as a result of five stages  Stage 1—Birth and death rates are both high  Stage 2—Death rates fall; birth rates remain high; growth rate rises  Stage 3—Birth rates fall as standard of living rises; growth rate falls  Stage 4 and 5—Growth rate continues to fall to zero or to a negative rate
  • 30.
    Stage 1  highbirth rates, high (at time erratic) death rates, low growth rates, low total population  stage for much of human history, traditional societies  practically no country today
  • 31.
    Stage 2  highbirth rates, declining death rates, rising growth rates  improvements in sanitation (water) and medicine  “developing countries”  much of Africa today, some countries of Asia (Afghanistan, Nepal, etc.)
  • 32.
    Population Pyramid andDemographic Transition  Stage 2: wide base  stage 3: wide middle  stage 4: slender  stage 5: narrow base
  • 33.
    Stage 3  continueddecline of death rates, declining birth rates, growth rates decline from high to lower levels  “moderately developed countries”  economic change: urbanization (incentive to have fewer children)  Mexico today
  • 34.
    Population Pyramid andDemographic Transition  Stage 2: wide base stage 3: wide middle  stage 4: slender  stage 5: narrow base
  • 35.
    Stage 4 &5  Stage 4: low birth rates, low death rates, low growth rates  United States today  Stage 5: low birth rates, rising death rates, declining growth rates (if birth rates drop below death rates: negative growth rates)  several countries of Europe today (Austria)
  • 36.
    Population Pyramid andDemographic Transition  Stage 2: wide base  stage 3: wide middle  stage 4: slender  stage 5: narrow base
  • 37.
    Population Pyramid andDemographic Transition  Stage 2: wide base  stage 3: wide middle  stage 4: slender  stage 5: narrow base
  • 38.
    38  by comparingage structure diagrams between countries it is possible to infer social changes that occurred within the country and predict future population changes
  • 39.
  • 40.
  • 41.
    Solutions for slowingpopulation growth  economic development  reduction of poverty  Education  family planning  reproductive health care  empowering women
  • 42.
    economic solutions—get people outof poverty.  “failing states”- rapid population growth, extreme poverty and environmental degradation leads to the government no longer ensuring the personal security of their people and they can’t provide basic services. Leads to people perpetually trapped in poverty.  civil war and terrorism are common  low income, less developed  lack of skilled workers, financial capital  stuck in stage 2 of transition  ex. Somalia, Haiti
  • 43.
    43 empowering women  womenwill have fewer children if they are educated, can control their own fertility, and earn an income of their own  Microloans for skilled trades (weaving, sewing, etc.) to earn income  in many societies women have fewer rights and educational and economic opportunities  patriarchal societies (sons valued)--India  women account for 66% of all hours worked but only 10% of income earned (worldwide)
  • 44.
    44 family planning  helpscouples choose how many children to have and when to have them  educating men and women  birth spacing, birth control, health care for women and infants  the older a women is when she has her first child will decrease the total number of children  reduces number of pregnancies and abortions (major decrease in TFR)  lack of access to services hinders efforts
  • 45.
    Problems with agrowing population  “graying of a population” (Japan)  Characteristic of highly developed countries  Women choosing not to have children..pursue career instead  who will care for the elders?  income to provide for social services  economic impacts (smaller workforce)  some countries providing incentives to have more children (Europe)  may be balanced out with a large number of immigrants
  • 46.
    Impacts  Developed andDeveloping countries have different impacts  most of the world lives in developing countries, but developed countries consume more resources  ecological footprints and wealth gap  Affluence  Measure Impact using IPAT equation  Impact= population x affluence x technology  As a population grows resources need to be available to meet the needs of the people  land use (housing and agriculture)  Sanitation and health care  Access to clean water

Editor's Notes

  • #3 What happened to cause this dramatic increase in exponential growth?
  • #7 What is happening in the developing countries to account for this huge increase in growth?
  • #8 What are examples of limiting factors?
  • #10 Totals Fertility Rate
  • #12 World Crude Birth Rates
  • #13 World crude Death Rates