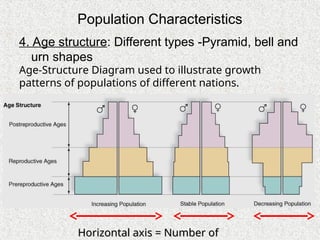
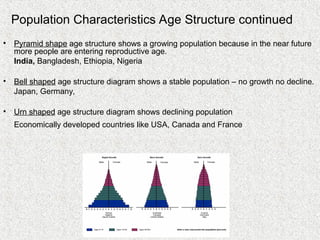
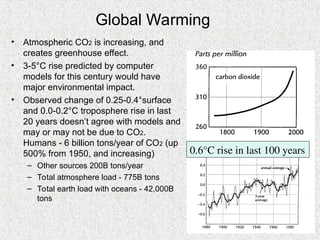
Human Population
Human Population
and Environment
and Environment
The biggest environmental
problem we have now is
High Population.
POPULATION
• Definition: Group of organisms of
individuals belonging to the same species
occupying a given area at a given time.
Example – Human population, Animal
population, Birds population
Population Growth
since evolution of man
• Earth - 5 Billion Years
• Multi-cell Biota - 600 Million Years
• Human Beings ~ 2 Million Years
• Human become powerful among other
creatures.
• Human Population Growth enormously
increased in Last 200 years.
Global Population growth
• In 1800, Human population on earth – 1 billion.
• In the history of human, it took 39 thousand years to
reach 1 billion
• After 130 years (1930) it to reached 2 billion.
• After 45 years (1975) it reached to 4 billion
• Now we have crossed 6 billion, globally.
• In 2045, we expect this value will increased to 11 billion
• In beginning of human civilization the population
was quite stable.
• Due to the environmental conditions like droughts,
flood and health conditions like spreading diseases
• leads to mass deaths
• For example in 14th
century A.D. large scale mortality
happened due to plague
• 50% of people died in Asia and Europe
Reason for the population growth
Scientific and Technological
advancement
• People started to live in a definite settlements,
which leads to
• Stable life, better sanitation, sufficient food,
good medical facility
• Victory over, famine-related (scarcity of food)
death and infant mortality
• Which increased the population size.
Population Growth in the World
1950-2150
Population (in billions)
10
8
6
4
2
1750 1800 1850 1900 1950 2000 2050 2100 2150
Population Characteristics
and their variations
• Exponential growth: A increase in quantity by a
constant amount per unit time is called linear
growth.
• Eg. 1, 3, 5, 7 etc. (Linear growth)
• But when it increases by a fixed percentage is
known as exponential growth
• Eg. 10, 102
, 103
, or 2, 4, 8, 16
• Exponential population-globally in last 150 years
• Doubling time: The time needed for a
population too double its size at a constant
annual rate is known as doubling time
• It is calculated as
Td = 70/r where
Td = Doubling time in years
r = annual growth rate
If a nation has 2% annual growth rate, Its
population will double in 35 years.
Population Characteristics
and their variations
Population Characteristics and
variations among nations
1. Total Fertility rate (TFR):
• The average number of children that would be born in the life time of
a woman. (Birth rate)
• It varies
• For 1.9 in developed countries
• For 4.7 in less developed countries:
• The higher the TFR the more is the population growth
• Employing family planning methods caused a decrease in TFR in
developed / developing countries.
• Illiteracy and religious sentiments are the cause.
• Some are believing that it is a sin
• It can be reduced by adopting family planning methods
Population Characteristics and
variations among nations
2. Infant Mortality rate: It is the percentage of
infants died out of those born : The more
is IMR, the less is population growth
Infant survival improved due to health care
facilities
– Vaccination against polio, small pox, TB.
– Antibiotics
Population Characteristics
and variations among nations
3. Replacement level: How many children
survive per family – how many people are
replaced by how many children : Less no.
of replacing children means less is the
population growth – it is related to life
expectancy.
In developed nation – infant mortality is high
Developing nations - infant mortality is low
4. Age Structures
Developed countries Less-developed countries
Human Age Distribution : It is a diagram that shows the annual population
of a particular age group. Usually male population shown on left side and
female population on right side.
Population Characteristics
4. Age structure: Different types -Pyramid, bell and
urn shapes
Horizontal axis = Number of
Age-Structure Diagram used to illustrate growth
patterns of populations of different nations.
Population Characteristics Age Structure continued
• Pyramid shape age structure shows a growing population because in the near future
more people are entering reproductive age.
India, Bangladesh, Ethiopia, Nigeria
• Bell shaped age structure diagram shows a stable population – no growth no decline.
Japan, Germany,
• Urn shaped age structure diagram shows declining population
Economically developed countries like USA, Canada and France
Population Characteristics
continued
5. Life expectancy: It is the average life period a person
lives in a country.
It is improved in many countries due to improved living
conditions.
• Animal Domestication and Agriculture
– Provided for a few to feed many
• Increased
Nutrition
Sanitation
• It also improved in many countries due to improved
medical facilities.
Terminology related to Population
• Doubling time: The time needed for a population too double its size at
a constant annual rate is known as doubling time
• It is calculated as
Td = 70/r{ 70 is the approximate value to get double the size}
where
Td = Doubling time in years
r = annual growth rate
If a nation has 2% annual growth rate, Its population will double in 35
years.
Zero population growth : It is the situation when
Birth + immigration = Death + emigration
Male-Female ratio: The ratio of boys and girls. Should be fairly same. But
in some regions girls are less because of infanticide (Killing).
Overall population growth in recent past
• Pre-industrial phase: High birth and high death – net
population growth less
• Transitional phase: High birth, but low death rate due to
better medical facilities – overall growth very high – 2.5 -
3%
• Industrial phase: Fall in birth rates – lowering in growth
rate
• Present (post-industrial phase): Zero growth in many
parts of the world
Indian scenario
• India is presently the second most
populated country with the population of
1.18 billion
• Its population grew similar to other
countries in the 20th
century.
• Present growth is at the rate of 92 millions
per annum
• It is expected to grow 4 times in the next
100 years.
Indian scenario
0
200,000,000
400,000,000
600,000,000
800,000,000
1,000,000,000
1,200,000,000
1880 1900 1920 1940 1960 1980 2000 2020
Data obtained from website of Census of India, Office of Registrar General and Census
Commissioner, India.
Impact of population growth
on Environment
• Ecological Footprints
– United States - 5 hectares/person
– Developing nations - 0.5 hectare/person
• For everyone to live at today’s US footprint
would require 3 planet Earths
• Increasing population and urbanization is
damaging Earth’s essential ecology
Our ‘Resources’ are in Danger
• Atmospheric pollution and climate change
• Water pollution, including ground aquifers
• Deforestation and loss of oxygenation
• The oceans, coral reefs and their bounty
• National parks, wildernesses and wetlands
• Nonrenewable natural resource depletion
– Fossil fuels, mineral ores, topsoil…..
Biodiversity is in Danger
• Humanity has spawned a species
extinction to rival the 5 great extinctions of
65 - 440 million years ago
• Recovery times from the great extinctions
took 10’s of millions of years
• Biodiversity is essential to life on Earth
and holds untold treasures for the future
• An ecological ethic is emerging
Global Warming
• Atmospheric CO2 is increasing, and
creates greenhouse effect.
• 3-5°C rise predicted by computer
models for this century would have
major environmental impact.
• Observed change of 0.25-0.4°surface
and 0.0-0.2°C troposphere rise in last
20 years doesn’t agree with models and
may or may not be due to CO2.
Humans - 6 billion tons/year of CO2 (up
500% from 1950, and increasing)
– Other sources 200B tons/year
– Total atmosphere load - 775B tons
– Total earth load with oceans - 42,000B
tons
0.6°C rise in last 100 years
How do we curb
the population growth?
Family planning: Several Scientific methods evolved to stop child birth.
• UN Family planning agency has funded several countries for family planning.
• In India our govt. is also funding for family planning programs
• (Ministry of Health and Family welfare)
Like educating people either directly person to person or through mass media
Funding for research on family planning methods
• NGO’s like Indian family planning association of India (FPA) are also working
on this.
• In India we are targeting two children per couple
• Family planning in India started in 1952
• Several methods are available to reduce birth rate of children but not working
that well in India
– Lack of education: many people are scared to use these methods
– Religious misbelieves : It is wrong in almost all religions to stop child birth
Family planning in India
• In 1978 the Govt raised the legal minimum age for marriage from 18 to 21.
• Still the growth rate did not decrease.
• It then allowed states to employ their own methods.
• The first state to achieve zero population growth in the country is
• Kerala:
• Average age of a person at the time of marriage is 21 years
• Female literacy 53% (against 13% in other parts)
• Emphasis on primary education 60% budget allocation
• Distribution/availability of food – 97%
• Medical facilities – available to all villages
• Reason: Educated took interest in the state. They created awareness
among the common. Even people listened.
• Next state to get zpg is AP. There the method is different. They gave
incentives to all those who got sterilized
• Population is still growing in UP and Bihar.
Indian scenario
In the year 2001
0 50,000,000 100,000,000 150,000,000 200,000,000 250,000,000 300,000
0 - 4
5- 9
10- 14
15- 19
20 - 24
25 - 44
45 - 64
65 - 79
80+
From Census of India, website of Office of Registrar General and Census
Commissioner, India.
Human Rights
what are human rights and
what is the need for human
rights
Human Rights
• How many human rights do we have?
• The six fundamental rights embedded into the constitution in 1950
are
1. Right to equality
2. Right to freedom
3. Right against exploitation
4. Right to freedom of religion
5. Cultural and educational rights
6. Right to constitutional remedies
Several other rights exist, they are amended every now and then.
• National Human Rights Commission, New Delhi, India Monitors the
aspects related to Human Rights in India.
Human Rights in India
• Our problems are mainly concerned with Social,
economic, and political discriminations
• The human rights in India are mainly
concentrated on
– Slavery,
– bonded labour,
– gender equality,
– violence against women and children,
– dowry deaths,
– torture and mass killings
Human Rights set by UN
• On 10 December 1948, the General Assembly of the
United Nations adopted and proclaimed the Universal
Declaration of Human Rights and asked its member
nations to give propaganda to the same.
• At present there are 30 of them
• Available at
• http://www.un.org/Overview/rights.html
• There is a Commission on human rights which “Drafts
international human rights treaties, investigates rights
violations, and advises states on implementation of
rights agreements”
• www.unhchr.ch/html/menu2/2/chr.htm
Human Rights set by UN
• The human rights of UN are amended in 1994.
• It made
• “Declaration of Human Rights and Environment”
and included,
“The right of every human being to a healthy,
secure and ecologically sound environment”.
• Equity, security, attainment of basic human
needs and environmental justice to all.
Human Rights set by UN
Contents of Declaration of Human Rights and Environment
• Part I: Deals with human rights for an ecologically sound
environment, sustainable development and peace for all.
• Part II: Deals with human rights related to an
environment free from pollution and degradation
• Part III: Deals with right of every person to
environmental information, education, awareness and
also public participation in environmental decision
making
• Part IV: Deals with the duties to protect and preserve the
environment
• Part V: Lays stress on social justice and equity with
respect to use of natural resources and sustainable
development.
Value Education
Value Education
• Education is required for all forms of progress
• In general, the present attitude is more
education means more money,
greater employment options and better job
security.
• In our need to earn money we often become
materialistic, self-centered, over ambitious and
forget the ideals required for a real good life.
Value Education
• True Education means
– Not just acquiring knowledge but also using the
knowledge with correct ethical values
• Value education means
– Developing positive attitude towards life
– The correct ability to distinguish between right and
wrong.
– To become affectionate, helpful, peace loving,
generous and tolerant.
– Achieving prosperity through a more harmonious,
peaceful, enjoyable and sustainable manner.
Value education
• It covers
– Human values
– Social values
– Professional values
– Religious values
– National values
– Aesthetic values
and Environmental values
Value education
Value based Environmental Education:
Supreme Court directives (1988, MC Mehta vs Union of India)
Environmental education should begin with basic education
Salient features of Value based environmental education
1. Preparation of text books and resource materials about
Environmental education
2. Giving importance to Social Values: It should stress humanly
values like Compassion, Tolerance, and Justice
3. Cultural and religious values: Every religion teaches good things.
Take all good things from your religion and follow that.
4. Should stress on ethical values of earth-centric than human
centric view
5. Global values: Human civilization is part of the world as a whole
6. Spiritual values:
– Teach people to practice self-restraint, self-discipline, contentment,
reduction of wants, freedom from greed

Human Population - Environmental Science.ppt

  • 1.
    Human Population Human Population andEnvironment and Environment
  • 2.
    The biggest environmental problemwe have now is High Population.
  • 3.
    POPULATION • Definition: Groupof organisms of individuals belonging to the same species occupying a given area at a given time. Example – Human population, Animal population, Birds population
  • 4.
    Population Growth since evolutionof man • Earth - 5 Billion Years • Multi-cell Biota - 600 Million Years • Human Beings ~ 2 Million Years • Human become powerful among other creatures. • Human Population Growth enormously increased in Last 200 years.
  • 5.
    Global Population growth •In 1800, Human population on earth – 1 billion. • In the history of human, it took 39 thousand years to reach 1 billion • After 130 years (1930) it to reached 2 billion. • After 45 years (1975) it reached to 4 billion • Now we have crossed 6 billion, globally. • In 2045, we expect this value will increased to 11 billion
  • 6.
    • In beginningof human civilization the population was quite stable. • Due to the environmental conditions like droughts, flood and health conditions like spreading diseases • leads to mass deaths • For example in 14th century A.D. large scale mortality happened due to plague • 50% of people died in Asia and Europe Reason for the population growth
  • 7.
    Scientific and Technological advancement •People started to live in a definite settlements, which leads to • Stable life, better sanitation, sufficient food, good medical facility • Victory over, famine-related (scarcity of food) death and infant mortality • Which increased the population size.
  • 8.
    Population Growth inthe World 1950-2150 Population (in billions) 10 8 6 4 2 1750 1800 1850 1900 1950 2000 2050 2100 2150
  • 9.
    Population Characteristics and theirvariations • Exponential growth: A increase in quantity by a constant amount per unit time is called linear growth. • Eg. 1, 3, 5, 7 etc. (Linear growth) • But when it increases by a fixed percentage is known as exponential growth • Eg. 10, 102 , 103 , or 2, 4, 8, 16 • Exponential population-globally in last 150 years
  • 10.
    • Doubling time:The time needed for a population too double its size at a constant annual rate is known as doubling time • It is calculated as Td = 70/r where Td = Doubling time in years r = annual growth rate If a nation has 2% annual growth rate, Its population will double in 35 years. Population Characteristics and their variations
  • 11.
    Population Characteristics and variationsamong nations 1. Total Fertility rate (TFR): • The average number of children that would be born in the life time of a woman. (Birth rate) • It varies • For 1.9 in developed countries • For 4.7 in less developed countries: • The higher the TFR the more is the population growth • Employing family planning methods caused a decrease in TFR in developed / developing countries. • Illiteracy and religious sentiments are the cause. • Some are believing that it is a sin • It can be reduced by adopting family planning methods
  • 12.
    Population Characteristics and variationsamong nations 2. Infant Mortality rate: It is the percentage of infants died out of those born : The more is IMR, the less is population growth Infant survival improved due to health care facilities – Vaccination against polio, small pox, TB. – Antibiotics
  • 13.
    Population Characteristics and variationsamong nations 3. Replacement level: How many children survive per family – how many people are replaced by how many children : Less no. of replacing children means less is the population growth – it is related to life expectancy. In developed nation – infant mortality is high Developing nations - infant mortality is low
  • 14.
    4. Age Structures Developedcountries Less-developed countries Human Age Distribution : It is a diagram that shows the annual population of a particular age group. Usually male population shown on left side and female population on right side.
  • 15.
    Population Characteristics 4. Agestructure: Different types -Pyramid, bell and urn shapes Horizontal axis = Number of Horizontal axis = Number of Age-Structure Diagram used to illustrate growth patterns of populations of different nations.
  • 16.
    Population Characteristics AgeStructure continued • Pyramid shape age structure shows a growing population because in the near future more people are entering reproductive age. India, Bangladesh, Ethiopia, Nigeria • Bell shaped age structure diagram shows a stable population – no growth no decline. Japan, Germany, • Urn shaped age structure diagram shows declining population Economically developed countries like USA, Canada and France
  • 17.
    Population Characteristics continued 5. Lifeexpectancy: It is the average life period a person lives in a country. It is improved in many countries due to improved living conditions. • Animal Domestication and Agriculture – Provided for a few to feed many • Increased Nutrition Sanitation • It also improved in many countries due to improved medical facilities.
  • 18.
    Terminology related toPopulation • Doubling time: The time needed for a population too double its size at a constant annual rate is known as doubling time • It is calculated as Td = 70/r{ 70 is the approximate value to get double the size} where Td = Doubling time in years r = annual growth rate If a nation has 2% annual growth rate, Its population will double in 35 years. Zero population growth : It is the situation when Birth + immigration = Death + emigration Male-Female ratio: The ratio of boys and girls. Should be fairly same. But in some regions girls are less because of infanticide (Killing).
  • 19.
    Overall population growthin recent past • Pre-industrial phase: High birth and high death – net population growth less • Transitional phase: High birth, but low death rate due to better medical facilities – overall growth very high – 2.5 - 3% • Industrial phase: Fall in birth rates – lowering in growth rate • Present (post-industrial phase): Zero growth in many parts of the world
  • 20.
    Indian scenario • Indiais presently the second most populated country with the population of 1.18 billion • Its population grew similar to other countries in the 20th century. • Present growth is at the rate of 92 millions per annum • It is expected to grow 4 times in the next 100 years.
  • 21.
    Indian scenario 0 200,000,000 400,000,000 600,000,000 800,000,000 1,000,000,000 1,200,000,000 1880 19001920 1940 1960 1980 2000 2020 Data obtained from website of Census of India, Office of Registrar General and Census Commissioner, India.
  • 23.
    Impact of populationgrowth on Environment • Ecological Footprints – United States - 5 hectares/person – Developing nations - 0.5 hectare/person • For everyone to live at today’s US footprint would require 3 planet Earths • Increasing population and urbanization is damaging Earth’s essential ecology
  • 24.
    Our ‘Resources’ arein Danger • Atmospheric pollution and climate change • Water pollution, including ground aquifers • Deforestation and loss of oxygenation • The oceans, coral reefs and their bounty • National parks, wildernesses and wetlands • Nonrenewable natural resource depletion – Fossil fuels, mineral ores, topsoil…..
  • 25.
    Biodiversity is inDanger • Humanity has spawned a species extinction to rival the 5 great extinctions of 65 - 440 million years ago • Recovery times from the great extinctions took 10’s of millions of years • Biodiversity is essential to life on Earth and holds untold treasures for the future • An ecological ethic is emerging
  • 26.
    Global Warming • AtmosphericCO2 is increasing, and creates greenhouse effect. • 3-5°C rise predicted by computer models for this century would have major environmental impact. • Observed change of 0.25-0.4°surface and 0.0-0.2°C troposphere rise in last 20 years doesn’t agree with models and may or may not be due to CO2. Humans - 6 billion tons/year of CO2 (up 500% from 1950, and increasing) – Other sources 200B tons/year – Total atmosphere load - 775B tons – Total earth load with oceans - 42,000B tons 0.6°C rise in last 100 years
  • 27.
    How do wecurb the population growth? Family planning: Several Scientific methods evolved to stop child birth. • UN Family planning agency has funded several countries for family planning. • In India our govt. is also funding for family planning programs • (Ministry of Health and Family welfare) Like educating people either directly person to person or through mass media Funding for research on family planning methods • NGO’s like Indian family planning association of India (FPA) are also working on this. • In India we are targeting two children per couple • Family planning in India started in 1952 • Several methods are available to reduce birth rate of children but not working that well in India – Lack of education: many people are scared to use these methods – Religious misbelieves : It is wrong in almost all religions to stop child birth
  • 28.
    Family planning inIndia • In 1978 the Govt raised the legal minimum age for marriage from 18 to 21. • Still the growth rate did not decrease. • It then allowed states to employ their own methods. • The first state to achieve zero population growth in the country is • Kerala: • Average age of a person at the time of marriage is 21 years • Female literacy 53% (against 13% in other parts) • Emphasis on primary education 60% budget allocation • Distribution/availability of food – 97% • Medical facilities – available to all villages • Reason: Educated took interest in the state. They created awareness among the common. Even people listened. • Next state to get zpg is AP. There the method is different. They gave incentives to all those who got sterilized • Population is still growing in UP and Bihar.
  • 29.
    Indian scenario In theyear 2001 0 50,000,000 100,000,000 150,000,000 200,000,000 250,000,000 300,000 0 - 4 5- 9 10- 14 15- 19 20 - 24 25 - 44 45 - 64 65 - 79 80+ From Census of India, website of Office of Registrar General and Census Commissioner, India.
  • 30.
    Human Rights what arehuman rights and what is the need for human rights
  • 31.
    Human Rights • Howmany human rights do we have? • The six fundamental rights embedded into the constitution in 1950 are 1. Right to equality 2. Right to freedom 3. Right against exploitation 4. Right to freedom of religion 5. Cultural and educational rights 6. Right to constitutional remedies Several other rights exist, they are amended every now and then. • National Human Rights Commission, New Delhi, India Monitors the aspects related to Human Rights in India.
  • 32.
    Human Rights inIndia • Our problems are mainly concerned with Social, economic, and political discriminations • The human rights in India are mainly concentrated on – Slavery, – bonded labour, – gender equality, – violence against women and children, – dowry deaths, – torture and mass killings
  • 33.
    Human Rights setby UN • On 10 December 1948, the General Assembly of the United Nations adopted and proclaimed the Universal Declaration of Human Rights and asked its member nations to give propaganda to the same. • At present there are 30 of them • Available at • http://www.un.org/Overview/rights.html • There is a Commission on human rights which “Drafts international human rights treaties, investigates rights violations, and advises states on implementation of rights agreements” • www.unhchr.ch/html/menu2/2/chr.htm
  • 34.
    Human Rights setby UN • The human rights of UN are amended in 1994. • It made • “Declaration of Human Rights and Environment” and included, “The right of every human being to a healthy, secure and ecologically sound environment”. • Equity, security, attainment of basic human needs and environmental justice to all.
  • 35.
    Human Rights setby UN Contents of Declaration of Human Rights and Environment • Part I: Deals with human rights for an ecologically sound environment, sustainable development and peace for all. • Part II: Deals with human rights related to an environment free from pollution and degradation • Part III: Deals with right of every person to environmental information, education, awareness and also public participation in environmental decision making • Part IV: Deals with the duties to protect and preserve the environment • Part V: Lays stress on social justice and equity with respect to use of natural resources and sustainable development.
  • 36.
  • 37.
    Value Education • Educationis required for all forms of progress • In general, the present attitude is more education means more money, greater employment options and better job security. • In our need to earn money we often become materialistic, self-centered, over ambitious and forget the ideals required for a real good life.
  • 38.
    Value Education • TrueEducation means – Not just acquiring knowledge but also using the knowledge with correct ethical values • Value education means – Developing positive attitude towards life – The correct ability to distinguish between right and wrong. – To become affectionate, helpful, peace loving, generous and tolerant. – Achieving prosperity through a more harmonious, peaceful, enjoyable and sustainable manner.
  • 39.
    Value education • Itcovers – Human values – Social values – Professional values – Religious values – National values – Aesthetic values and Environmental values
  • 40.
    Value education Value basedEnvironmental Education: Supreme Court directives (1988, MC Mehta vs Union of India) Environmental education should begin with basic education Salient features of Value based environmental education 1. Preparation of text books and resource materials about Environmental education 2. Giving importance to Social Values: It should stress humanly values like Compassion, Tolerance, and Justice 3. Cultural and religious values: Every religion teaches good things. Take all good things from your religion and follow that. 4. Should stress on ethical values of earth-centric than human centric view 5. Global values: Human civilization is part of the world as a whole 6. Spiritual values: – Teach people to practice self-restraint, self-discipline, contentment, reduction of wants, freedom from greed

Editor's Notes

  • #8 In 2000, the world had 6.1 billion human inhabitants. This number could rise to more than 9 billion in the next 50 years. For the last 50 years, world population multiplied more rapidly than ever before, and more rapidly than it will ever grow in the future. What I mean by this is that it is almost inconceivable that any comparable period of time has seen such a rapid increase in human numbers and, likewise, that we will ever see such rapid growth again. Around 1880 the world’s population probably first reached 1 billion