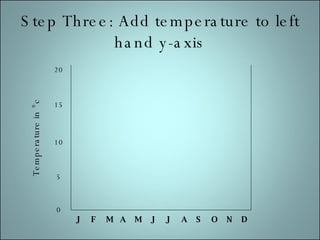
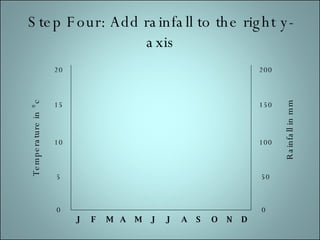
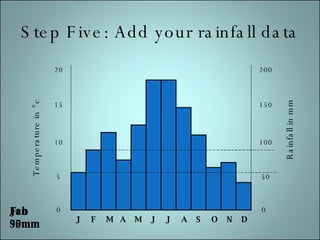
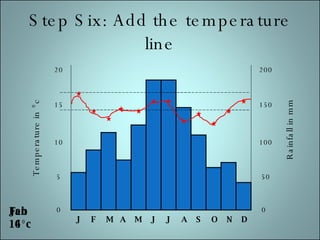
The document provides instructions for creating a climate graph to compare the monthly temperature and rainfall patterns in Nairobi and London. It involves 6 steps: 1) Draw axes for months, temperature, and rainfall. 2) Add the months to the x-axis. 3) Add the temperature scale to the left y-axis. 4) Add the rainfall scale to the right y-axis. 5) Add the monthly rainfall data points. 6) Add the monthly temperature line. Following these 6 steps will result in a completed climate graph.