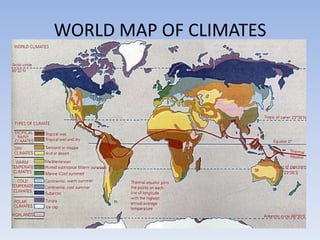
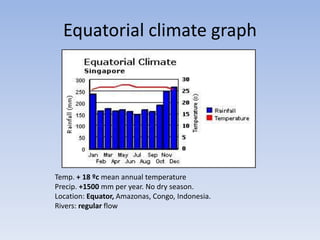
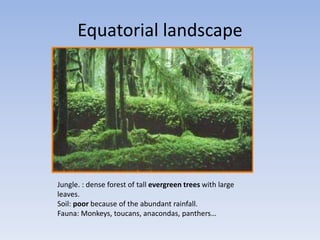
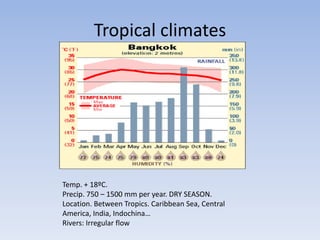
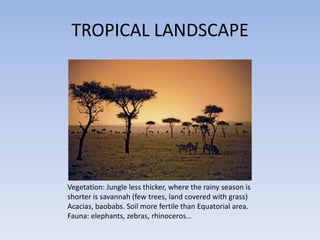
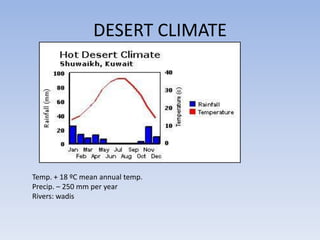
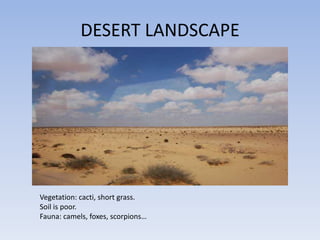
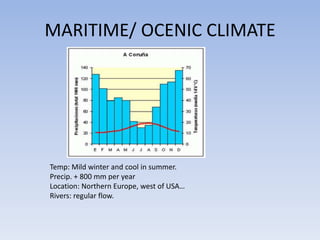
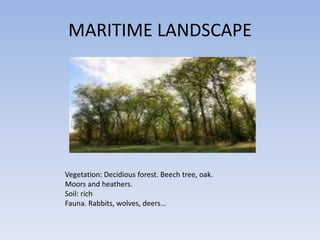
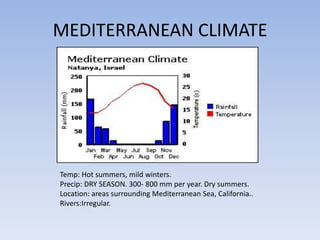
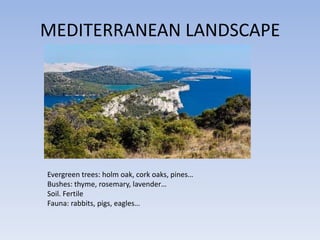
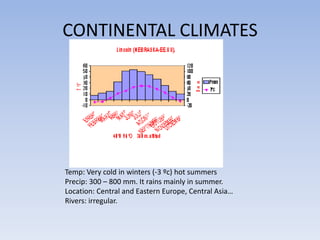
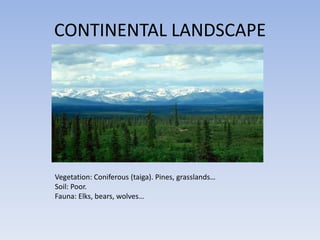
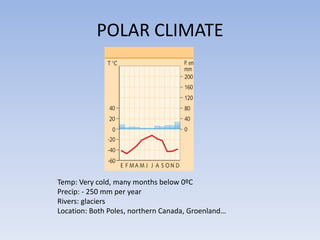
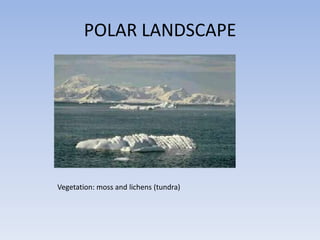
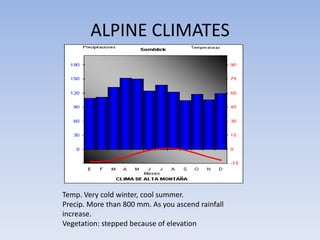
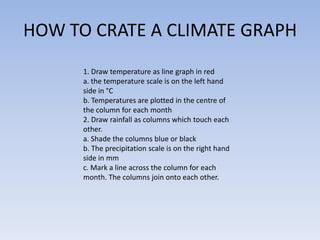
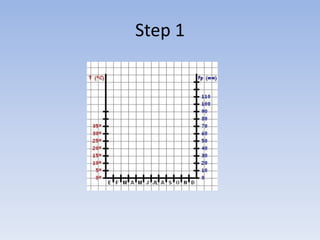
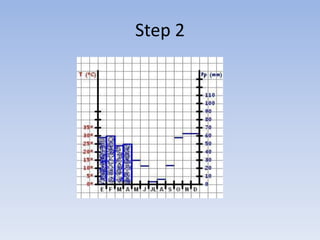
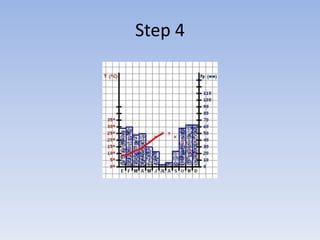
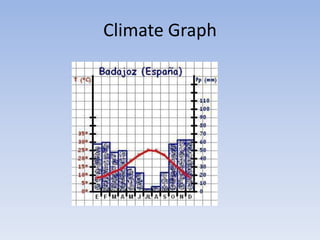
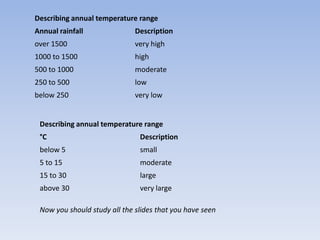
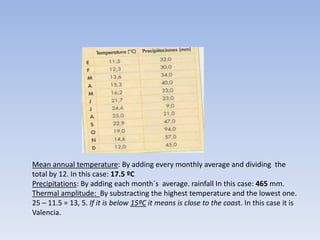
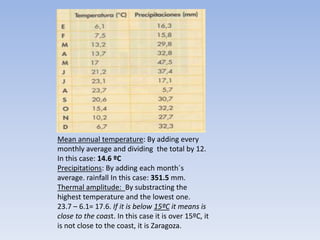
WEATHER AND CLIMATE

 Pictures and map concepts
WORLD MAP OF CLIMATES
HOT CLIMATES

Equatorial, Tropical and Desert.
Equatorial climate graph


Temp. + 18 ºc mean annual temperature
Precip. +1500 mm per year. No dry season.
Location: Equator, Amazonas, Congo, Indonesia.
Rivers: regular flow
Equatorial landscape


Jungle. : dense forest of tall evergreen trees with large
leaves.
Soil: poor because of the abundant rainfall.
Fauna: Monkeys, toucans, anacondas, panthers…
Tropical climates


Temp. + 18ºC.
Precip. 750 – 1500 mm per year. DRY SEASON.
Location. Between Tropics. Caribbean Sea, Central
America, India, Indochina…
Rivers: Irregular flow
TROPICAL LANDSCAPE


Vegetation: Jungle less thicker, where the rainy season is
shorter is savannah (few trees, land covered with grass)
Acacias, baobabs. Soil more fertile than Equatorial area.
Fauna: elephants, zebras, rhinoceros…
DESERT CLIMATE


Temp. + 18 ºC mean annual temp.
Precip. – 250 mm per year
Rivers: wadis
DESERT LANDSCAPE


Vegetation: cacti, short grass.
Soil is poor.
Fauna: camels, foxes, scorpions…
MILD CLIMATES
MARITIME/ OCENIC CLIMATE


Temp: Mild winter and cool in summer.
Precip. + 800 mm per year
Location: Northern Europe, west of USA…
Rivers: regular flow.
MARITIME LANDSCAPE


Vegetation: Decidious forest. Beech tree, oak.
Moors and heathers.
Soil: rich
Fauna. Rabbits, wolves, deers…
MEDITERRANEAN CLIMATE


Temp: Hot summers, mild winters.
Precip: DRY SEASON. 300- 800 mm per year. Dry summers.
Location: areas surrounding Mediterranean Sea, California..
Rivers:Irregular.
MEDITERRANEAN LANDSCAPE


Evergreen trees: holm oak, cork oaks, pines…
Bushes: thyme, rosemary, lavender…
Soil. Fertile
Fauna: rabbits, pigs, eagles…
CONTINENTAL CLIMATES


Temp: Very cold in winters (-3 ºc) hot summers
Precip: 300 – 800 mm. It rains mainly in summer.
Location: Central and Eastern Europe, Central Asia…
Rivers: irregular.
CONTINENTAL LANDSCAPE


Vegetation: Coniferous (taiga). Pines, grasslands…
Soil: Poor.
Fauna: Elks, bears, wolves…
COLD CLIMATES
POLAR CLIMATE


Temp: Very cold, many months below 0ºC
Precip: - 250 mm per year
Rivers: glaciers
Location: Both Poles, northern Canada, Groenland…
POLAR LANDSCAPE


Vegetation: moss and lichens (tundra)
ALPINE CLIMATES


Temp. Very cold winter, cool summer.
Precip. More than 800 mm. As you ascend rainfall
increase.
Vegetation: stepped because of elevation
HOW TO CRATE A CLIMATE GRAPH
      1. Draw temperature as line graph in red
      a. the temperature scale is on the left hand
      side in °C
      b. Temperatures are plotted in the centre of
      the column for each month
      2. Draw rainfall as columns which touch each
      other.
      a. Shade the columns blue or black
      b. The precipitation scale is on the right hand
      side in mm
      c. Mark a line across the column for each
      month. The columns join onto each other.
Step 1
Step 2
Step 3
Step 4
Climate Graph
Describing annual temperature range
Annual rainfall               Description
over 1500                     very high
1000 to 1500                  high
500 to 1000                   moderate
250 to 500                    low
below 250                     very low


 Describing annual temperature range
 °C                            Description
 below 5                       small
 5 to 15                       moderate
 15 to 30                      large
 above 30                      very large

 Now you should study all the slides that you have seen
Mean annual temperature: By adding every monthly average and dividing the
total by 12. In this case: 17.5 ºC
Precipitations: By adding each month´s average. rainfall In this case: 465 mm.
Thermal amplitude: By substracting the highest temperature and the lowest one.
25 – 11.5 = 13, 5. If it is below 15ºC it means is close to the coast. In this case it is
Valencia.
Mean annual temperature: By adding every
monthly average and dividing the total by 12.
In this case: 14.6 ºC
Precipitations: By adding each month´s
average. rainfall In this case: 351.5 mm.
Thermal amplitude: By substracting the
highest temperature and the lowest one.
23.7 – 6.1= 17.6. If it is below 15ºC it means is
close to the coast. In this case it is over 15ºC, it
is not close to the coast, it is Zaragoza.
Take a look at this website


   http://www4.uwsp.edu/geO/faculty/ritter/inte
   ractive_climate_map/climate_map.html

Weather and climate

  • 1.
    WEATHER AND CLIMATE Pictures and map concepts
  • 2.
    WORLD MAP OFCLIMATES
  • 3.
  • 4.
    Equatorial climate graph Temp.+ 18 ºc mean annual temperature Precip. +1500 mm per year. No dry season. Location: Equator, Amazonas, Congo, Indonesia. Rivers: regular flow
  • 5.
    Equatorial landscape Jungle. :dense forest of tall evergreen trees with large leaves. Soil: poor because of the abundant rainfall. Fauna: Monkeys, toucans, anacondas, panthers…
  • 6.
    Tropical climates Temp. +18ºC. Precip. 750 – 1500 mm per year. DRY SEASON. Location. Between Tropics. Caribbean Sea, Central America, India, Indochina… Rivers: Irregular flow
  • 7.
    TROPICAL LANDSCAPE Vegetation: Jungleless thicker, where the rainy season is shorter is savannah (few trees, land covered with grass) Acacias, baobabs. Soil more fertile than Equatorial area. Fauna: elephants, zebras, rhinoceros…
  • 8.
    DESERT CLIMATE Temp. +18 ºC mean annual temp. Precip. – 250 mm per year Rivers: wadis
  • 9.
    DESERT LANDSCAPE Vegetation: cacti,short grass. Soil is poor. Fauna: camels, foxes, scorpions…
  • 10.
  • 11.
    MARITIME/ OCENIC CLIMATE Temp:Mild winter and cool in summer. Precip. + 800 mm per year Location: Northern Europe, west of USA… Rivers: regular flow.
  • 12.
    MARITIME LANDSCAPE Vegetation: Decidiousforest. Beech tree, oak. Moors and heathers. Soil: rich Fauna. Rabbits, wolves, deers…
  • 13.
    MEDITERRANEAN CLIMATE Temp: Hotsummers, mild winters. Precip: DRY SEASON. 300- 800 mm per year. Dry summers. Location: areas surrounding Mediterranean Sea, California.. Rivers:Irregular.
  • 14.
    MEDITERRANEAN LANDSCAPE Evergreen trees:holm oak, cork oaks, pines… Bushes: thyme, rosemary, lavender… Soil. Fertile Fauna: rabbits, pigs, eagles…
  • 15.
    CONTINENTAL CLIMATES Temp: Verycold in winters (-3 ºc) hot summers Precip: 300 – 800 mm. It rains mainly in summer. Location: Central and Eastern Europe, Central Asia… Rivers: irregular.
  • 16.
    CONTINENTAL LANDSCAPE Vegetation: Coniferous(taiga). Pines, grasslands… Soil: Poor. Fauna: Elks, bears, wolves…
  • 17.
  • 18.
    POLAR CLIMATE Temp: Verycold, many months below 0ºC Precip: - 250 mm per year Rivers: glaciers Location: Both Poles, northern Canada, Groenland…
  • 19.
  • 20.
    ALPINE CLIMATES Temp. Verycold winter, cool summer. Precip. More than 800 mm. As you ascend rainfall increase. Vegetation: stepped because of elevation
  • 21.
    HOW TO CRATEA CLIMATE GRAPH 1. Draw temperature as line graph in red a. the temperature scale is on the left hand side in °C b. Temperatures are plotted in the centre of the column for each month 2. Draw rainfall as columns which touch each other. a. Shade the columns blue or black b. The precipitation scale is on the right hand side in mm c. Mark a line across the column for each month. The columns join onto each other.
  • 22.
  • 23.
  • 24.
  • 25.
  • 26.
  • 27.
    Describing annual temperaturerange Annual rainfall Description over 1500 very high 1000 to 1500 high 500 to 1000 moderate 250 to 500 low below 250 very low Describing annual temperature range °C Description below 5 small 5 to 15 moderate 15 to 30 large above 30 very large Now you should study all the slides that you have seen
  • 28.
    Mean annual temperature:By adding every monthly average and dividing the total by 12. In this case: 17.5 ºC Precipitations: By adding each month´s average. rainfall In this case: 465 mm. Thermal amplitude: By substracting the highest temperature and the lowest one. 25 – 11.5 = 13, 5. If it is below 15ºC it means is close to the coast. In this case it is Valencia.
  • 29.
    Mean annual temperature:By adding every monthly average and dividing the total by 12. In this case: 14.6 ºC Precipitations: By adding each month´s average. rainfall In this case: 351.5 mm. Thermal amplitude: By substracting the highest temperature and the lowest one. 23.7 – 6.1= 17.6. If it is below 15ºC it means is close to the coast. In this case it is over 15ºC, it is not close to the coast, it is Zaragoza.
  • 30.
    Take a lookat this website http://www4.uwsp.edu/geO/faculty/ritter/inte ractive_climate_map/climate_map.html