Downloaded 413 times


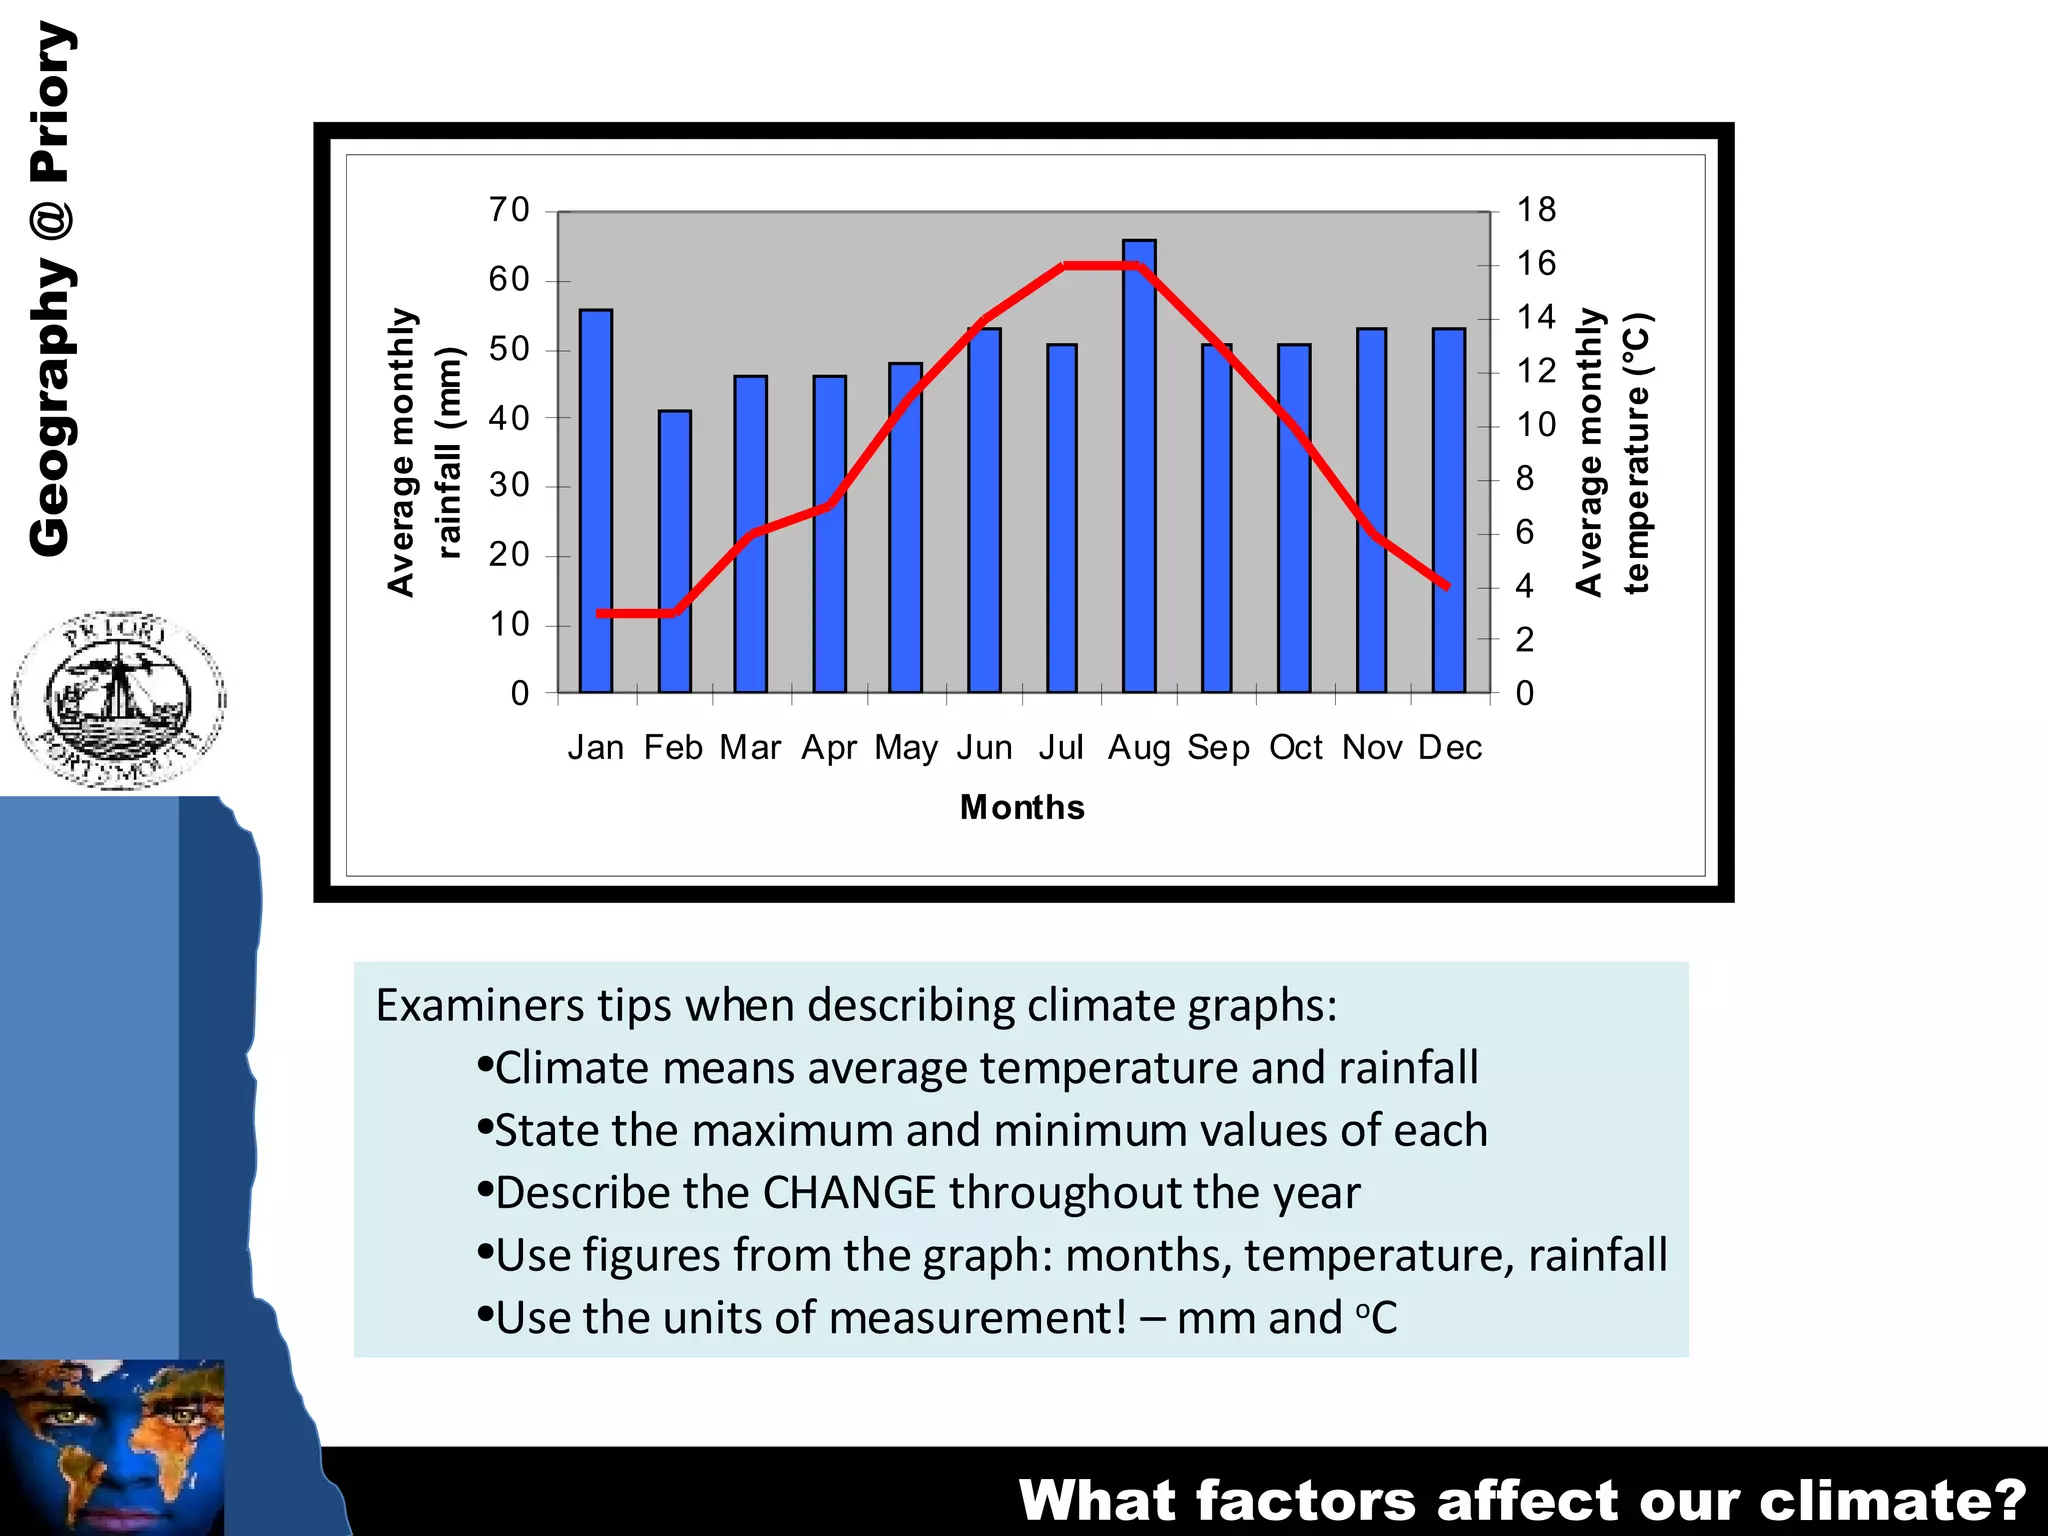


The document provides information about interpreting climate graphs and describes the climate of Leeds, England based on average monthly rainfall and temperature data. It discusses how to represent climate data in a graph with bars for rainfall and a line for temperature. The climate of Leeds is described as having an average annual rainfall of 653 mm, an average annual temperature of 9°C, and a temperature range of 13°C from January/February to July/August. Rainfall is highest in August at 66 mm and lowest in February at 41 mm, while temperatures are coldest in January/February at 3°C and warmest in July/August at 16°C.