SlideShare a Scribd company logo
4 November, 2014
Climate graphs and pressure systems
Starter:
1. What type of pressure is
affecting the UK?
2. Draw wind arrows on the
map.
3. Which airmass is
affecting southern
Britain?
4. What weather would we
expect with this airmass?
Explain the pattern shown on each map. Which factors affecting climate are visible? A LAD.
A
B
C D
Jan Feb Mar Apr May Jun Jul Aug Sep Oct Nov Dec
Average monthly
Rainfall (mm)
56 41 46 46 48 53 51 66 51 51 53 53
Average monthly
Temperature (°C)
3 3 6 7 11 14 16 16 13 10 6 4
The average temperature
in March is 6°C
The average rainfall in
September is 51 mm
1. Calculate the total annual rainfall?
2. Calculate the average annual temperature?
3. Calculate the temperature range?
The table below shows the climate data for Leeds.
Climate Graphs
Jan Feb Mar Apr May Jun Jul Aug Sep Oct Nov Dec
Average monthly Rainfall
(mm)
56 41 46 46 48 53 51 66 51 51 53 53
Average monthly
Temperature (°C)
3 3 6 7 11 14 16 16 13 10 6 4
But how do you represent the data above in the form of a graph?
0
10
20
30
40
50
60
70
Jan Feb Mar Apr May Jun Jul Aug Sep Oct Nov Dec
Months
Averagemonthly
rainfall(mm)
The blue bars
show average
rainfall
0
2
4
6
8
10
12
14
16
18
Jan Feb Mar Apr May Jun Jul Aug Sep Oct Nov Dec
Months
Averagemonthly
temperature(°C)
The red line is
the average
temperature
0
10
20
30
40
50
60
70
Jan Feb Mar Apr May Jun Jul Aug Sep Oct Nov Dec
Months
Averagemonthly
rainfall(mm)
0
2
4
6
8
10
12
14
16
18
Averagemonthly
temperature(°C)
0
10
20
30
40
50
60
70
Jan Feb Mar Apr May Jun Jul Aug Sep Oct Nov Dec
Months
Averagemonthly
rainfall(mm)
0
2
4
6
8
10
12
14
16
18
Averagemonthly
temperature(°C)
The maximum
rainfall is 66 mm
and the
minimum is 41
mm – a range of
25 mm.
The driest month
is February when
an average of 41
mm of rain falls.
The wettest
month is August
when an average
of 66 mm of rain
falls
The maximum
temperature is
16°C and the
minimum is 3°C –
a range of 13°C.
The coldest
months are
January and
February with an
average monthly
temperature of
3°C.
The temperature
peaks in July and
August with an
average of 16°C.
Interpreting a climate graph
Remember to describe the TRENDS, then minimum and maximum values.
Question 4: Describe the CLIMATE of Leeds
0
10
20
30
40
50
60
70
Jan Feb Mar Apr May Jun Jul Aug Sep Oct Nov Dec
Months
Averagemonthly
rainfall(mm)
0
2
4
6
8
10
12
14
16
18
Averagemonthly
temperature(°C)
Examiners tips when describing climate graphs:
•What is the total annual rainfall?
•Describe any wet and dry seasons.
•What is the annual temperature range?
•Is there a distinctive annual temperature pattern?
•State the maximum and minimum values of each
•Describe the CHANGE throughout the year. Don’t list.
•Use figures from the graph: months, temperature, rainfall
•Use the units of measurement! – mm and oC
•Describe the changes, don’t explain the reasons.
Jan Feb Mar Apr May Jun Jul Aug Sep Oct Nov Dec
Average monthly
Rainfall (mm)
56 41 46 46 48 53 51 66 51 51 53 53
Average monthly
Temperature (°C)
3 3 6 7 11 14 16 16 13 10 6 4
Task;
Draw your own Climate Graph
for London using the Data
provided.
Remember- you need to have
• twelve months along the
bottom
• mm on the left (precipitation)
• degrees c on the right
(temperature)
RULES-
• Choose one to do first – either
Precipitation OR Temperature
• Precipitation must be shown in
a bar graph
• Temperature must be shown in
a line graph – plot the points in
the centre of the month.
Extension;
what month
could this have
been in?
Extension- When you have done the
graph (including double checked it, and
stuck in), answer in your book;
•What is the temperature range – the
difference between the highest and
lowest temperature.
•What is the total annual rainfall – add
the precipitation figures up.
•What is the average temperature –
add the temperature figures up and
divide by 12.
Extension;
what month
could this have
been in? Extension;
what month
could this have
been in?
London Climate Graph
0
10
20
30
40
50
60
70
80
90
Jan Feb Mar Apr May Jun Jul Aug Sep Oct Nov Dec
Month
Precipmm
0
2
4
6
8
10
12
14
16
18
TempC
Precipitation mm
Temp C
It should look something like this!
Task- Describe the climate in London- what is it like there?
In London the climate is…………..
Plenary ; How well can you read climate graphs?
Work with your neighbour to match each graph to a place- On MWBs 1=? …
TOKYO; Here it rains a lot in
the summer but not so much in
winter. It is very humid in the
summer months but winter is
quite mild. I don’t normally get
to build snowmen!
TORONTO; We have cold
winters, it usually snows, but
our summers are lovely and
warm. You need to carry an
umbrella all year round though!
We have 4 distinct seasons.
MUMBAI; Here we enjoy a
tropical climate, its always
warm which is nice, but we do
have a monsoon seasons every
year which always causes
problems with flooding!
1
2
3
Savanna Climate
0
10
20
30
40
50
60
70
80
90
Jan Feb Mar Apr May Jun Jul Aug Sep Oct Nov Dec
Month
Precip
0
5
10
15
20
25
30
35
Degrees
mm
°C
Task- Can you describe the climate in the Savannah? Use full sentences, what
does the climate graph tell us?
Eg is it Hot/ Cold? Vary what months are the driest / wettest?
Extension- how is it different to London?
Pressure systems
• The UK has been affected by High Pressure for the past 3
weeks.
• Known as an anticyclone
Effects
summer
Effects
winter
What weather does high pressure bring?
An anticyclone is a weather system associated with ‘high pressure’
and are caused when cool air sinking to earth putting a lot of pressure
or weight on the earths surface is high. Anticyclones bring different
weather to the British Isles depending on whether it is Summer or
Winter but is always fine and settled. When an anticyclone is
established over our country it can remain in place for a long period of
time—often affecting the whole country but unfortunately anticyclones
are not that common!
Because the air is sinking it is unable to pick up moisture through
evaporation so rain rarely happens during an anticyclone! Winds are
very light and blow in an clockwise direction.
In the summer:
Anticyclones are often responsible for heatwaves in the summer as
they bring hot and sunny conditions to the country and then do not
move for several days.
Because there are very few clouds the days are warm and sunny but
the same clear skies make the nights very cold as the daytime heat
escapes straight back into the atmosphere.
In the winter:
Temperatures are very low because of the sun’s low angle in the sky
but it is, however, very sunny and there are still no clouds. These
cloudless skies allow any heat from the sun to escape back into the
atmosphere during the evening making the nights very cold and often
frosty. The difference between the temperatures during the day and
night see condensation at ground level and fogs are also common.

More Related Content

What's hot

Air Masses
Air MassesAir Masses
Air Masses
David Genis
 
Engineering hydrology lab manual
Engineering hydrology lab manualEngineering hydrology lab manual
Engineering hydrology lab manual
alibhatti89
 
Climate feedback loops
Climate feedback loops Climate feedback loops
Climate feedback loops
inventedges
 
How to draw a climate graph
How to draw a climate graphHow to draw a climate graph
How to draw a climate graph
clemaitre
 
Elements of surface hydrology by Akshay D Raut
Elements of surface hydrology by Akshay D RautElements of surface hydrology by Akshay D Raut
Elements of surface hydrology by Akshay D Raut
AkshayRaut51
 
Ch. 10 Gases
Ch. 10 GasesCh. 10 Gases
Ch. 10 Gases
ewalenta
 
Sea level change
Sea level changeSea level change
Sea level change
Steven Heath
 
Weather And Climate
Weather And ClimateWeather And Climate
Weather And Climate
jdmcd
 
Insolation, Atmospheric temperature and Heat Budget of the Earth-2-31.pdf
Insolation, Atmospheric temperature and Heat Budget of the Earth-2-31.pdfInsolation, Atmospheric temperature and Heat Budget of the Earth-2-31.pdf
Insolation, Atmospheric temperature and Heat Budget of the Earth-2-31.pdf
monsterroy098
 
Climate discuss 1
Climate discuss 1Climate discuss 1
Climate discuss 1
Makati Science High School
 
Seasons in Australia
Seasons in AustraliaSeasons in Australia
Seasons in Australia
Hana Naja
 
Precipitation And its forms
Precipitation And its formsPrecipitation And its forms
Precipitation And its forms
Ankita Paul
 
Laws of chemical combinations, prepared by Saliha Rais
Laws of chemical combinations, prepared by Saliha RaisLaws of chemical combinations, prepared by Saliha Rais
Laws of chemical combinations, prepared by Saliha Rais
Saliha Rais
 
Weather and climate
Weather and climateWeather and climate
Weather and climate
NMMP
 
de-Broglie equation.pdf
de-Broglie equation.pdfde-Broglie equation.pdf
de-Broglie equation.pdf
SaiKalyani11
 
Atmosphere & surface energy balance
Atmosphere & surface energy balanceAtmosphere & surface energy balance
Atmosphere & surface energy balance
Nagina Nighat
 
Dalton’s Atomic Model
Dalton’s Atomic ModelDalton’s Atomic Model
Dalton’s Atomic Model
Juan Miguel Palero
 
Milancovitch cycles
Milancovitch cyclesMilancovitch cycles
Milancovitch cycles
Lakshmi Sravani Chilukuri
 
atmospheric pressure of class 7
atmospheric pressure of class 7 atmospheric pressure of class 7
atmospheric pressure of class 7
KashishSingh43
 
Introduction to Weather
Introduction to WeatherIntroduction to Weather
Introduction to Weather
itutor
 

What's hot (20)

Air Masses
Air MassesAir Masses
Air Masses
 
Engineering hydrology lab manual
Engineering hydrology lab manualEngineering hydrology lab manual
Engineering hydrology lab manual
 
Climate feedback loops
Climate feedback loops Climate feedback loops
Climate feedback loops
 
How to draw a climate graph
How to draw a climate graphHow to draw a climate graph
How to draw a climate graph
 
Elements of surface hydrology by Akshay D Raut
Elements of surface hydrology by Akshay D RautElements of surface hydrology by Akshay D Raut
Elements of surface hydrology by Akshay D Raut
 
Ch. 10 Gases
Ch. 10 GasesCh. 10 Gases
Ch. 10 Gases
 
Sea level change
Sea level changeSea level change
Sea level change
 
Weather And Climate
Weather And ClimateWeather And Climate
Weather And Climate
 
Insolation, Atmospheric temperature and Heat Budget of the Earth-2-31.pdf
Insolation, Atmospheric temperature and Heat Budget of the Earth-2-31.pdfInsolation, Atmospheric temperature and Heat Budget of the Earth-2-31.pdf
Insolation, Atmospheric temperature and Heat Budget of the Earth-2-31.pdf
 
Climate discuss 1
Climate discuss 1Climate discuss 1
Climate discuss 1
 
Seasons in Australia
Seasons in AustraliaSeasons in Australia
Seasons in Australia
 
Precipitation And its forms
Precipitation And its formsPrecipitation And its forms
Precipitation And its forms
 
Laws of chemical combinations, prepared by Saliha Rais
Laws of chemical combinations, prepared by Saliha RaisLaws of chemical combinations, prepared by Saliha Rais
Laws of chemical combinations, prepared by Saliha Rais
 
Weather and climate
Weather and climateWeather and climate
Weather and climate
 
de-Broglie equation.pdf
de-Broglie equation.pdfde-Broglie equation.pdf
de-Broglie equation.pdf
 
Atmosphere & surface energy balance
Atmosphere & surface energy balanceAtmosphere & surface energy balance
Atmosphere & surface energy balance
 
Dalton’s Atomic Model
Dalton’s Atomic ModelDalton’s Atomic Model
Dalton’s Atomic Model
 
Milancovitch cycles
Milancovitch cyclesMilancovitch cycles
Milancovitch cycles
 
atmospheric pressure of class 7
atmospheric pressure of class 7 atmospheric pressure of class 7
atmospheric pressure of class 7
 
Introduction to Weather
Introduction to WeatherIntroduction to Weather
Introduction to Weather
 

Similar to Lesson 3 climate graphs and pressure

Factors Affecting Climate
Factors Affecting ClimateFactors Affecting Climate
Factors Affecting Climate
David Rogers
 
Weather & climate
Weather & climateWeather & climate
Weather & climate
Manav Gupta
 
3.-Weather-and-climate in great detail.pptx
3.-Weather-and-climate in great detail.pptx3.-Weather-and-climate in great detail.pptx
3.-Weather-and-climate in great detail.pptx
mihajlokarna1
 
weather and climate
weather and climateweather and climate
weather and climate
sylvia nothando
 
Weather & climate 1
Weather & climate   1Weather & climate   1
Weather & climate 1
pjb09138
 
The Seasons Of United Kingdom And India by Bhanu Yadav
The Seasons Of United Kingdom And India by Bhanu YadavThe Seasons Of United Kingdom And India by Bhanu Yadav
The Seasons Of United Kingdom And India by Bhanu Yadav
Bhanu Yadav
 
Weather and climate - 4th grade, San Antonio Texas Focus
Weather and climate - 4th grade, San Antonio Texas FocusWeather and climate - 4th grade, San Antonio Texas Focus
Weather and climate - 4th grade, San Antonio Texas Focus
Alexis Sullivan MA
 
Weather and climate_around_the_world_2
Weather and climate_around_the_world_2Weather and climate_around_the_world_2
Weather and climate_around_the_world_2
Jose Martínez Alcolea
 
7 Weather 2
7 Weather 27 Weather 2
7 Weather 2
WatHistory
 
Cliamte change en
Cliamte change enCliamte change en
Cliamte change en
nishava
 
705 - Weather Report
705 - Weather Report705 - Weather Report
705 - Weather Report
WatHistory
 
Climate and weather
Climate and weatherClimate and weather
Climate and weather
Marcos Rodríguez Ucedo
 
World Weather Types: Equatorial, Tropical, Desert, Mediterranean, Temperate a...
World Weather Types: Equatorial, Tropical, Desert, Mediterranean, Temperate a...World Weather Types: Equatorial, Tropical, Desert, Mediterranean, Temperate a...
World Weather Types: Equatorial, Tropical, Desert, Mediterranean, Temperate a...
Azad Uddin (Sojib Ahmed)
 
CLIMATE AND WEATHER.pptx
CLIMATE AND WEATHER.pptxCLIMATE AND WEATHER.pptx
CLIMATE AND WEATHER.pptx
MarcosRodriguezUcedo
 
Weather g2
Weather g2Weather g2
Weather g2
nermine_ghis
 
Understanding Weather
Understanding WeatherUnderstanding Weather
Understanding Weather
mlong24
 
Weather British Weather And Climate
Weather   British Weather And ClimateWeather   British Weather And Climate
Weather British Weather And Climate
john.payne
 
ICLR Forecast: 2019 Wildfire Season (May 17, 2019)
ICLR Forecast: 2019 Wildfire Season (May 17, 2019)ICLR Forecast: 2019 Wildfire Season (May 17, 2019)
ICLR Forecast: 2019 Wildfire Season (May 17, 2019)
glennmcgillivray
 
Weather elements unit 15
Weather elements unit 15Weather elements unit 15
Weather elements unit 15
MissST
 
Waether and Climate zones. Information on the climate
Waether and Climate zones. Information on the climateWaether and Climate zones. Information on the climate
Waether and Climate zones. Information on the climate
BilalKhan406166
 

Similar to Lesson 3 climate graphs and pressure (20)

Factors Affecting Climate
Factors Affecting ClimateFactors Affecting Climate
Factors Affecting Climate
 
Weather & climate
Weather & climateWeather & climate
Weather & climate
 
3.-Weather-and-climate in great detail.pptx
3.-Weather-and-climate in great detail.pptx3.-Weather-and-climate in great detail.pptx
3.-Weather-and-climate in great detail.pptx
 
weather and climate
weather and climateweather and climate
weather and climate
 
Weather & climate 1
Weather & climate   1Weather & climate   1
Weather & climate 1
 
The Seasons Of United Kingdom And India by Bhanu Yadav
The Seasons Of United Kingdom And India by Bhanu YadavThe Seasons Of United Kingdom And India by Bhanu Yadav
The Seasons Of United Kingdom And India by Bhanu Yadav
 
Weather and climate - 4th grade, San Antonio Texas Focus
Weather and climate - 4th grade, San Antonio Texas FocusWeather and climate - 4th grade, San Antonio Texas Focus
Weather and climate - 4th grade, San Antonio Texas Focus
 
Weather and climate_around_the_world_2
Weather and climate_around_the_world_2Weather and climate_around_the_world_2
Weather and climate_around_the_world_2
 
7 Weather 2
7 Weather 27 Weather 2
7 Weather 2
 
Cliamte change en
Cliamte change enCliamte change en
Cliamte change en
 
705 - Weather Report
705 - Weather Report705 - Weather Report
705 - Weather Report
 
Climate and weather
Climate and weatherClimate and weather
Climate and weather
 
World Weather Types: Equatorial, Tropical, Desert, Mediterranean, Temperate a...
World Weather Types: Equatorial, Tropical, Desert, Mediterranean, Temperate a...World Weather Types: Equatorial, Tropical, Desert, Mediterranean, Temperate a...
World Weather Types: Equatorial, Tropical, Desert, Mediterranean, Temperate a...
 
CLIMATE AND WEATHER.pptx
CLIMATE AND WEATHER.pptxCLIMATE AND WEATHER.pptx
CLIMATE AND WEATHER.pptx
 
Weather g2
Weather g2Weather g2
Weather g2
 
Understanding Weather
Understanding WeatherUnderstanding Weather
Understanding Weather
 
Weather British Weather And Climate
Weather   British Weather And ClimateWeather   British Weather And Climate
Weather British Weather And Climate
 
ICLR Forecast: 2019 Wildfire Season (May 17, 2019)
ICLR Forecast: 2019 Wildfire Season (May 17, 2019)ICLR Forecast: 2019 Wildfire Season (May 17, 2019)
ICLR Forecast: 2019 Wildfire Season (May 17, 2019)
 
Weather elements unit 15
Weather elements unit 15Weather elements unit 15
Weather elements unit 15
 
Waether and Climate zones. Information on the climate
Waether and Climate zones. Information on the climateWaether and Climate zones. Information on the climate
Waether and Climate zones. Information on the climate
 

More from David Rogers

Getting to grips with enquiry 2018 slideshare
Getting to grips with enquiry 2018 slideshareGetting to grips with enquiry 2018 slideshare
Getting to grips with enquiry 2018 slideshare
David Rogers
 
Staff room notices - helping to establish an evidence informed culture
Staff room notices - helping to establish an evidence informed cultureStaff room notices - helping to establish an evidence informed culture
Staff room notices - helping to establish an evidence informed culture
David Rogers
 
Expect Excellence
Expect ExcellenceExpect Excellence
Expect Excellence
David Rogers
 
#GrowingGrit: Developing Qualities and Qualifications
#GrowingGrit: Developing Qualities and Qualifications#GrowingGrit: Developing Qualities and Qualifications
#GrowingGrit: Developing Qualities and Qualifications
David Rogers
 
Developing a primary secondary fieldwork collaboration
Developing a primary secondary fieldwork collaborationDeveloping a primary secondary fieldwork collaboration
Developing a primary secondary fieldwork collaboration
David Rogers
 
Assembly around learning
Assembly around learningAssembly around learning
Assembly around learning
David Rogers
 
PHS Leadership Development
PHS Leadership DevelopmentPHS Leadership Development
PHS Leadership Development
David Rogers
 
Making the mundane memorable
Making the mundane memorableMaking the mundane memorable
Making the mundane memorable
David Rogers
 
Data around Grit and Outcomes
Data around Grit and OutcomesData around Grit and Outcomes
Data around Grit and Outcomes
David Rogers
 
Is there a link between extra curricular clubs and attendance
Is there a link between extra curricular clubs and attendanceIs there a link between extra curricular clubs and attendance
Is there a link between extra curricular clubs and attendance
David Rogers
 
Developing better answers
Developing better answersDeveloping better answers
Developing better answers
David Rogers
 
What is life like in favelas?
What is life like in favelas?What is life like in favelas?
What is life like in favelas?
David Rogers
 
Paper 1 case studies WJEC Geog B GCSE
Paper 1 case studies WJEC Geog B GCSEPaper 1 case studies WJEC Geog B GCSE
Paper 1 case studies WJEC Geog B GCSE
David Rogers
 
Making connections between primary and secondary classrooms
Making connections between primary and secondary classroomsMaking connections between primary and secondary classrooms
Making connections between primary and secondary classrooms
David Rogers
 
Making connection between homebuilding, politics and migration
Making connection between homebuilding, politics and migrationMaking connection between homebuilding, politics and migration
Making connection between homebuilding, politics and migration
David Rogers
 
GRIT assembly Jan 2016
GRIT assembly Jan 2016GRIT assembly Jan 2016
GRIT assembly Jan 2016
David Rogers
 
Teacher Standard 5 - Adapting teaching for all learners
Teacher Standard 5 - Adapting teaching for all learnersTeacher Standard 5 - Adapting teaching for all learners
Teacher Standard 5 - Adapting teaching for all learners
David Rogers
 
2016 GCSE Geography Fieldwork
2016 GCSE Geography Fieldwork2016 GCSE Geography Fieldwork
2016 GCSE Geography Fieldwork
David Rogers
 
Aung san house assembly 15th october
Aung san house assembly 15th octoberAung san house assembly 15th october
Aung san house assembly 15th october
David Rogers
 
Mark scheme for the geographical enquiry
Mark scheme for the geographical enquiryMark scheme for the geographical enquiry
Mark scheme for the geographical enquiry
David Rogers
 

More from David Rogers (20)

Getting to grips with enquiry 2018 slideshare
Getting to grips with enquiry 2018 slideshareGetting to grips with enquiry 2018 slideshare
Getting to grips with enquiry 2018 slideshare
 
Staff room notices - helping to establish an evidence informed culture
Staff room notices - helping to establish an evidence informed cultureStaff room notices - helping to establish an evidence informed culture
Staff room notices - helping to establish an evidence informed culture
 
Expect Excellence
Expect ExcellenceExpect Excellence
Expect Excellence
 
#GrowingGrit: Developing Qualities and Qualifications
#GrowingGrit: Developing Qualities and Qualifications#GrowingGrit: Developing Qualities and Qualifications
#GrowingGrit: Developing Qualities and Qualifications
 
Developing a primary secondary fieldwork collaboration
Developing a primary secondary fieldwork collaborationDeveloping a primary secondary fieldwork collaboration
Developing a primary secondary fieldwork collaboration
 
Assembly around learning
Assembly around learningAssembly around learning
Assembly around learning
 
PHS Leadership Development
PHS Leadership DevelopmentPHS Leadership Development
PHS Leadership Development
 
Making the mundane memorable
Making the mundane memorableMaking the mundane memorable
Making the mundane memorable
 
Data around Grit and Outcomes
Data around Grit and OutcomesData around Grit and Outcomes
Data around Grit and Outcomes
 
Is there a link between extra curricular clubs and attendance
Is there a link between extra curricular clubs and attendanceIs there a link between extra curricular clubs and attendance
Is there a link between extra curricular clubs and attendance
 
Developing better answers
Developing better answersDeveloping better answers
Developing better answers
 
What is life like in favelas?
What is life like in favelas?What is life like in favelas?
What is life like in favelas?
 
Paper 1 case studies WJEC Geog B GCSE
Paper 1 case studies WJEC Geog B GCSEPaper 1 case studies WJEC Geog B GCSE
Paper 1 case studies WJEC Geog B GCSE
 
Making connections between primary and secondary classrooms
Making connections between primary and secondary classroomsMaking connections between primary and secondary classrooms
Making connections between primary and secondary classrooms
 
Making connection between homebuilding, politics and migration
Making connection between homebuilding, politics and migrationMaking connection between homebuilding, politics and migration
Making connection between homebuilding, politics and migration
 
GRIT assembly Jan 2016
GRIT assembly Jan 2016GRIT assembly Jan 2016
GRIT assembly Jan 2016
 
Teacher Standard 5 - Adapting teaching for all learners
Teacher Standard 5 - Adapting teaching for all learnersTeacher Standard 5 - Adapting teaching for all learners
Teacher Standard 5 - Adapting teaching for all learners
 
2016 GCSE Geography Fieldwork
2016 GCSE Geography Fieldwork2016 GCSE Geography Fieldwork
2016 GCSE Geography Fieldwork
 
Aung san house assembly 15th october
Aung san house assembly 15th octoberAung san house assembly 15th october
Aung san house assembly 15th october
 
Mark scheme for the geographical enquiry
Mark scheme for the geographical enquiryMark scheme for the geographical enquiry
Mark scheme for the geographical enquiry
 

Lesson 3 climate graphs and pressure

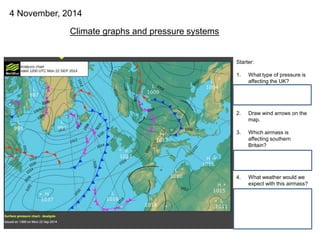
  • 1. 4 November, 2014 Climate graphs and pressure systems Starter: 1. What type of pressure is affecting the UK? 2. Draw wind arrows on the map. 3. Which airmass is affecting southern Britain? 4. What weather would we expect with this airmass?
  • 2.
  • 3. Explain the pattern shown on each map. Which factors affecting climate are visible? A LAD. A B C D
  • 4. Jan Feb Mar Apr May Jun Jul Aug Sep Oct Nov Dec Average monthly Rainfall (mm) 56 41 46 46 48 53 51 66 51 51 53 53 Average monthly Temperature (°C) 3 3 6 7 11 14 16 16 13 10 6 4 The average temperature in March is 6°C The average rainfall in September is 51 mm 1. Calculate the total annual rainfall? 2. Calculate the average annual temperature? 3. Calculate the temperature range? The table below shows the climate data for Leeds. Climate Graphs
  • 5. Jan Feb Mar Apr May Jun Jul Aug Sep Oct Nov Dec Average monthly Rainfall (mm) 56 41 46 46 48 53 51 66 51 51 53 53 Average monthly Temperature (°C) 3 3 6 7 11 14 16 16 13 10 6 4 But how do you represent the data above in the form of a graph? 0 10 20 30 40 50 60 70 Jan Feb Mar Apr May Jun Jul Aug Sep Oct Nov Dec Months Averagemonthly rainfall(mm) The blue bars show average rainfall 0 2 4 6 8 10 12 14 16 18 Jan Feb Mar Apr May Jun Jul Aug Sep Oct Nov Dec Months Averagemonthly temperature(°C) The red line is the average temperature 0 10 20 30 40 50 60 70 Jan Feb Mar Apr May Jun Jul Aug Sep Oct Nov Dec Months Averagemonthly rainfall(mm) 0 2 4 6 8 10 12 14 16 18 Averagemonthly temperature(°C)
  • 6. 0 10 20 30 40 50 60 70 Jan Feb Mar Apr May Jun Jul Aug Sep Oct Nov Dec Months Averagemonthly rainfall(mm) 0 2 4 6 8 10 12 14 16 18 Averagemonthly temperature(°C) The maximum rainfall is 66 mm and the minimum is 41 mm – a range of 25 mm. The driest month is February when an average of 41 mm of rain falls. The wettest month is August when an average of 66 mm of rain falls The maximum temperature is 16°C and the minimum is 3°C – a range of 13°C. The coldest months are January and February with an average monthly temperature of 3°C. The temperature peaks in July and August with an average of 16°C. Interpreting a climate graph Remember to describe the TRENDS, then minimum and maximum values. Question 4: Describe the CLIMATE of Leeds
  • 7. 0 10 20 30 40 50 60 70 Jan Feb Mar Apr May Jun Jul Aug Sep Oct Nov Dec Months Averagemonthly rainfall(mm) 0 2 4 6 8 10 12 14 16 18 Averagemonthly temperature(°C) Examiners tips when describing climate graphs: •What is the total annual rainfall? •Describe any wet and dry seasons. •What is the annual temperature range? •Is there a distinctive annual temperature pattern? •State the maximum and minimum values of each •Describe the CHANGE throughout the year. Don’t list. •Use figures from the graph: months, temperature, rainfall •Use the units of measurement! – mm and oC •Describe the changes, don’t explain the reasons. Jan Feb Mar Apr May Jun Jul Aug Sep Oct Nov Dec Average monthly Rainfall (mm) 56 41 46 46 48 53 51 66 51 51 53 53 Average monthly Temperature (°C) 3 3 6 7 11 14 16 16 13 10 6 4
  • 8. Task; Draw your own Climate Graph for London using the Data provided. Remember- you need to have • twelve months along the bottom • mm on the left (precipitation) • degrees c on the right (temperature) RULES- • Choose one to do first – either Precipitation OR Temperature • Precipitation must be shown in a bar graph • Temperature must be shown in a line graph – plot the points in the centre of the month. Extension; what month could this have been in?
  • 9. Extension- When you have done the graph (including double checked it, and stuck in), answer in your book; •What is the temperature range – the difference between the highest and lowest temperature. •What is the total annual rainfall – add the precipitation figures up. •What is the average temperature – add the temperature figures up and divide by 12. Extension; what month could this have been in? Extension; what month could this have been in?
  • 10. London Climate Graph 0 10 20 30 40 50 60 70 80 90 Jan Feb Mar Apr May Jun Jul Aug Sep Oct Nov Dec Month Precipmm 0 2 4 6 8 10 12 14 16 18 TempC Precipitation mm Temp C It should look something like this! Task- Describe the climate in London- what is it like there? In London the climate is…………..
  • 11. Plenary ; How well can you read climate graphs? Work with your neighbour to match each graph to a place- On MWBs 1=? … TOKYO; Here it rains a lot in the summer but not so much in winter. It is very humid in the summer months but winter is quite mild. I don’t normally get to build snowmen! TORONTO; We have cold winters, it usually snows, but our summers are lovely and warm. You need to carry an umbrella all year round though! We have 4 distinct seasons. MUMBAI; Here we enjoy a tropical climate, its always warm which is nice, but we do have a monsoon seasons every year which always causes problems with flooding! 1 2 3
  • 12. Savanna Climate 0 10 20 30 40 50 60 70 80 90 Jan Feb Mar Apr May Jun Jul Aug Sep Oct Nov Dec Month Precip 0 5 10 15 20 25 30 35 Degrees mm °C Task- Can you describe the climate in the Savannah? Use full sentences, what does the climate graph tell us? Eg is it Hot/ Cold? Vary what months are the driest / wettest? Extension- how is it different to London?
  • 13. Pressure systems • The UK has been affected by High Pressure for the past 3 weeks. • Known as an anticyclone Effects summer Effects winter
  • 14. What weather does high pressure bring? An anticyclone is a weather system associated with ‘high pressure’ and are caused when cool air sinking to earth putting a lot of pressure or weight on the earths surface is high. Anticyclones bring different weather to the British Isles depending on whether it is Summer or Winter but is always fine and settled. When an anticyclone is established over our country it can remain in place for a long period of time—often affecting the whole country but unfortunately anticyclones are not that common! Because the air is sinking it is unable to pick up moisture through evaporation so rain rarely happens during an anticyclone! Winds are very light and blow in an clockwise direction. In the summer: Anticyclones are often responsible for heatwaves in the summer as they bring hot and sunny conditions to the country and then do not move for several days. Because there are very few clouds the days are warm and sunny but the same clear skies make the nights very cold as the daytime heat escapes straight back into the atmosphere. In the winter: Temperatures are very low because of the sun’s low angle in the sky but it is, however, very sunny and there are still no clouds. These cloudless skies allow any heat from the sun to escape back into the atmosphere during the evening making the nights very cold and often frosty. The difference between the temperatures during the day and night see condensation at ground level and fogs are also common.

Editor's Notes

  1. http://www.bbc.co.uk/weather/2654710
  2. https://www.gov.uk/government/news/heatwave-on-the-way