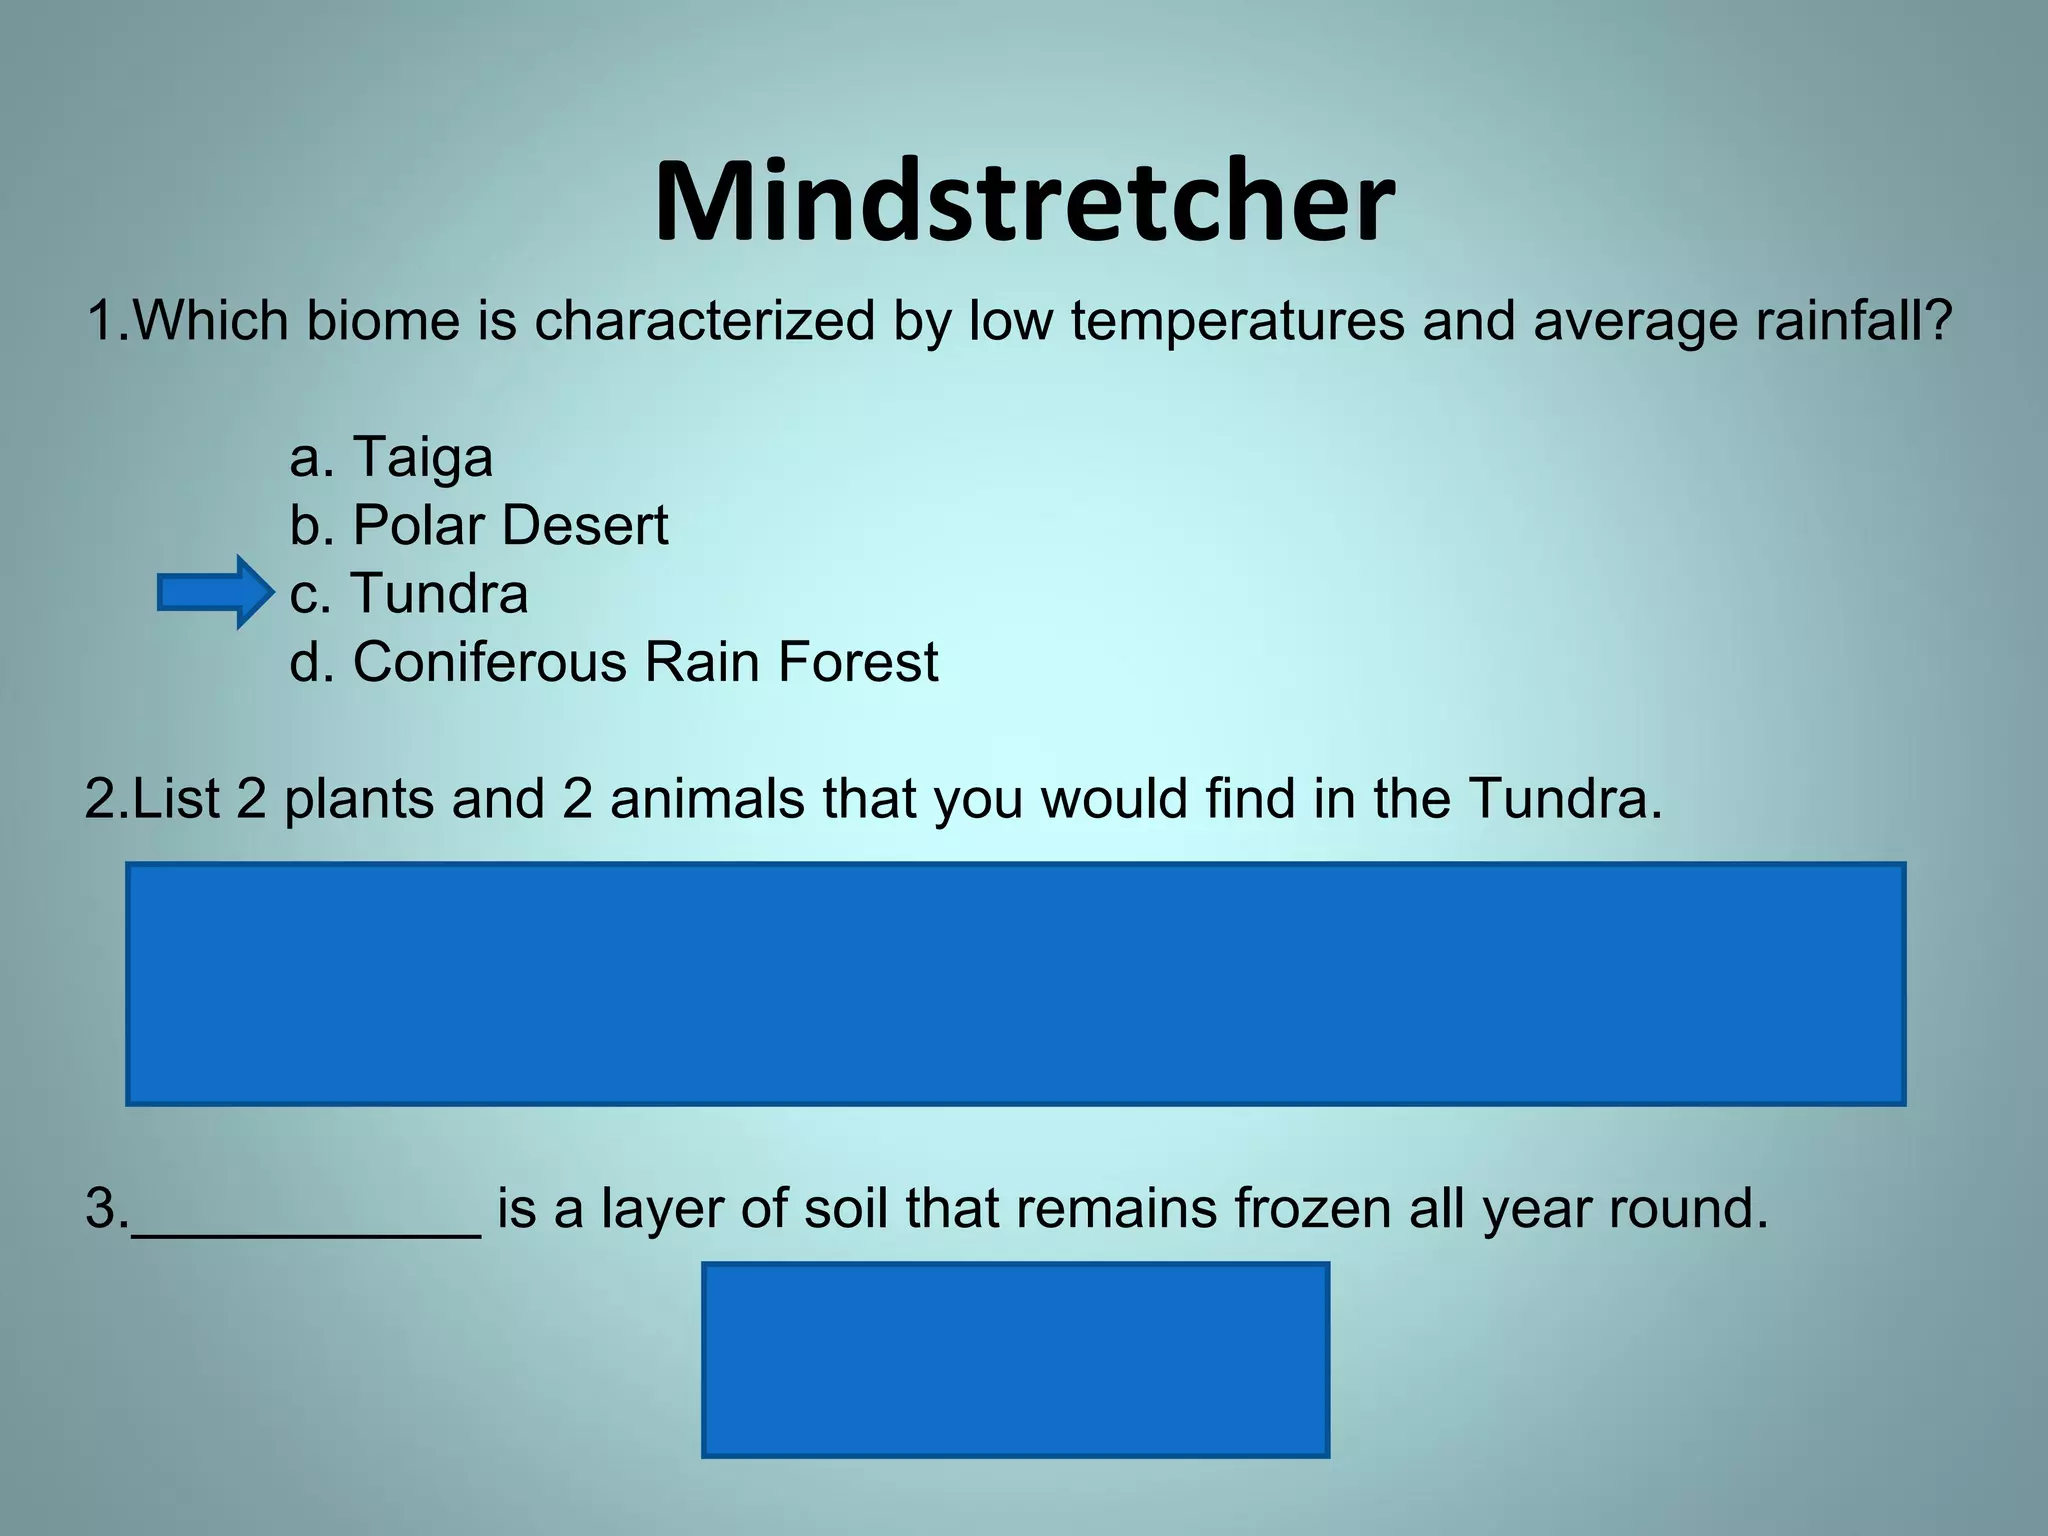
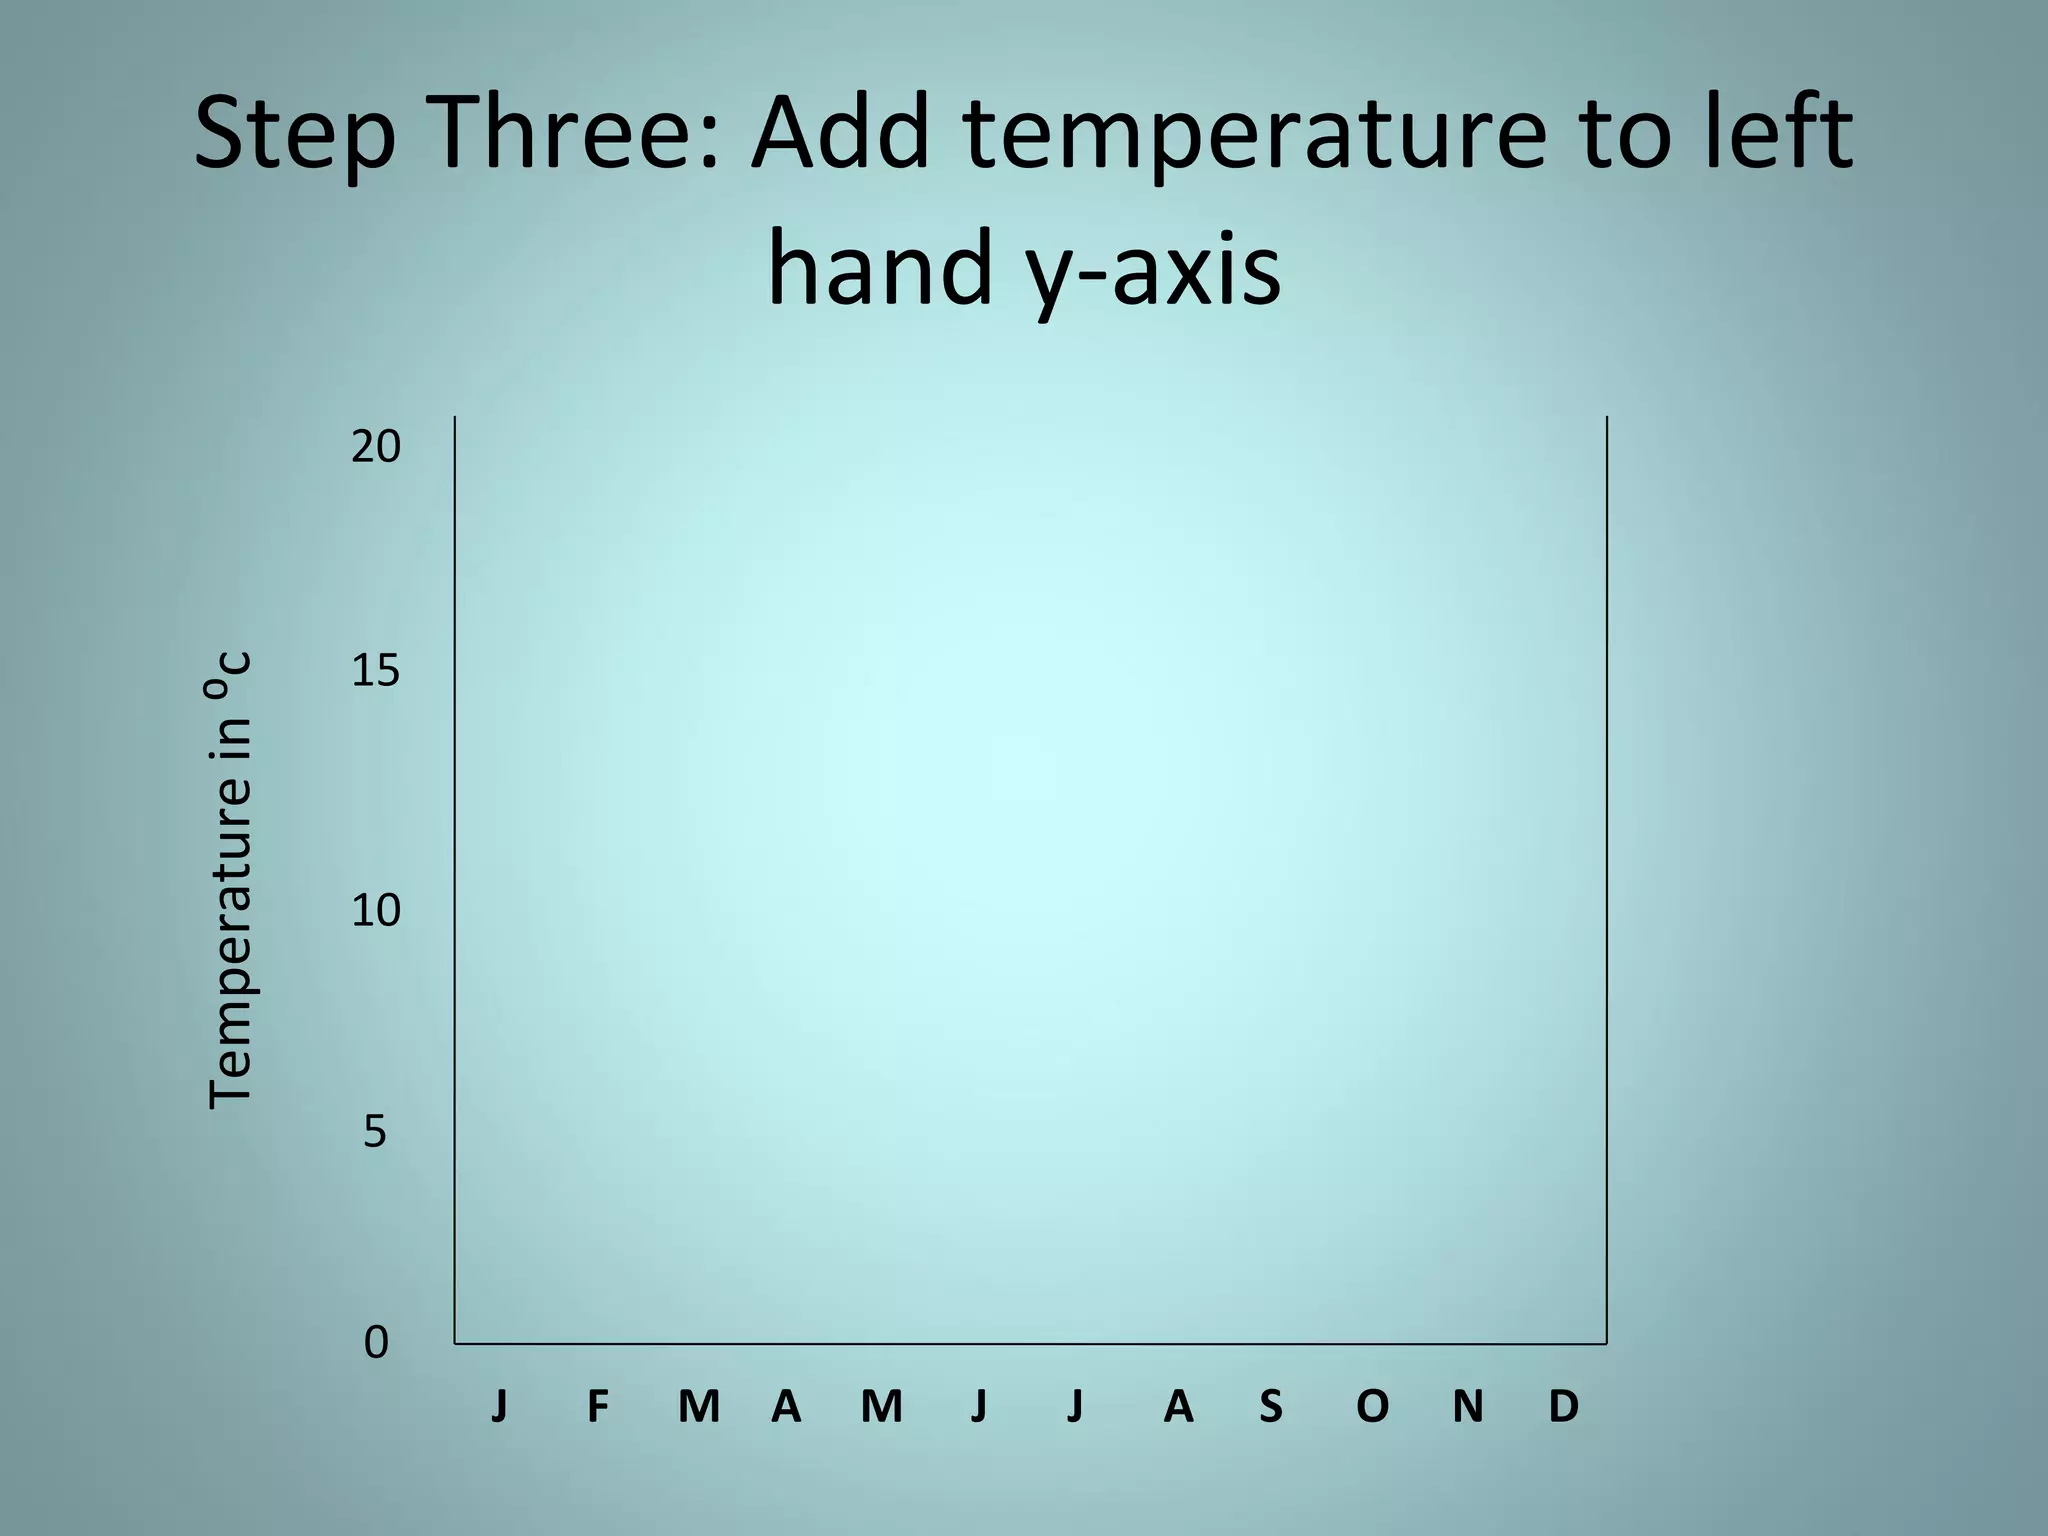
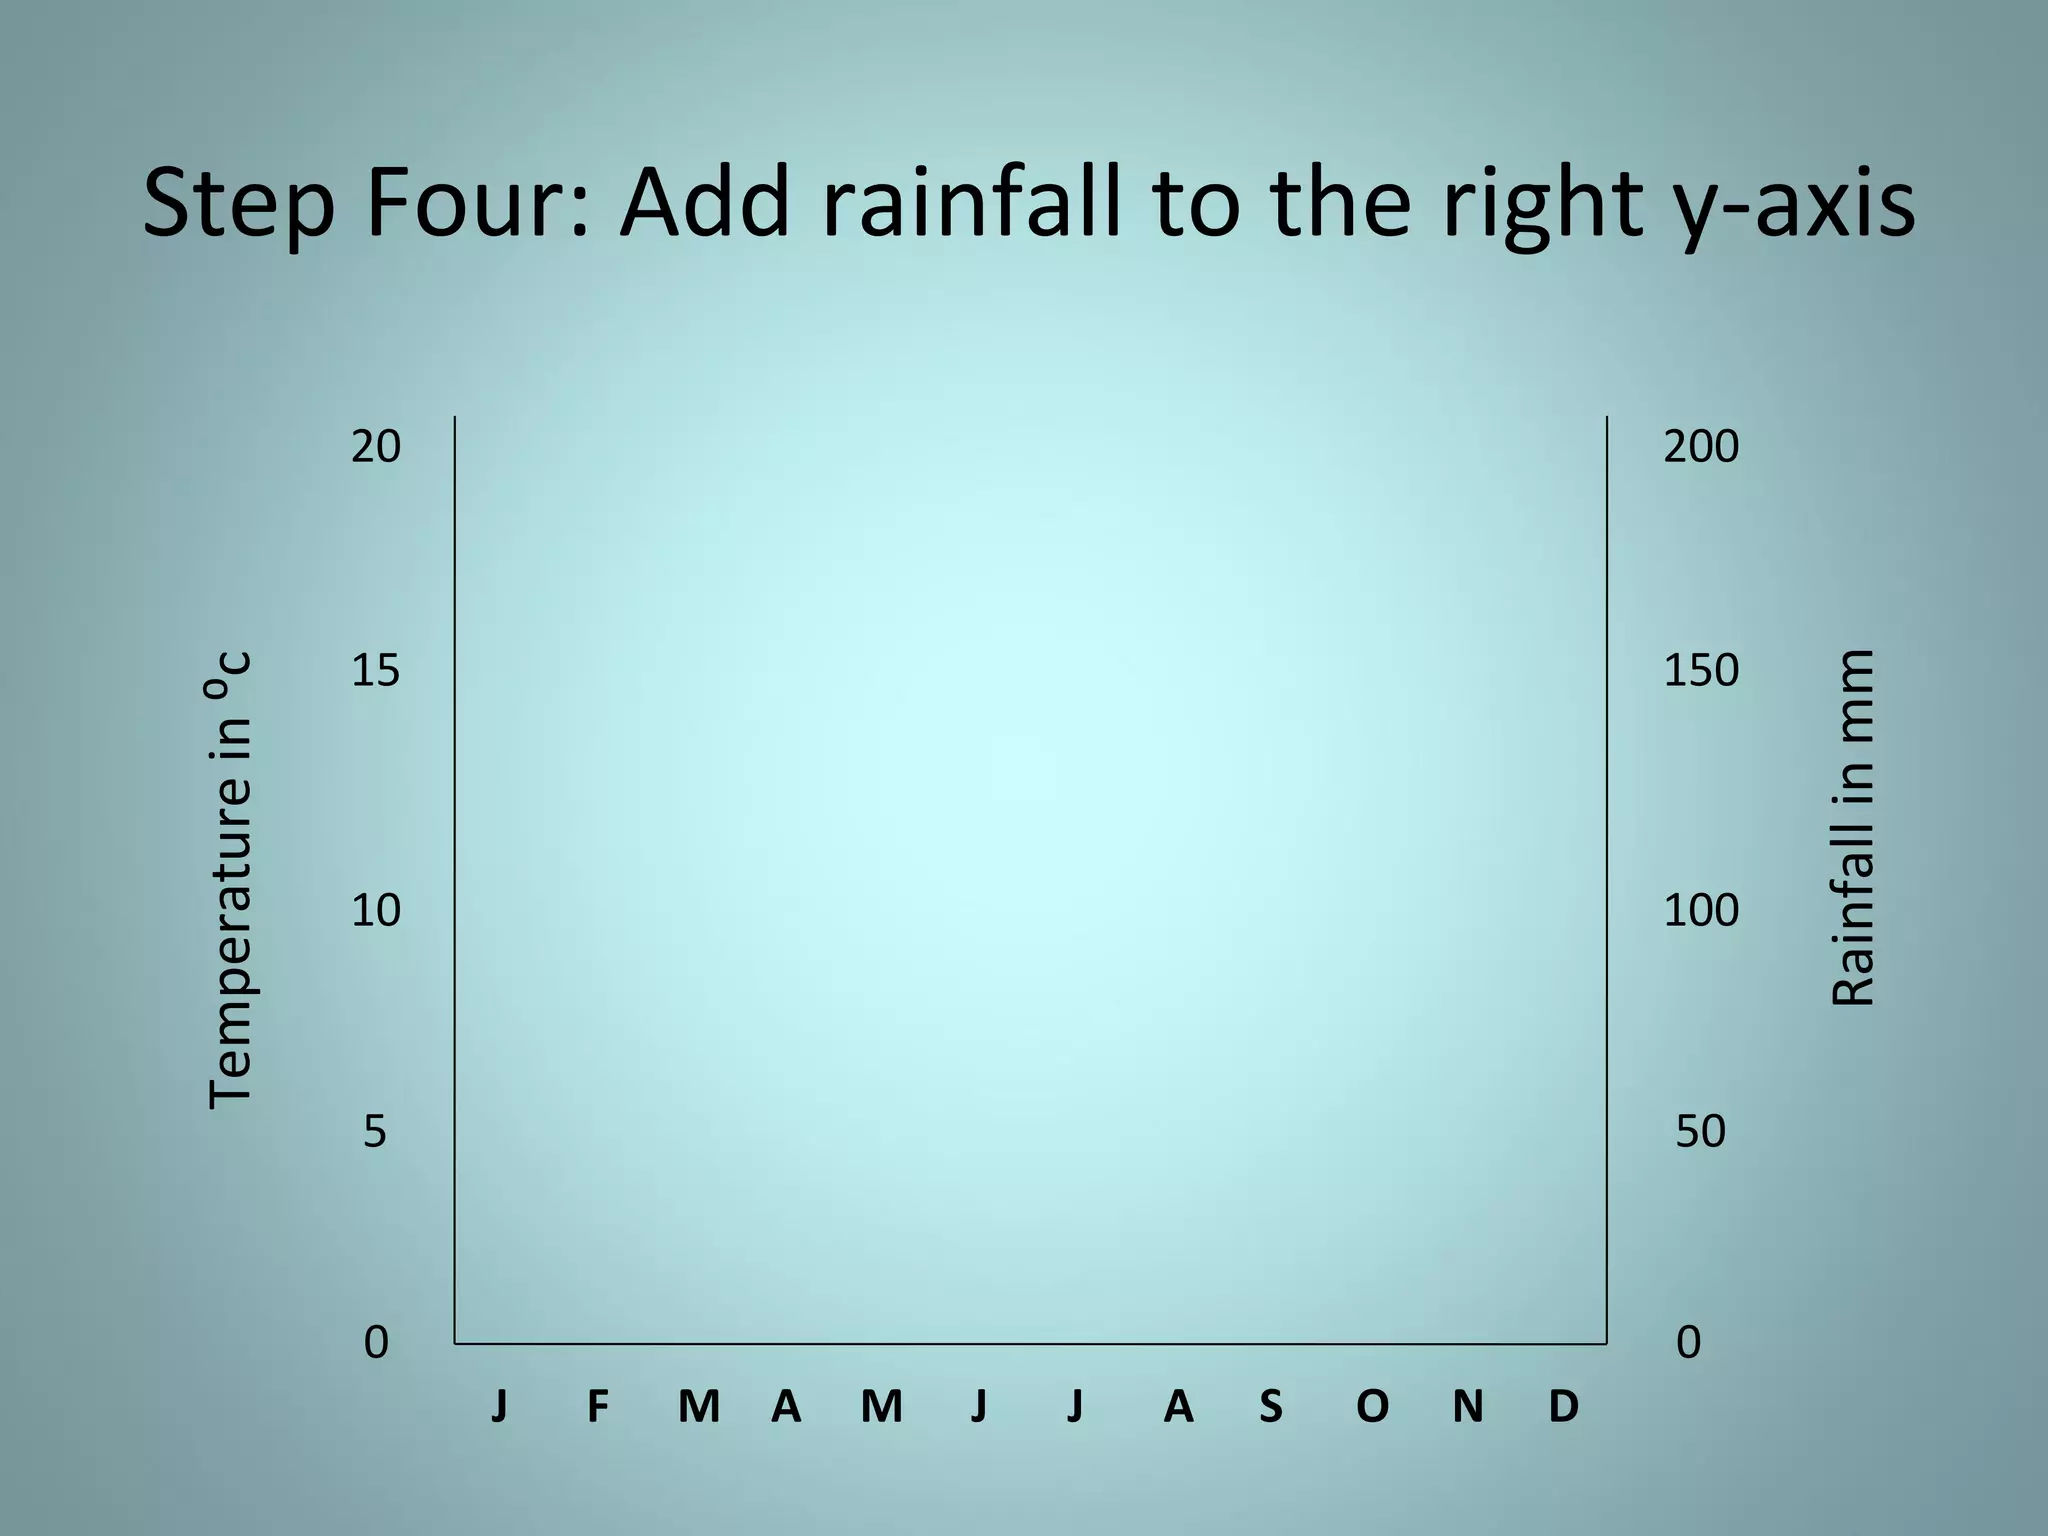
Mindstretcher 1.Which biome is characterized by low temperatures and average rainfall? a. Taiga b. Polar Desert c. Tundra d. Coniferous Rain Forest 2.List 2 plants and 2 animals that you would find in the Tundra.  Plants: Grasses, shrubs, mosses, lichens Animals: Snow Geese, Musk Oxen, Wolves, Caribou, Mosquitoes 3.___________ is a layer of soil that remains frozen all year round.  PERMAFROST
How to create a climate graph?
Step One: Draw a three axis graph
Step Two: Add months to x-axis J F M A M J J A S O N D
Step Three: Add temperature to left hand y-axis J F M A M J J A S O N D 5 10 15 20 0 Temperature in ⁰c
Step Four: Add rainfall to the right y-axis J F M A M J J A S O N D 5 10 15 20 0 Temperature in ⁰c 50 100 150 200 0 Rainfall in mm
Now you’re ready to add the data! (You do need to look at your data before to work out what size your axis need to be!)
Step Five: Add your rainfall data J F M A M J J A S O N D 5 10 15 20 0 Temperature in ⁰c 50 100 150 200 0 Rainfall in mm Jan 55mm Feb 90mm
Step Six: Add the temperature line J F M A M J J A S O N D 5 10 15 20 0 Temperature in ⁰c 50 100 150 200 0 Rainfall in mm Jan 16⁰c Feb 14⁰c
YOUR CIMATE GRAPH IS FINISHED!!! WELL DONE!

How to create a climate graph

  • 1.
    Mindstretcher 1.Which biomeis characterized by low temperatures and average rainfall? a. Taiga b. Polar Desert c. Tundra d. Coniferous Rain Forest 2.List 2 plants and 2 animals that you would find in the Tundra. Plants: Grasses, shrubs, mosses, lichens Animals: Snow Geese, Musk Oxen, Wolves, Caribou, Mosquitoes 3.___________ is a layer of soil that remains frozen all year round. PERMAFROST
  • 2.
    How to createa climate graph?
  • 3.
    Step One: Drawa three axis graph
  • 4.
    Step Two: Addmonths to x-axis J F M A M J J A S O N D
  • 5.
    Step Three: Addtemperature to left hand y-axis J F M A M J J A S O N D 5 10 15 20 0 Temperature in ⁰c
  • 6.
    Step Four: Addrainfall to the right y-axis J F M A M J J A S O N D 5 10 15 20 0 Temperature in ⁰c 50 100 150 200 0 Rainfall in mm
  • 7.
    Now you’re readyto add the data! (You do need to look at your data before to work out what size your axis need to be!)
  • 8.
    Step Five: Addyour rainfall data J F M A M J J A S O N D 5 10 15 20 0 Temperature in ⁰c 50 100 150 200 0 Rainfall in mm Jan 55mm Feb 90mm
  • 9.
    Step Six: Addthe temperature line J F M A M J J A S O N D 5 10 15 20 0 Temperature in ⁰c 50 100 150 200 0 Rainfall in mm Jan 16⁰c Feb 14⁰c
  • 10.
    YOUR CIMATE GRAPHIS FINISHED!!! WELL DONE!