The document will enable the reader to have a better understanding on the different ways of progress measurement and help decide an individual the reporting type that is beneficial for them.
Abstract— Execution of engineering projects are tracked against critical metrics such as safety, quality,
delivery cost and inventory. Earned value is a key parameter that helps in assessing delivery (schedule) and cost.
Static shows that 70% of projects are over budget behind schedule, 52% of all projects finish at 189% of their
initial budget and some, after huge investments of time and money, are simply never completed. The rest of this
paper gives a perspective on monitoring project health by Earned value analysis.
Using primavera to calculate the forward pass and backward pass dates of a project.
There are various ways to calculate the late start and late finish dates of a project.
Assessing the general health of a project and establishing an early warning system for unexpected problems, starts by measuring the Physical Percent Complete of the project’s deliverables.
An update on new developments in the Executive Briefing Service for ConnectWise, and onsite reporting service which include free custom report development as part of the monthly subscription.
en este proyecto se utilizará el uso de algunas tics en relación a contribuir al desarrollo y fomento de buenos hábitos alimenticios que son indispensables para una vida saludable enfocando y enfatizando que es desde pequeños que debemos inculcar este tipo de conocimientos en los niños que serán los más beneficiados con este tipo de información que contribuya y prevenga la adquisión de enfermedades a temprana edad.
Earned schedule role in performance reporting and other important delay indicators.
Video: https://www.youtube.com/watch?v=FbA6RWB1gDM&feature=youtu.be
The full course: https://www.luqmanacademy.com/course?course=project-control-using-evm_399sl6015424f8aba9
Video: https://twitter.com/magedkom/status/1354678096683618305?s=20
The integrated master plan and integrated master scheduleGlen Alleman
The Integrated Master Plan (IMP) and Integrated Master Schedule( (IMS) provide a strategy for the incremental delivery of program outcomes through increasing maturity assessments with Measures of Effectiveness, Measures of Performance, Technical Performance Measures, and Key Performance Parameters.
These assessment assure the needed capabilities of the project are met at each assessment point to confirm physical percent complete as planned in the Integrated Master Plan
INFORMATION SYTEMS 3
Part-3: Mr. and Mrs. Rodgers House (House construction)
BUDGET AND RISK MANAGEMENT
1.0.
Overall Project Budget
A technique called Earned Value Management (EVM) compares project performance to the project baseline (Xu et al., 2018). All project managers pursuing Project Management Professional (PMP) certification learn and memorize the earned value calculations. Their application in real life is patchy, though. According to Insight, EVM is among the "critical few" best areas of practice for keeping track of a project's progress from both a schedule and cost standpoint (Vasyunina, 2017). The binary way of thinking about projects is widespread:
· On time versus late
· Over budget versus under budget.
On the project cost, both performance evaluation elements have a significant impact (Chang et al., 2022). If our costs are lower yet we are running late, EVM provides excellent facts of the matter.
Determining Earned Value
Computing EV involves:
· The sum of the up-to-date project budget, known as the planned value (PV)
· Current costs are identical to Actual Cost (AC).
· The project budget is multiplied by the proportion of execution to determine earned value (EV).
Now that we have these numbers, we can start making some computations of:
Schedule Performance Index (SPI) = EV/PV
SPI contrasts actual and anticipated progress. Whenever the SPI value had been than 1.0, fewer tasks were completed than expected. SPI > 1.0 denotes the completion of more work than anticipated.
Determining the CPI:
CPI= AC÷EV
The CPI evaluates the worth of finished work in relation to its true cost. Its score of 1.0 denotes high costs than anticipated. A CPI of greater than one shows that costs remained lower than expected.
For the SPI and CPI, >1 is favorable while 1 is unfavorable.
Remember that;
Subtracting instead of dividing allows you to rapidly determine the difference between the project budget and the timeline. Schedule variance (SV) equals EV-PV, whereas cost variance = EV-AC. You can easily execute the subtraction operation in your head, and in this case, >0 is favorable to 0 in this situation.
Except in the case of SPI or CPI, deviation is reliant on the project's scope. Therefore, we cannot compare it across construction project or across time effectively, as the budget might have changed.
Calculating the Project EAC:
CPI = EAC ÷ Overall Budget
EAC represents the prediction aggregate cost.
In summary:
· Project is halfway to its completion,
· PV = $55,000
· AC= $45,000
The calculations are as follows:
EV=100,000 ×1/2
=$50,000
SV =EV-PV
Where EV=50,000 and PV=55,000
Therefore, SP= 50,000-55,000
=-$5000
In this case, the value of SP is -$5,000, which is unfavorable for our project because it is less than 0.
SPI = EV/PV
Thus;
SP1=50,000 ÷55,000
= $0.91
However, the SPI value is less than.
project control using earned value analysis - Part 01 waleed hamdy
Project control using earned value analysis - Part 01
Mission of the projects control division
Why the earned value management?
Establishment of the Performance Measurement Baseline
EVM Analysis & Forecasting
Building the Integrated Master Plan (and its Integrated Master Schedule) is a critical success factor in any project domain. It describes the increasing maturity of all deliverables in units of measure meaningful to the decision makers.
The IMP contains the Measures of Effectiveness and Measures of Performance. The IMS contains the Technical Performance Measures (as exit criteria for the Work Packages).
Risk and estimates are applied at all levels of the IMP and IMS, then definitized in the Performance Measurement Baseline on contract
This white paper covers a new approach to tracking project performance which identifies variance gaps between the baseline plan and actual performance for the project as a whole as well as specific deliverables, contractors, locations, or any other group of activities.
Managing Changes on a Capital Programme by "Iain Cameron - Technical Director...Project Controls Expo
Managing Changes on a Capital Programme by "Iain Cameron - Technical Director for LogiKal Projects, UK" at Project Controls Expo 2017, Arsenal Stadium, London
Develop a network schedule for your project using either the arrow.docxkhenry4
Develop a network schedule for your project using either the arrow diagramming method or the precedence method. Also, your project schedule should illustrate float/slack for each activity.
Table 1.1. Project Tasks details
Activity
Predecessor
Anticipated Resources
Added Resources
Duration
Early start date
A (Retirement and social security benefits)
None
$126
$50
One year
1/1/2019
B (Audit & risk evaluation)
A
$118
$25
11 months
2/1/2019
C (Equipment Maintenance)
B
$121
$30
8 months
2/1/2019
D (Training & Development)
A, B
$109
$25
One year
1/2/2019
E (Logistics, appraisals & rewards)
D, C
$118
$30
One year
1/2/2019
Precedence Diagramming Method:
ES
Duration
EF
Activity Legend
LS
Float/slack
LF
LS= Late start Dependency
LF= Late Finish
ES= Early start
EF= Early finish
F= Float/Slack
08/09/2019
1 year 7 months
03/04/2021
Activity B Audit & Risk Evaluation
12/19/2020
2 months
Resources=$25
03/04/2021
07/25/2019
11 months
06/22/2020
Activity C Equipment & Maintenance
08/1/2019
4 months
Resources=$30
12/22/2020
12/27/2019
8 months
08/05//2020
Activity A Retirement & social security
Resources =$50
03/05/2020
3 days
03/8/2020
07/31/2019
2 months
09/23/2019
Activity E Logistics, Appraisals & Rewards
08/10/2019
2 days
Resources=$30
08/12/2019
03/22/2019
1 month
04/09/2019
Activity D Training & Development
03/22/19
5 days
Resources =$25
03/28/2019
5 Activities with 6 dependencies
Running head: EVM PAPER 1
EVM PAPER 1
EVM Paper
Mary Krenisky
Joe Scott
BUS 419
August 27, 2018
EVM Paper
In the current project, additional resources are added at in each work activity to complete the work packages in a quickly. The resources are added to these activities to reduce the slack that may originate if the project is accomplished based on planned resources only. An earned value analysis has to be performed to keep track of a project’s performance. This type of assessment gives a general review about the performance of a project along the chosen course. It has been noted that after adding more resources for the achievement of the ventures successfully, the slack time has been decreased and the work is going on faster than planned.
Earned value management is employed in different forms to determine the performance of the projects. By using this technique, the cost, schedule and, scope of the project are integrated that in turn aids the team of project administration to calculate and evaluate fulfillment and growth of the plan (Usmani, n.d.). The measurements of earned value are utilized by all managers of the projects. There are three main components of earned value management which are
• Actual cost
• Earned value
• Planned value
Planned value
It is the value of a task to be accomplished in a specified time. Overall planned value is known as ‘Budget at completion.’ Planned value also acts as a project’s baseline (Usmani, n.d.).
Actual cost
Actual cost denotes the quantity of money which is i.
A graphical CV for the more business driven clients, this CV format reflects myself in a more personal way. Its more intuitive to read for the client and it shows some of my additional skills and influential professionalism to reflect my career in a format different to other candidates and to a potential employer
I created this document to allow resources in the financial institutional sector to benefit from someone who is experienced in supporting BCBS projects from a PMO perspective. In summary it provides the reader with a deeper understanding of BCBS and what's required to be successfully compliant. It also provides information in layman's (rather then jargon) and gives a general insight into what BCBS is about, and how compliance requirements need to align to the 14 principles.
This will help you (the candidate) prepare for a competency based interview using the STAR technique.
It contains common Q&A's that I've been asked to answer during an interview. I've tried to make the questions more generic so you can use these to relate your responses to your roles.
This document is another voluntary contribution I've created to help others in the market to have the edge in the market and to support my personal development units required to maintain some of my qualifications.
I created this document because I wanted to start saving some of the common formulas that I have managed to repeatedly re-use and sometimes its difficult to remember them when i really need them so this tracker helps me remember them and will help others use the functions that are commonly used to save time within our daily jobs to manipulate data effectively.
This presentation gives a high level overview of how you can adapt and use multiple and singular project management tools in collaboration to achieve EVM and many other PMO features. I work with for the consultancy company called Banking Alliance Ltd providing Project management services to its clients Slide 23 is animated so apologies for the overlapping text in the slideshare version.
High Level Overview Of Using The Earned Value On A T24 Project
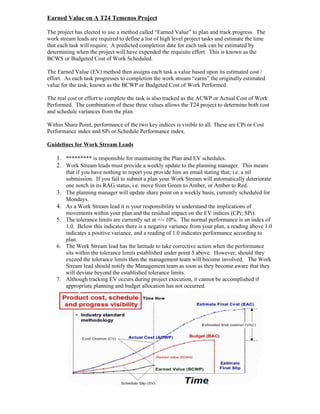
1. Earned Value on A T24 Temenos Project
The project has elected to use a method called “Earned Value” to plan and track progress. The
work stream leads are required to define a list of high level project tasks and estimate the time
that each task will require. A predicted completion date for each task can be estimated by
determining when the project will have expended the requisite effort. This is known as the
BCWS or Budgeted Cost of Work Scheduled.
The Earned Value (EV) method then assigns each task a value based upon its estimated cost /
effort. As each task progresses to completion the work stream “earns” the originally estimated
value for the task, known as the BCWP or Budgeted Cost of Work Performed.
The real cost or effort to complete the task is also tracked as the ACWP or Actual Cost of Work
Performed. The combination of these three values allows the T24 project to determine both cost
and schedule variances from the plan.
Within Share Point, performance of the two key indices is visible to all. These are CPi or Cost
Performance index and SPi or Schedule Performance index.
Guidelines for Work Stream Leads
1. ********* is responsible for maintaining the Plan and EV schedules.
2. Work Stream leads must provide a weekly update to the planning manager. This means
that if you have nothing to report you provide him an email stating that; i.e. a nil
submission. If you fail to submit a plan your Work Stream will automatically deteriorate
one notch in its RAG status, i.e. move from Green to Amber, or Amber to Red.
3. The planning manager will update share point on a weekly basis, currently scheduled for
Mondays.
4. As a Work Stream lead it is your responsibility to understand the implications of
movements within your plan and the residual impact on the EV indices (CPi; SPi).
5. The tolerance limits are currently set at +/- 10%. The normal performance is an index of
1.0. Below this indicates there is a negative variance from your plan, a reading above 1.0
indicates a positive variance, and a reading of 1.0 indicates performance according to
plan.
6. The Work Stream lead has the latitude to take corrective action when the performance
sits within the tolerance limits established under point 5 above. However, should they
exceed the tolerance limits then the management team will become involved. The Work
Stream lead should notify the Management team as soon as they become aware that they
will deviate beyond the established tolerance limits.
7. Although tracking EV occurs during project execution, it cannot be accomplished if
appropriate planning and budget allocation has not occurred.