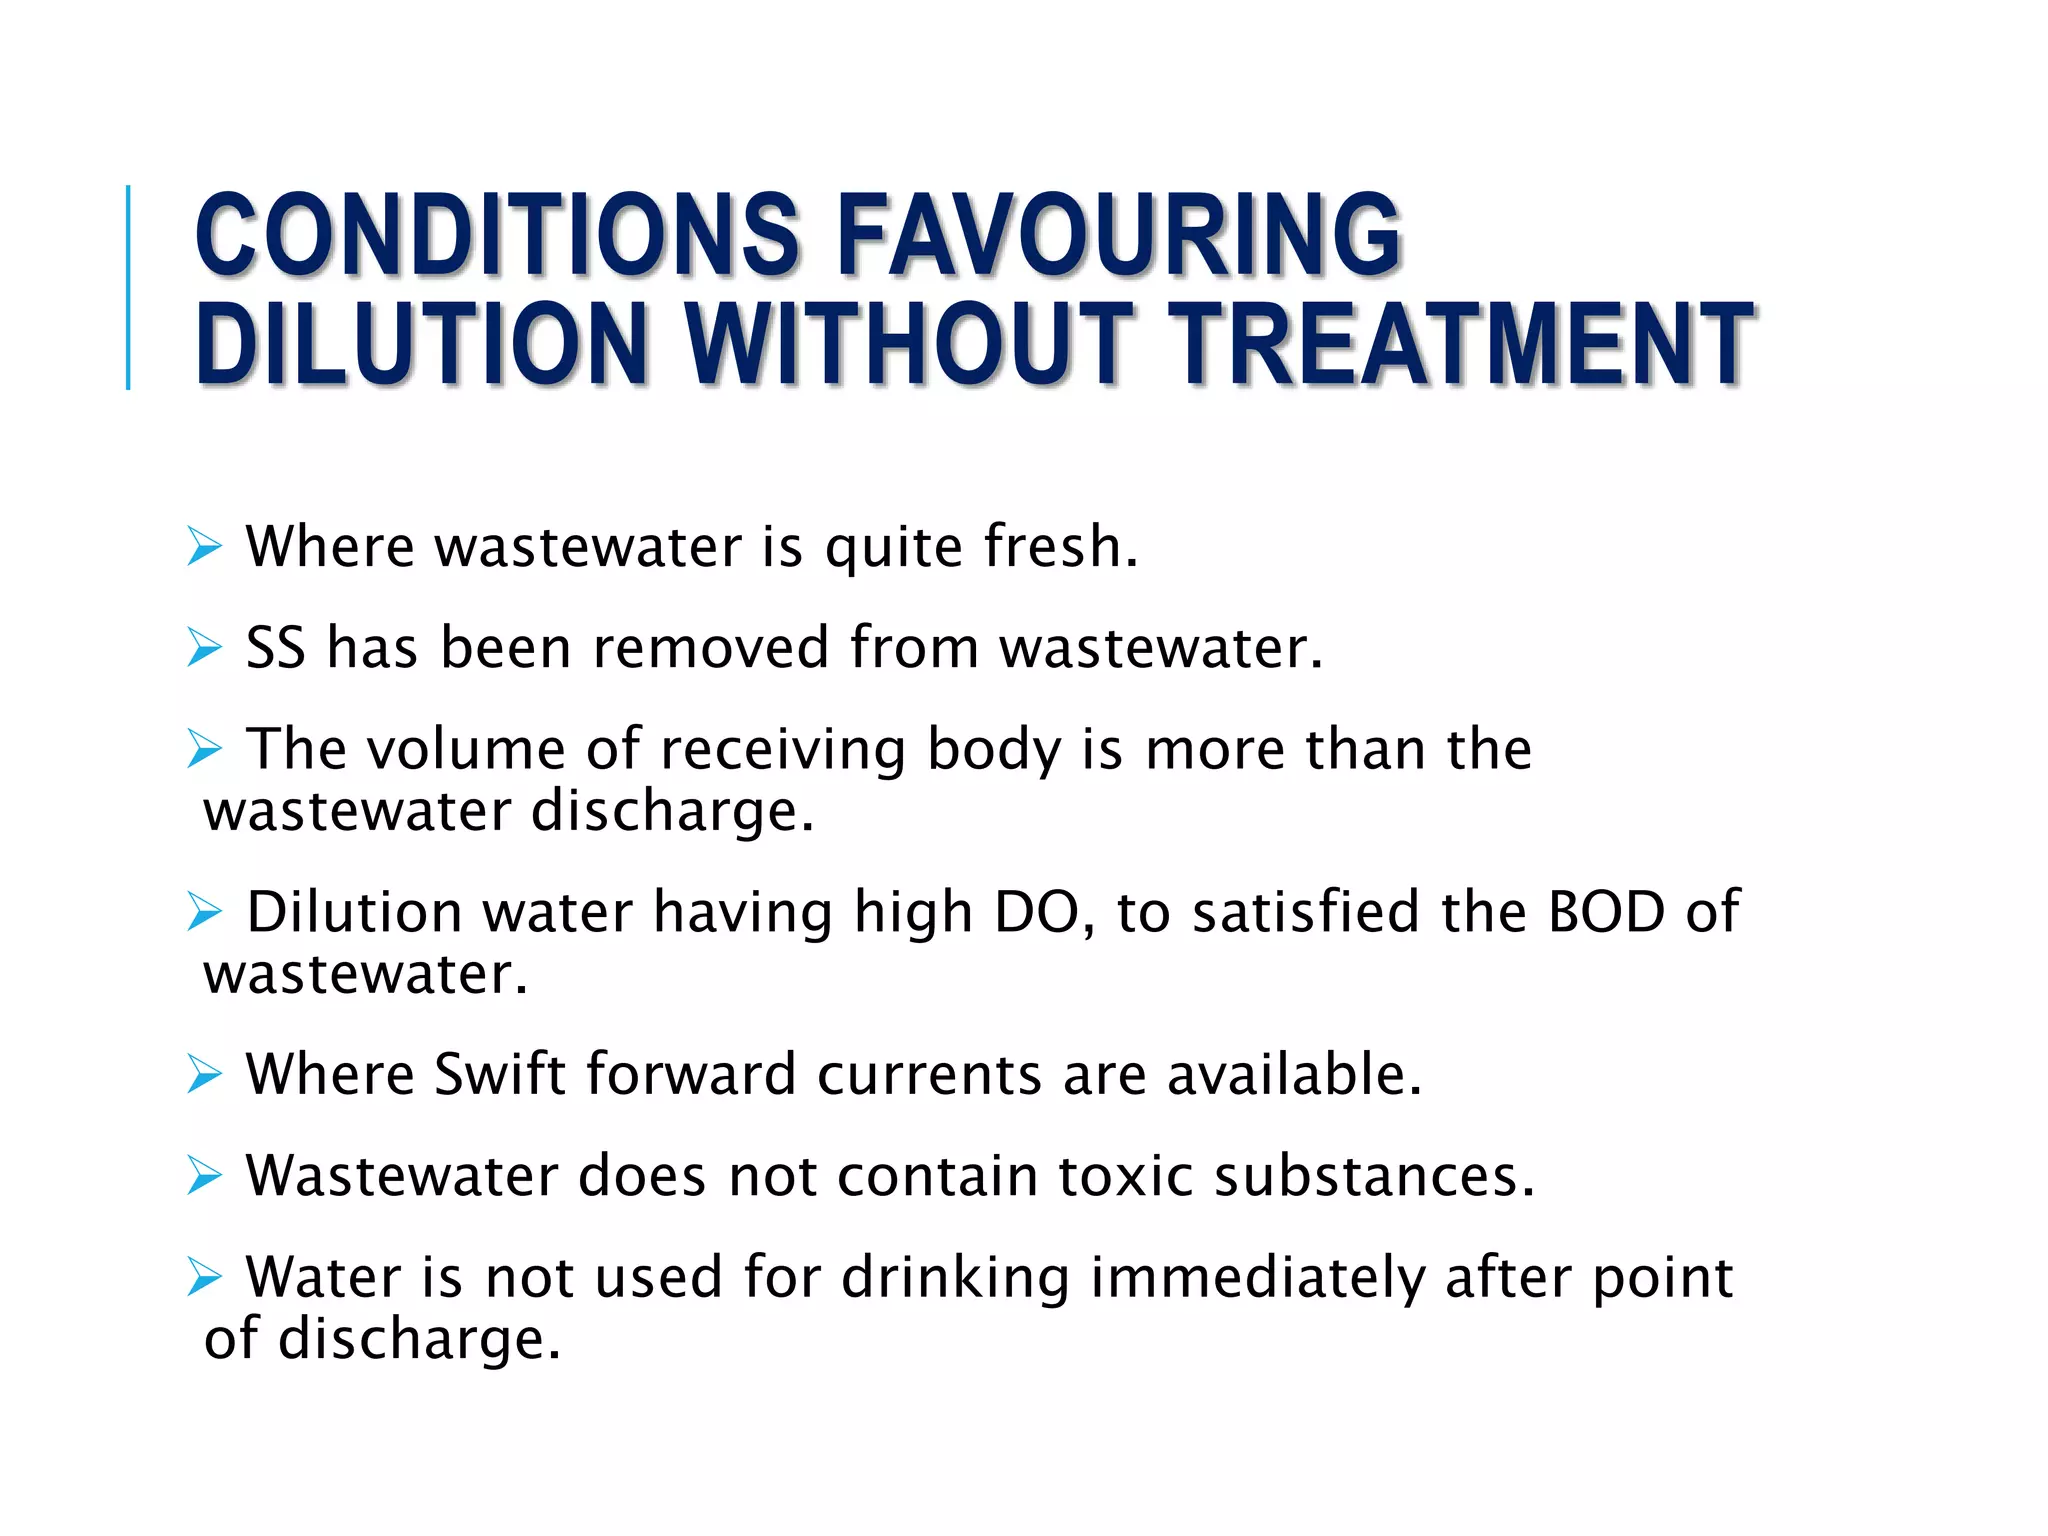
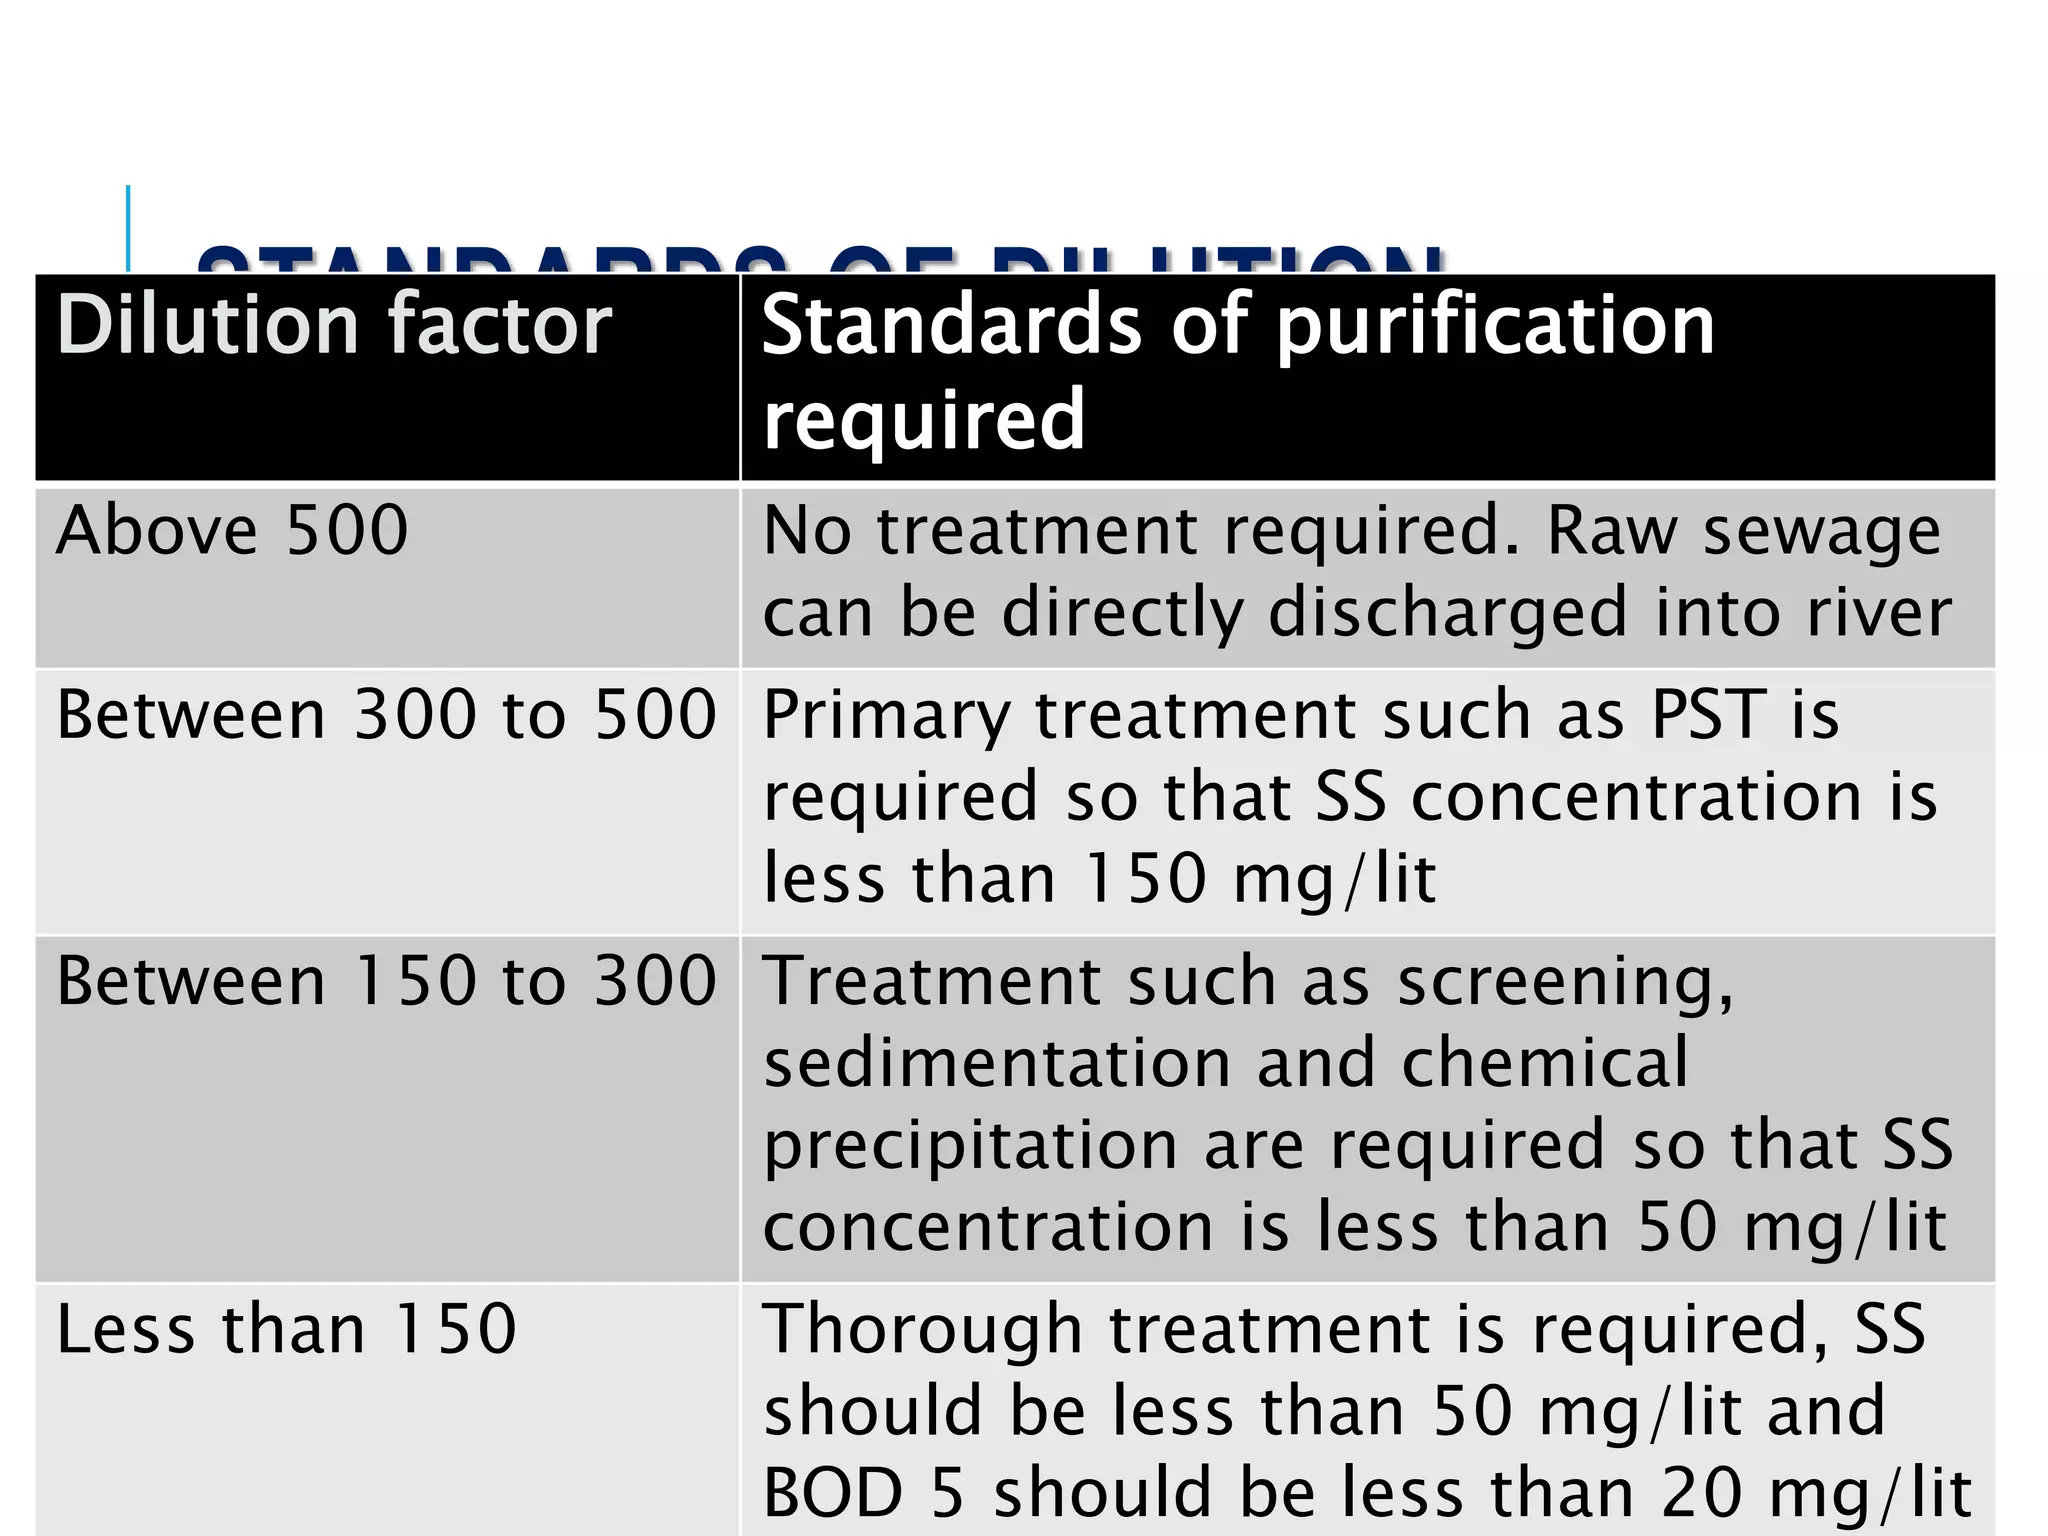
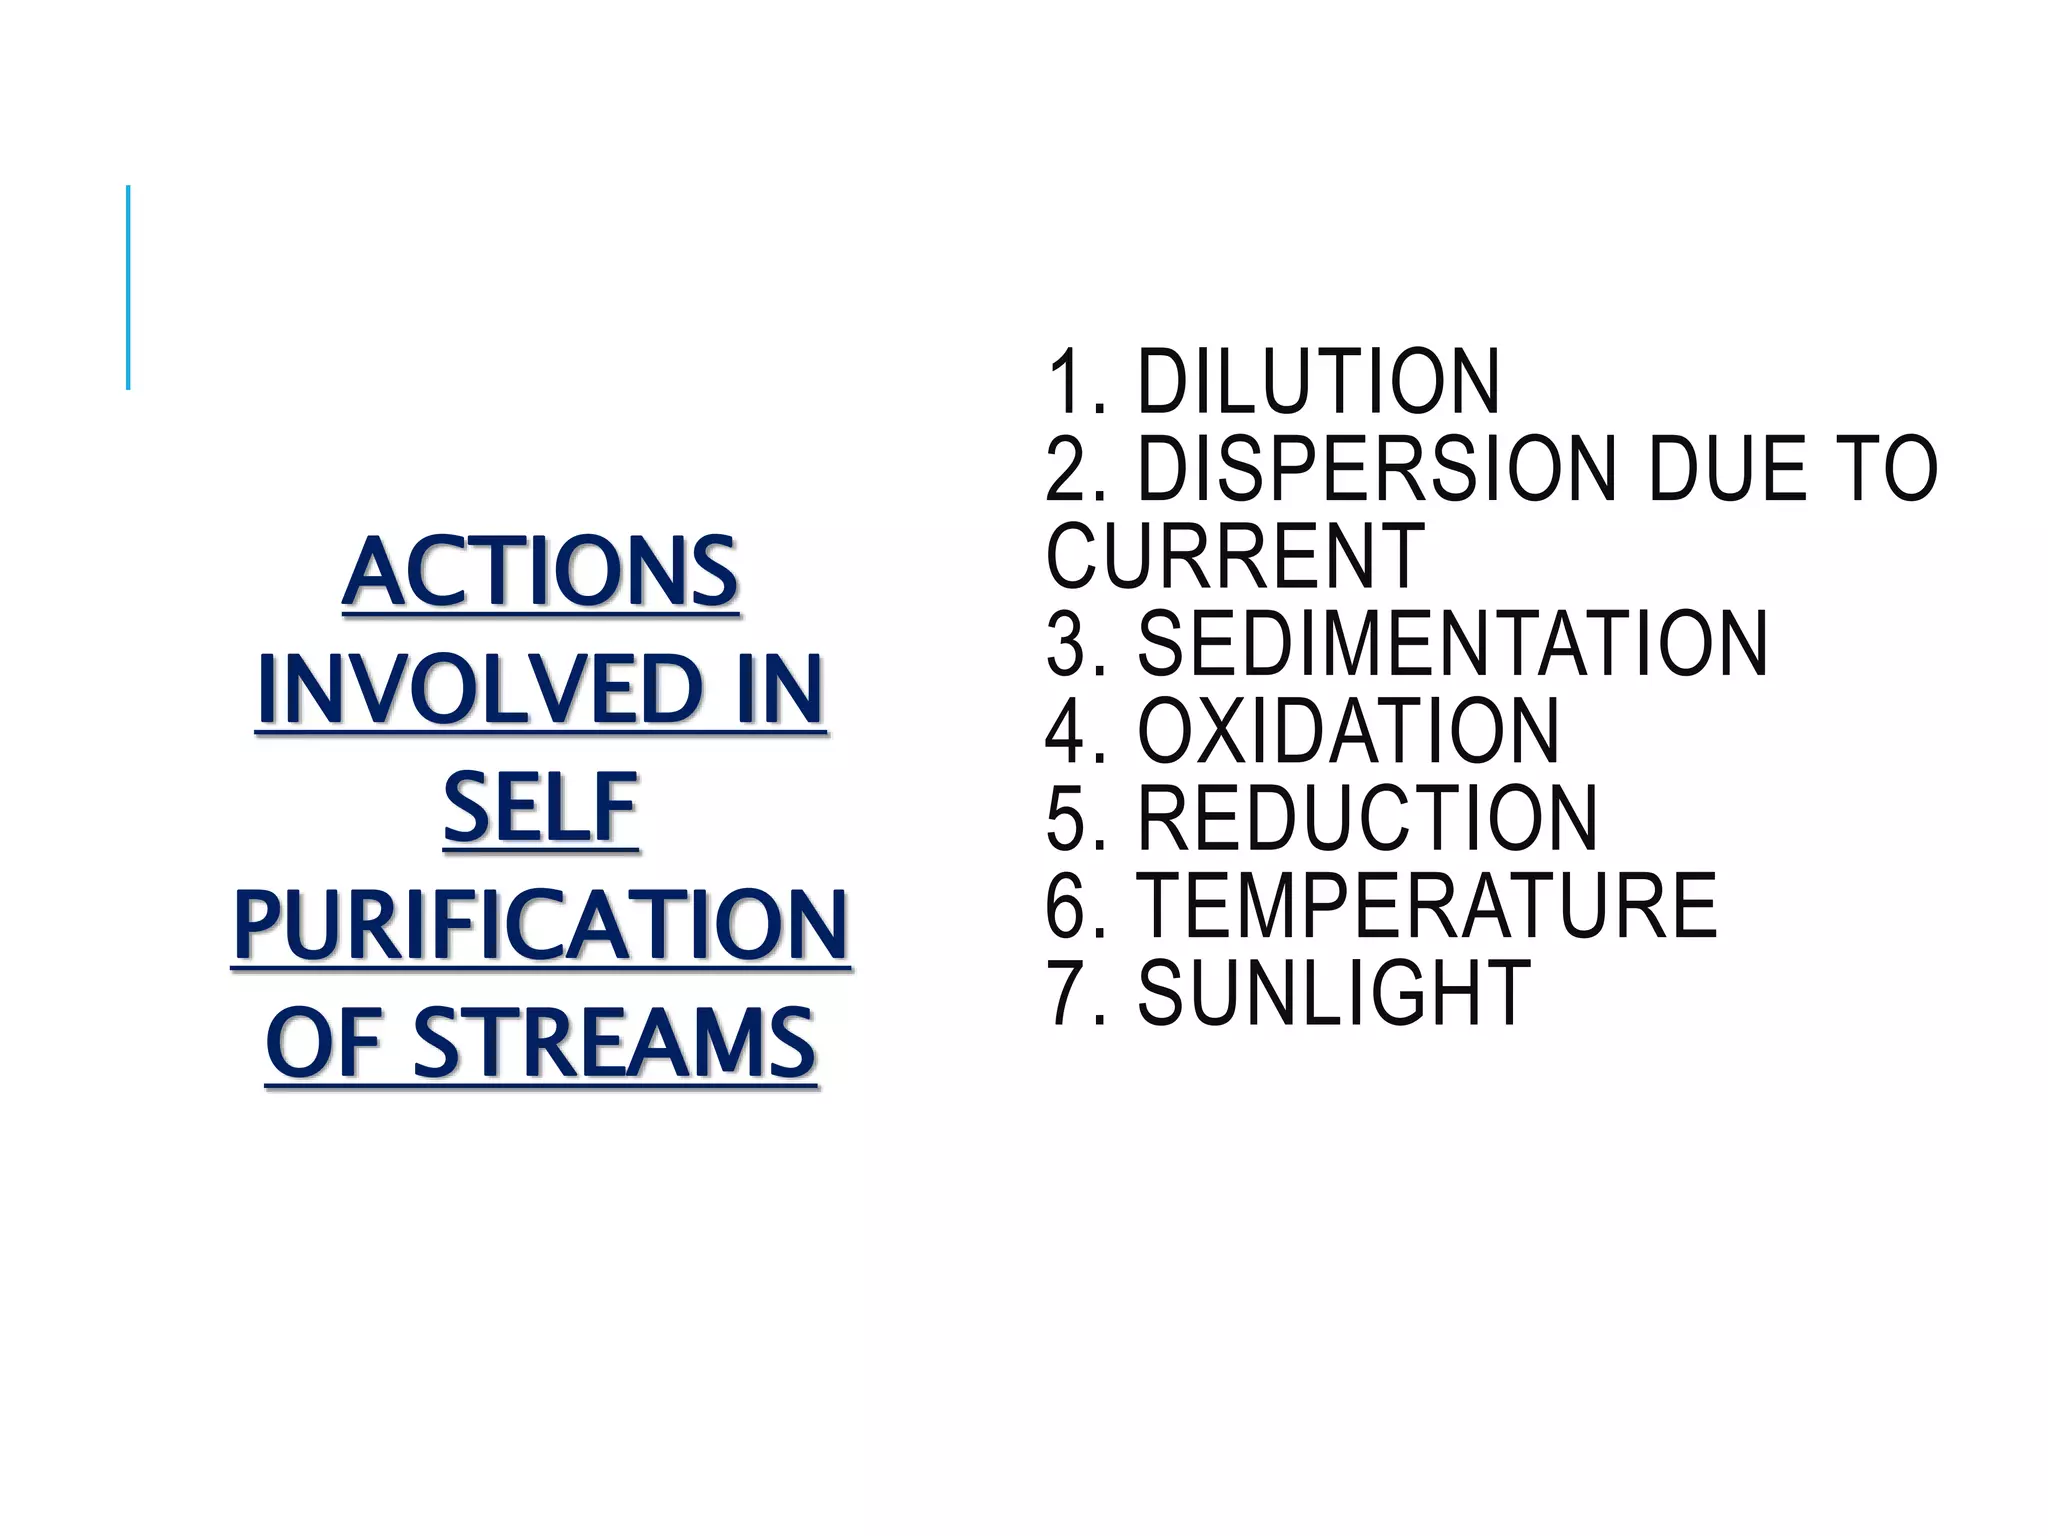
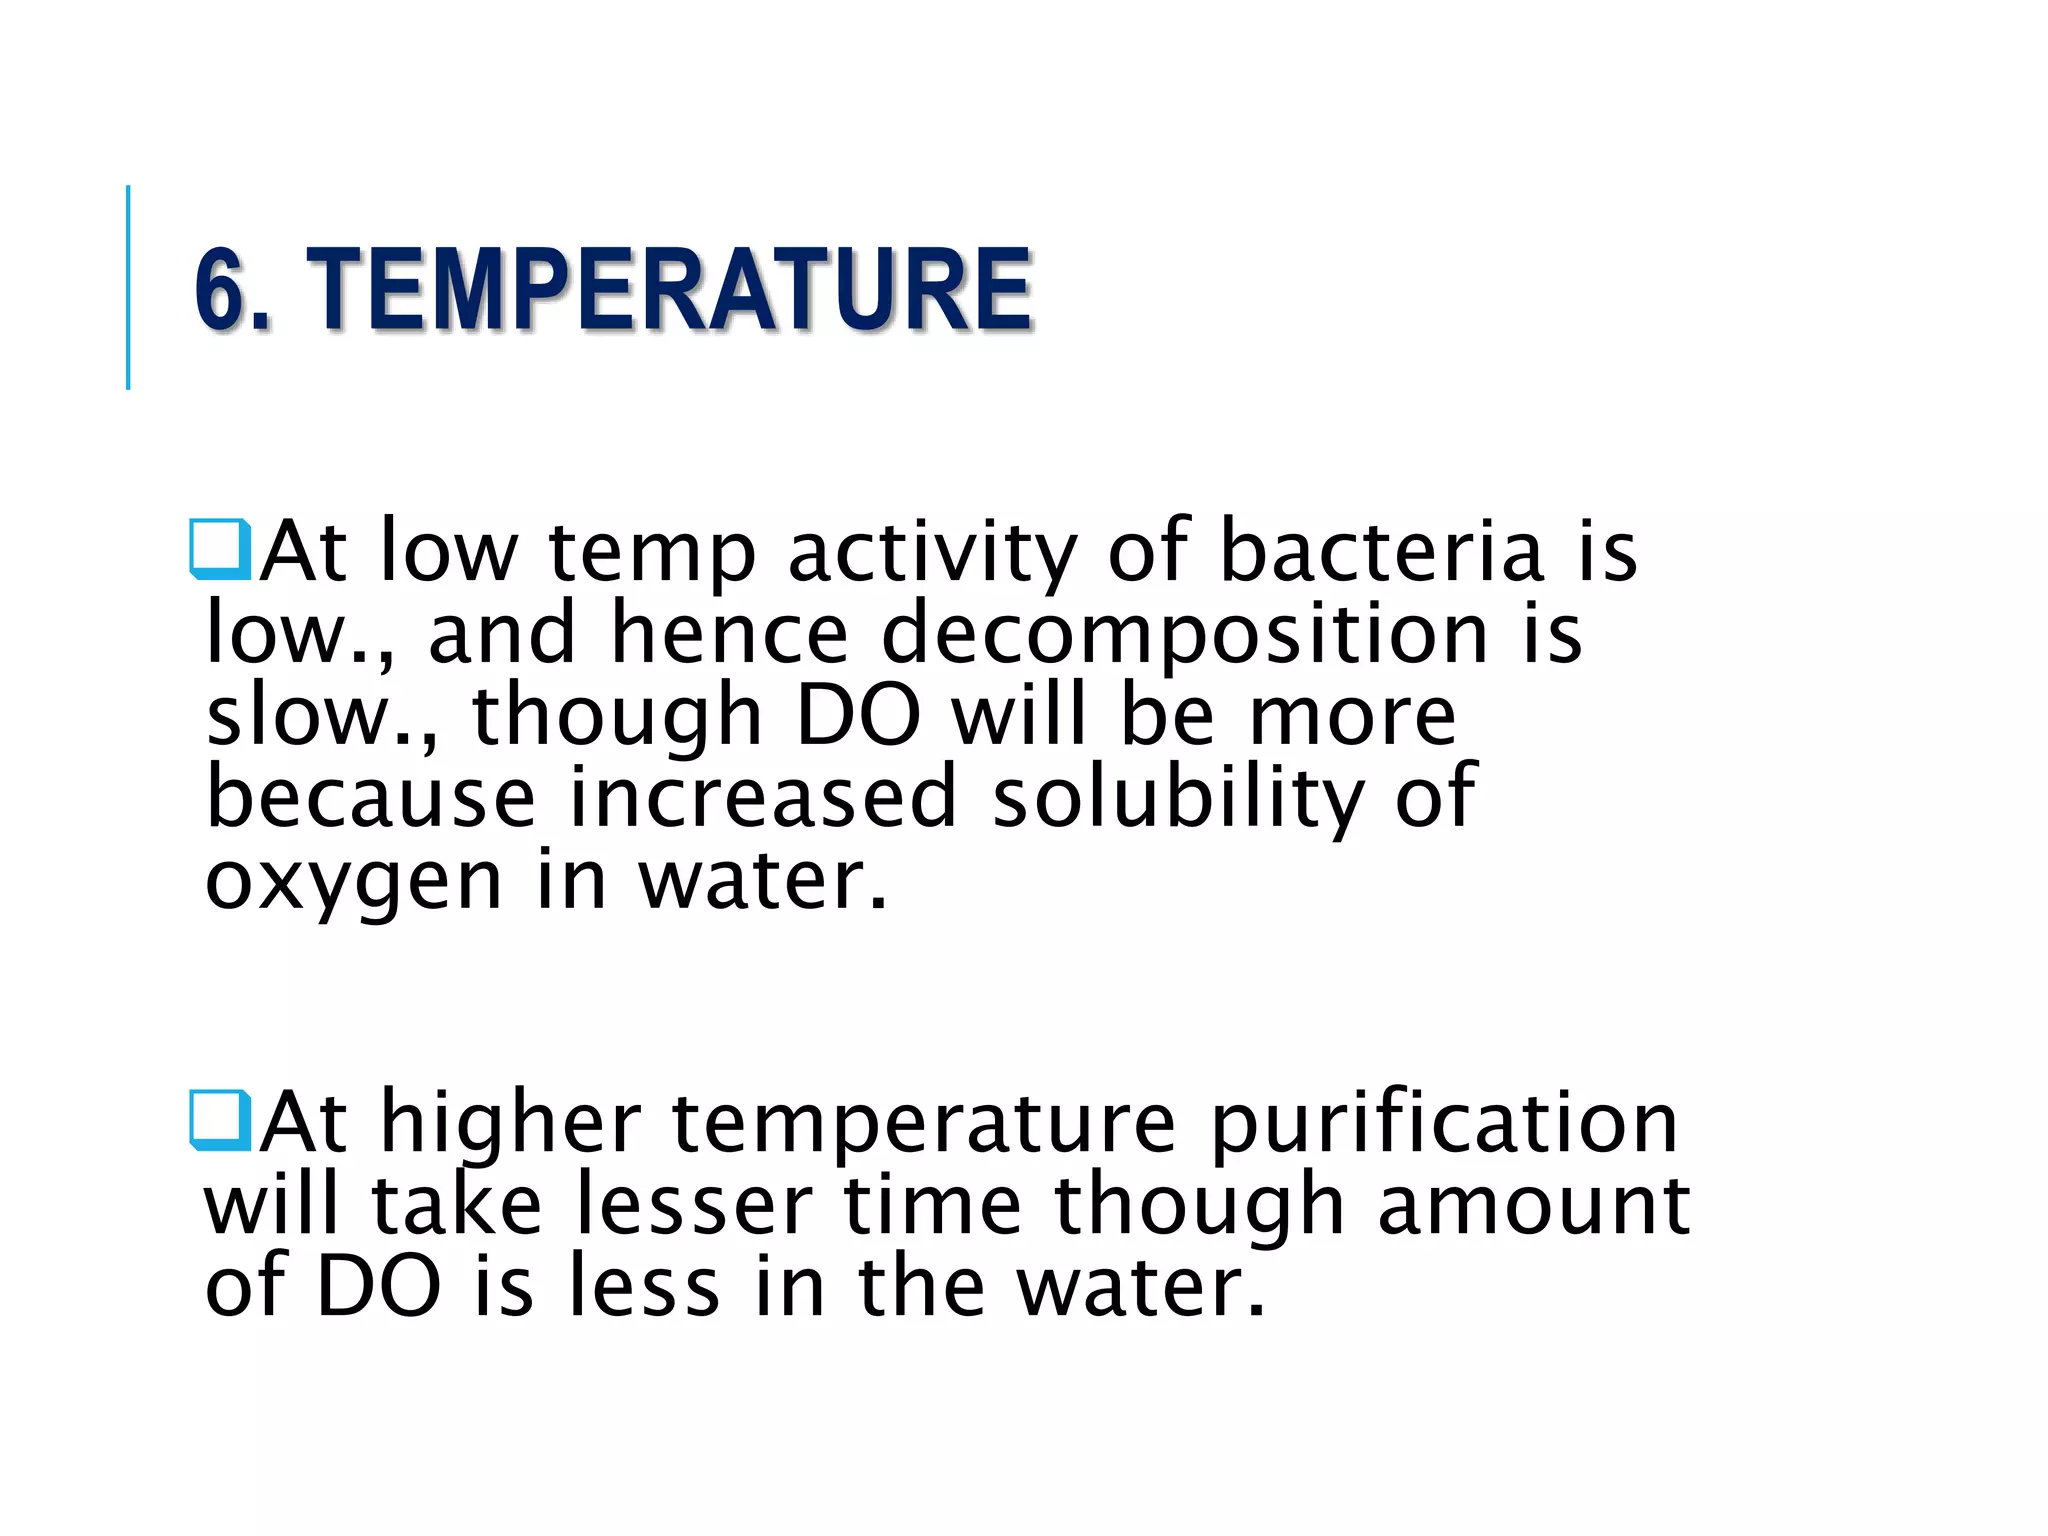
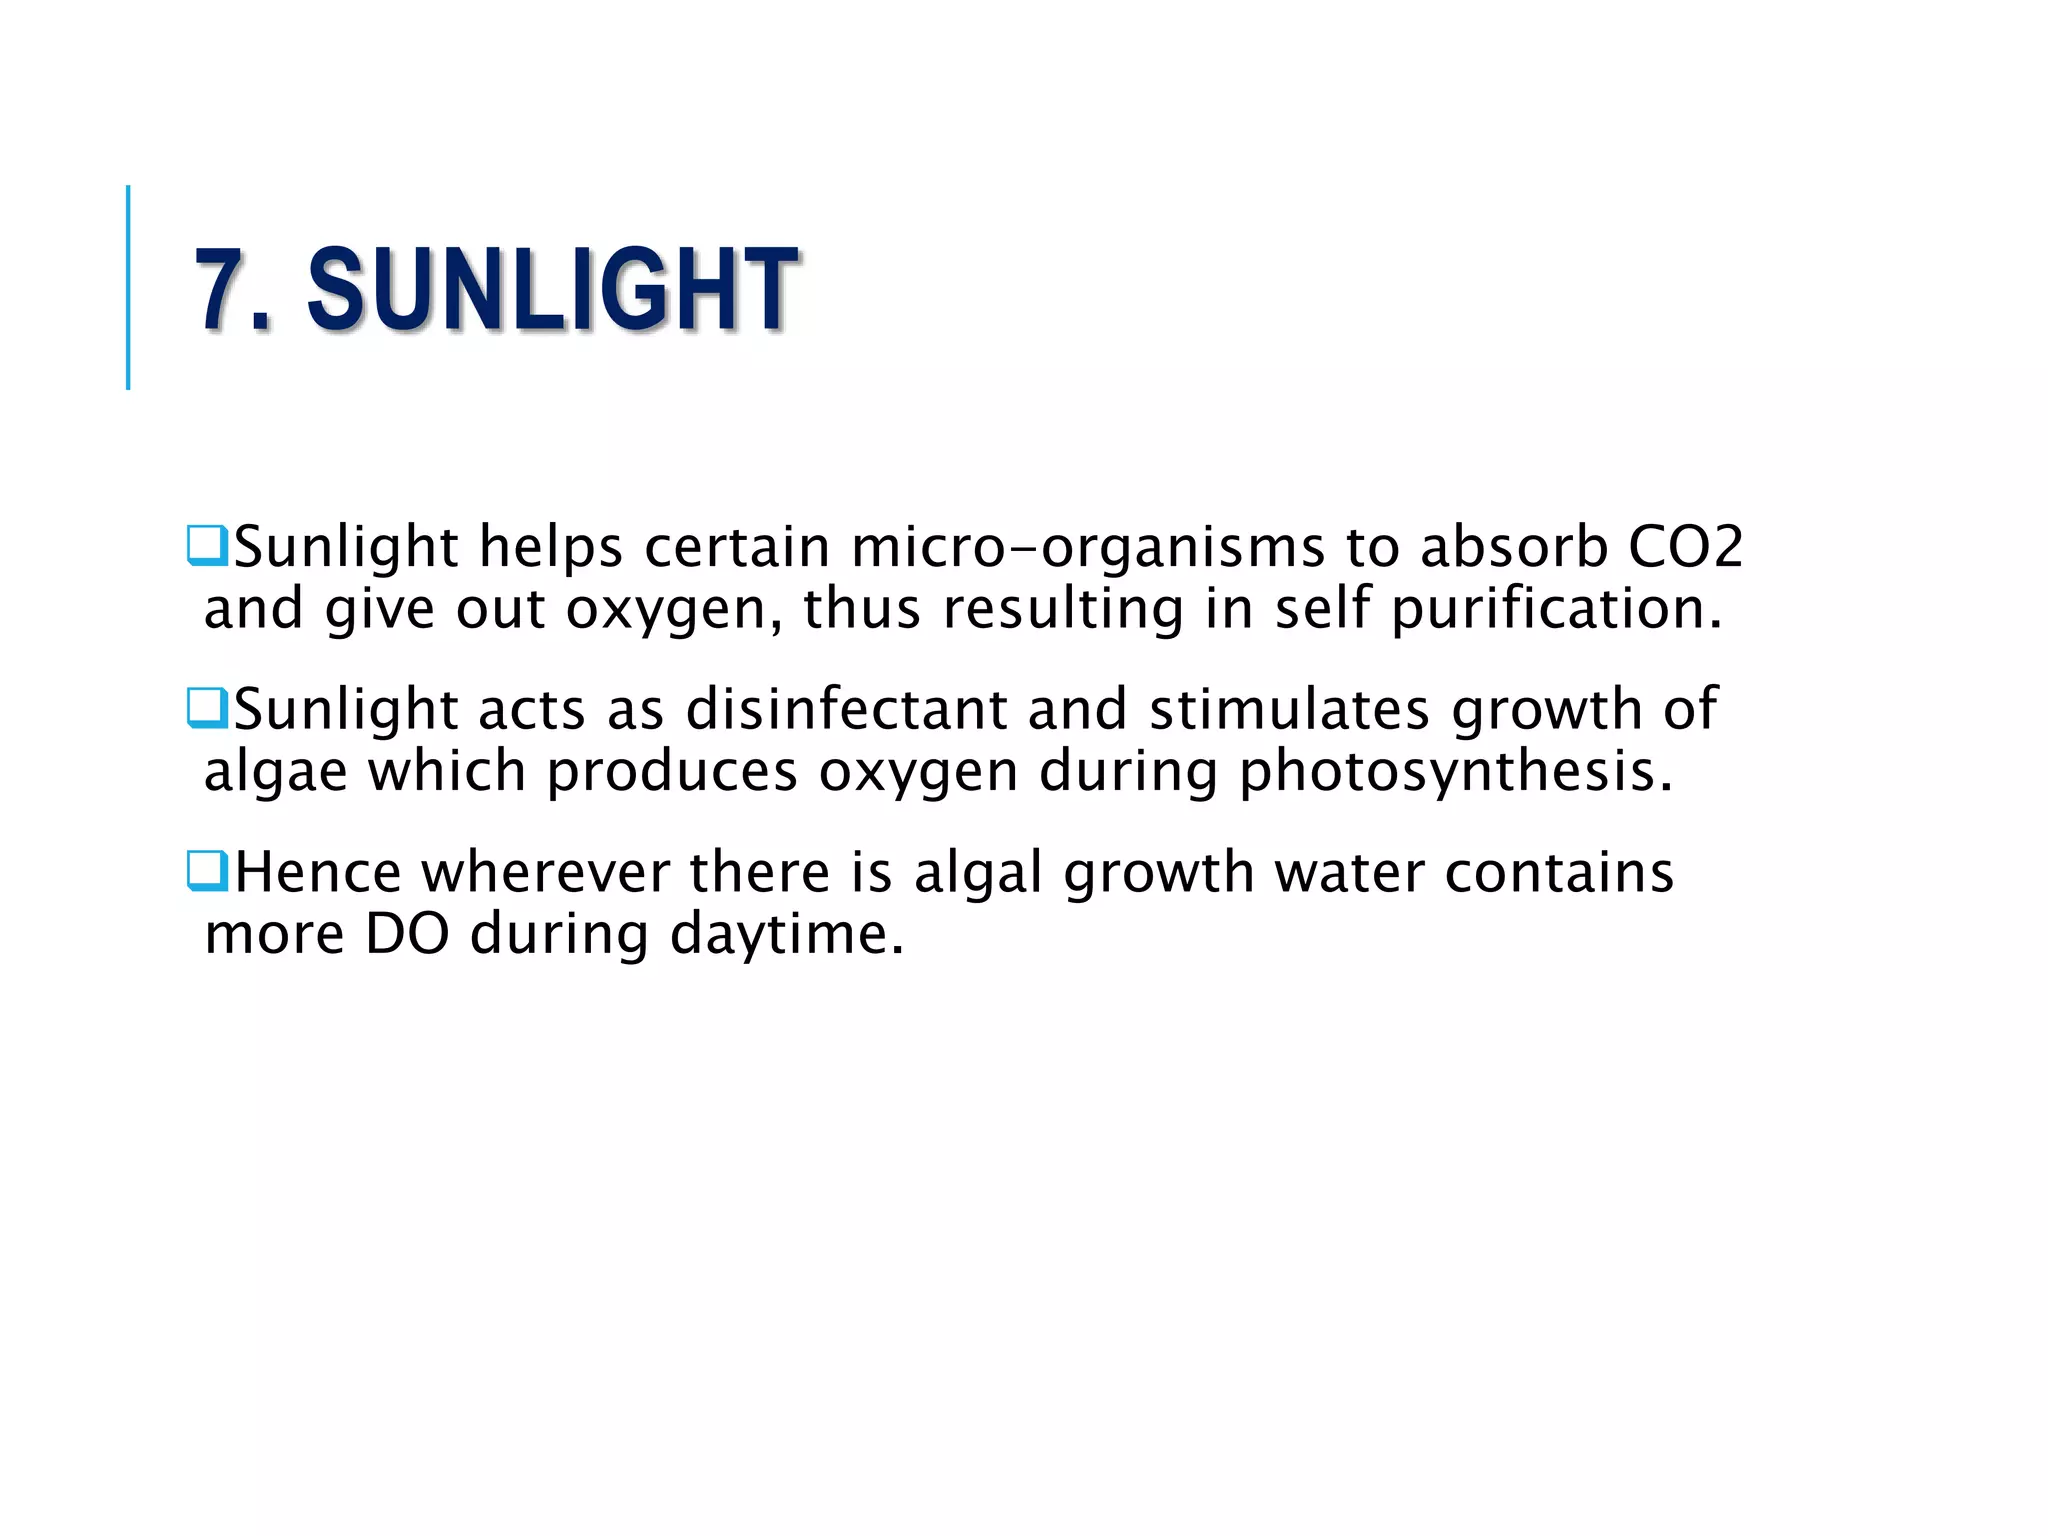
1. Streams have the ability to purify themselves through natural processes like dilution, dispersion, sedimentation, oxidation, and reactions driven by temperature, sunlight, and microorganisms.
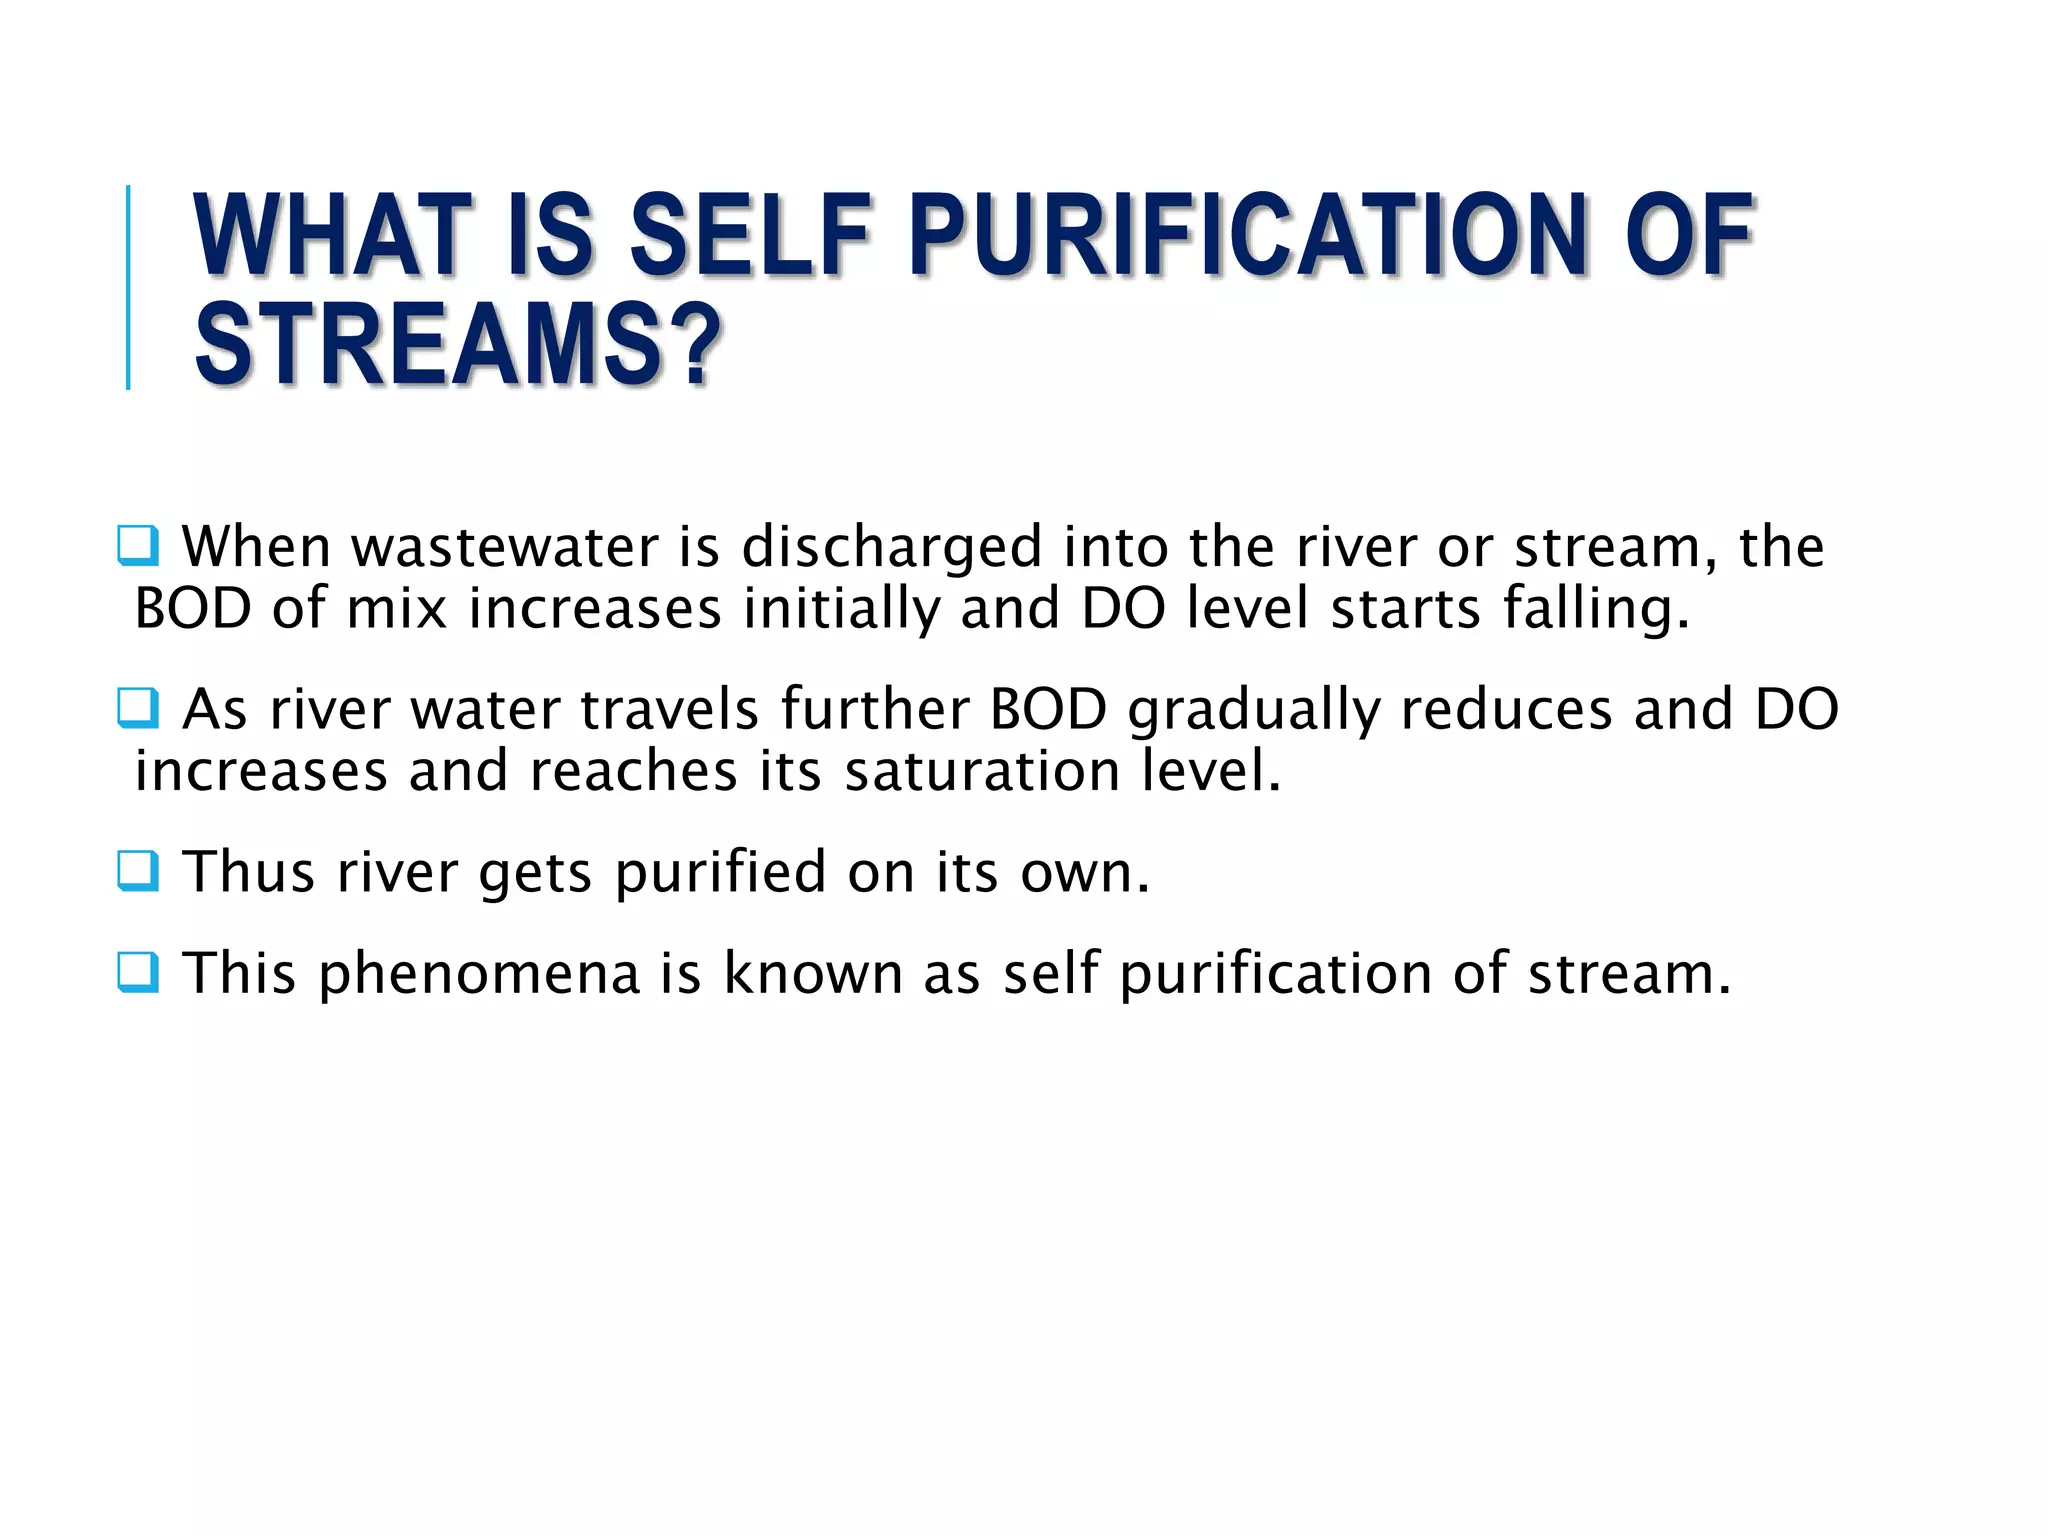
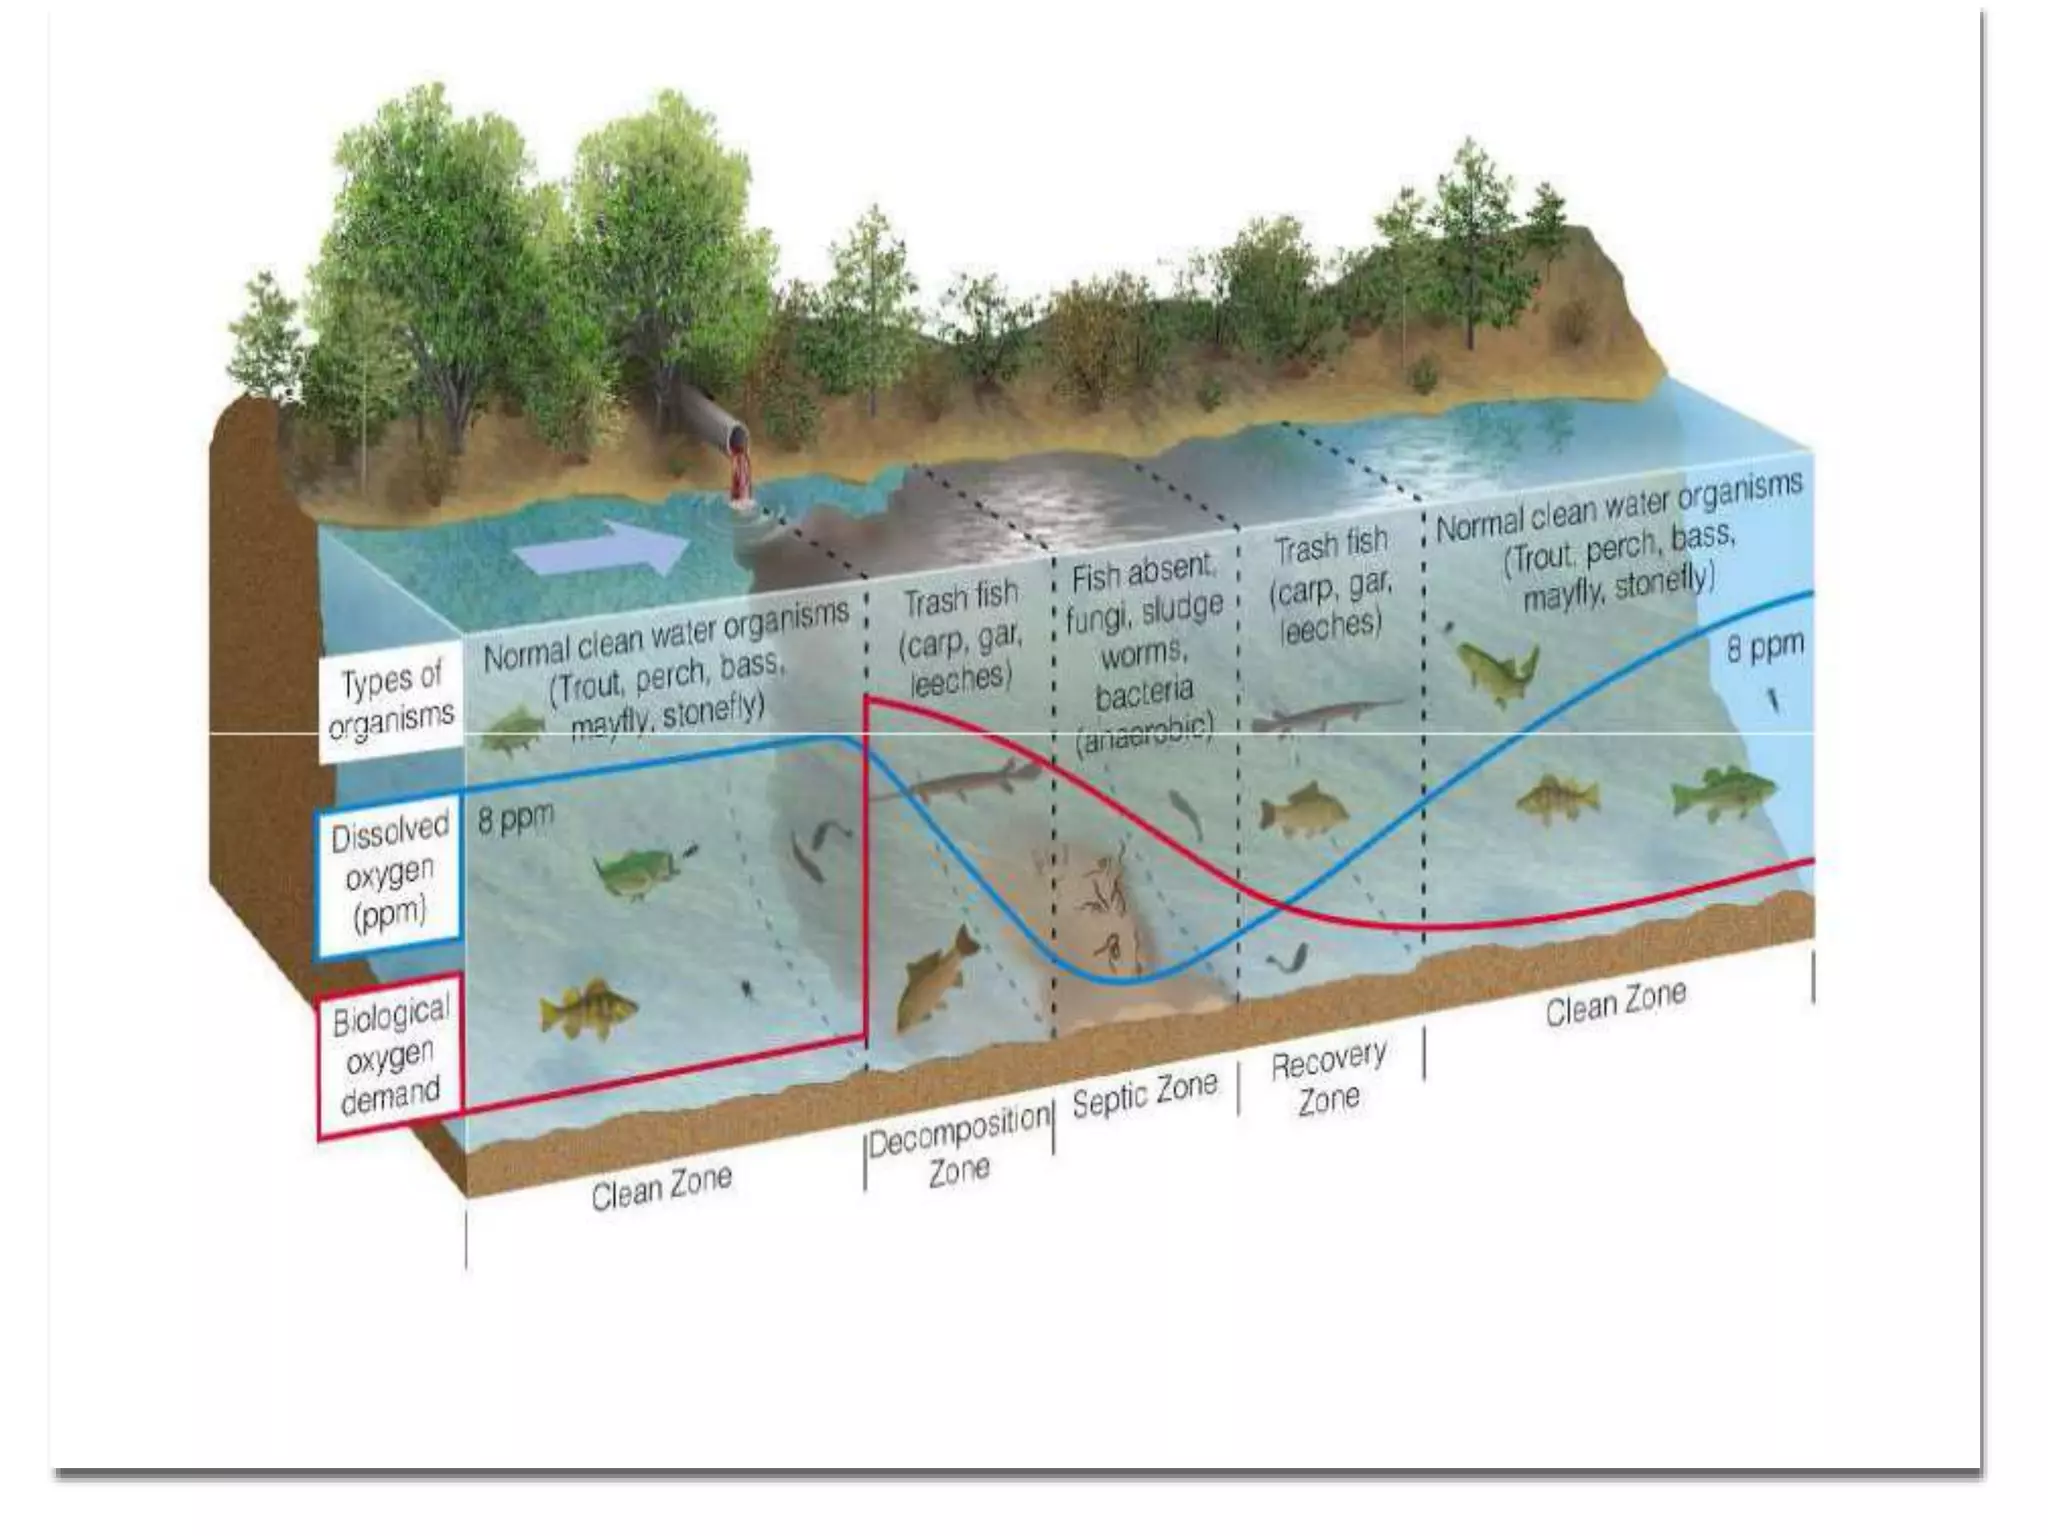
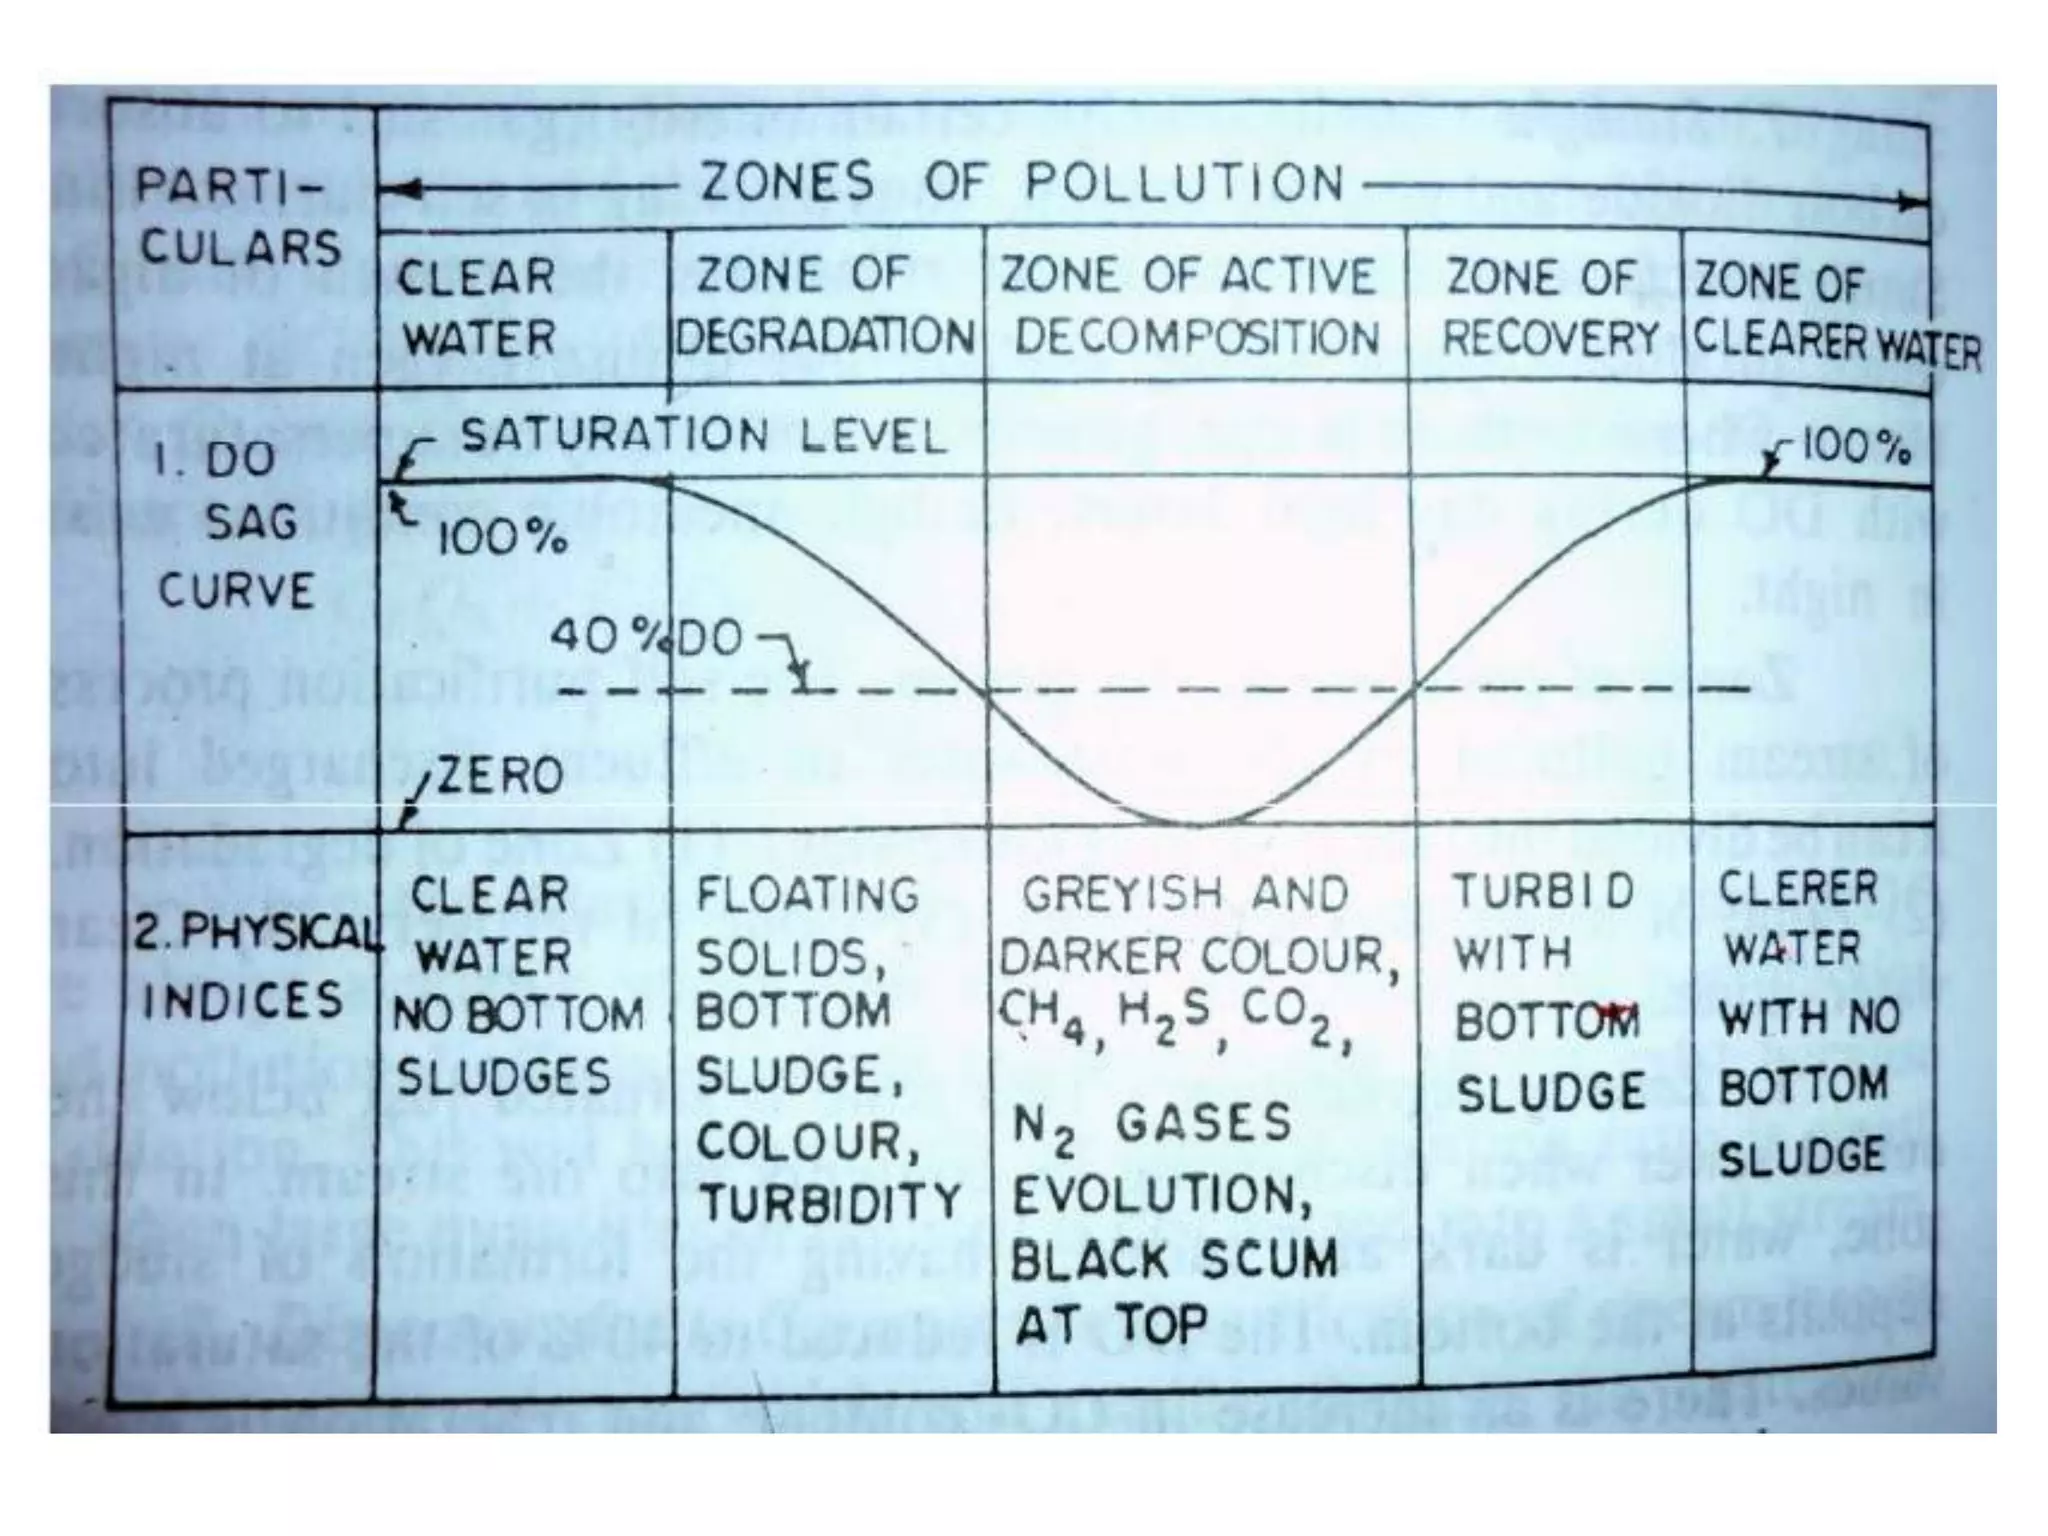
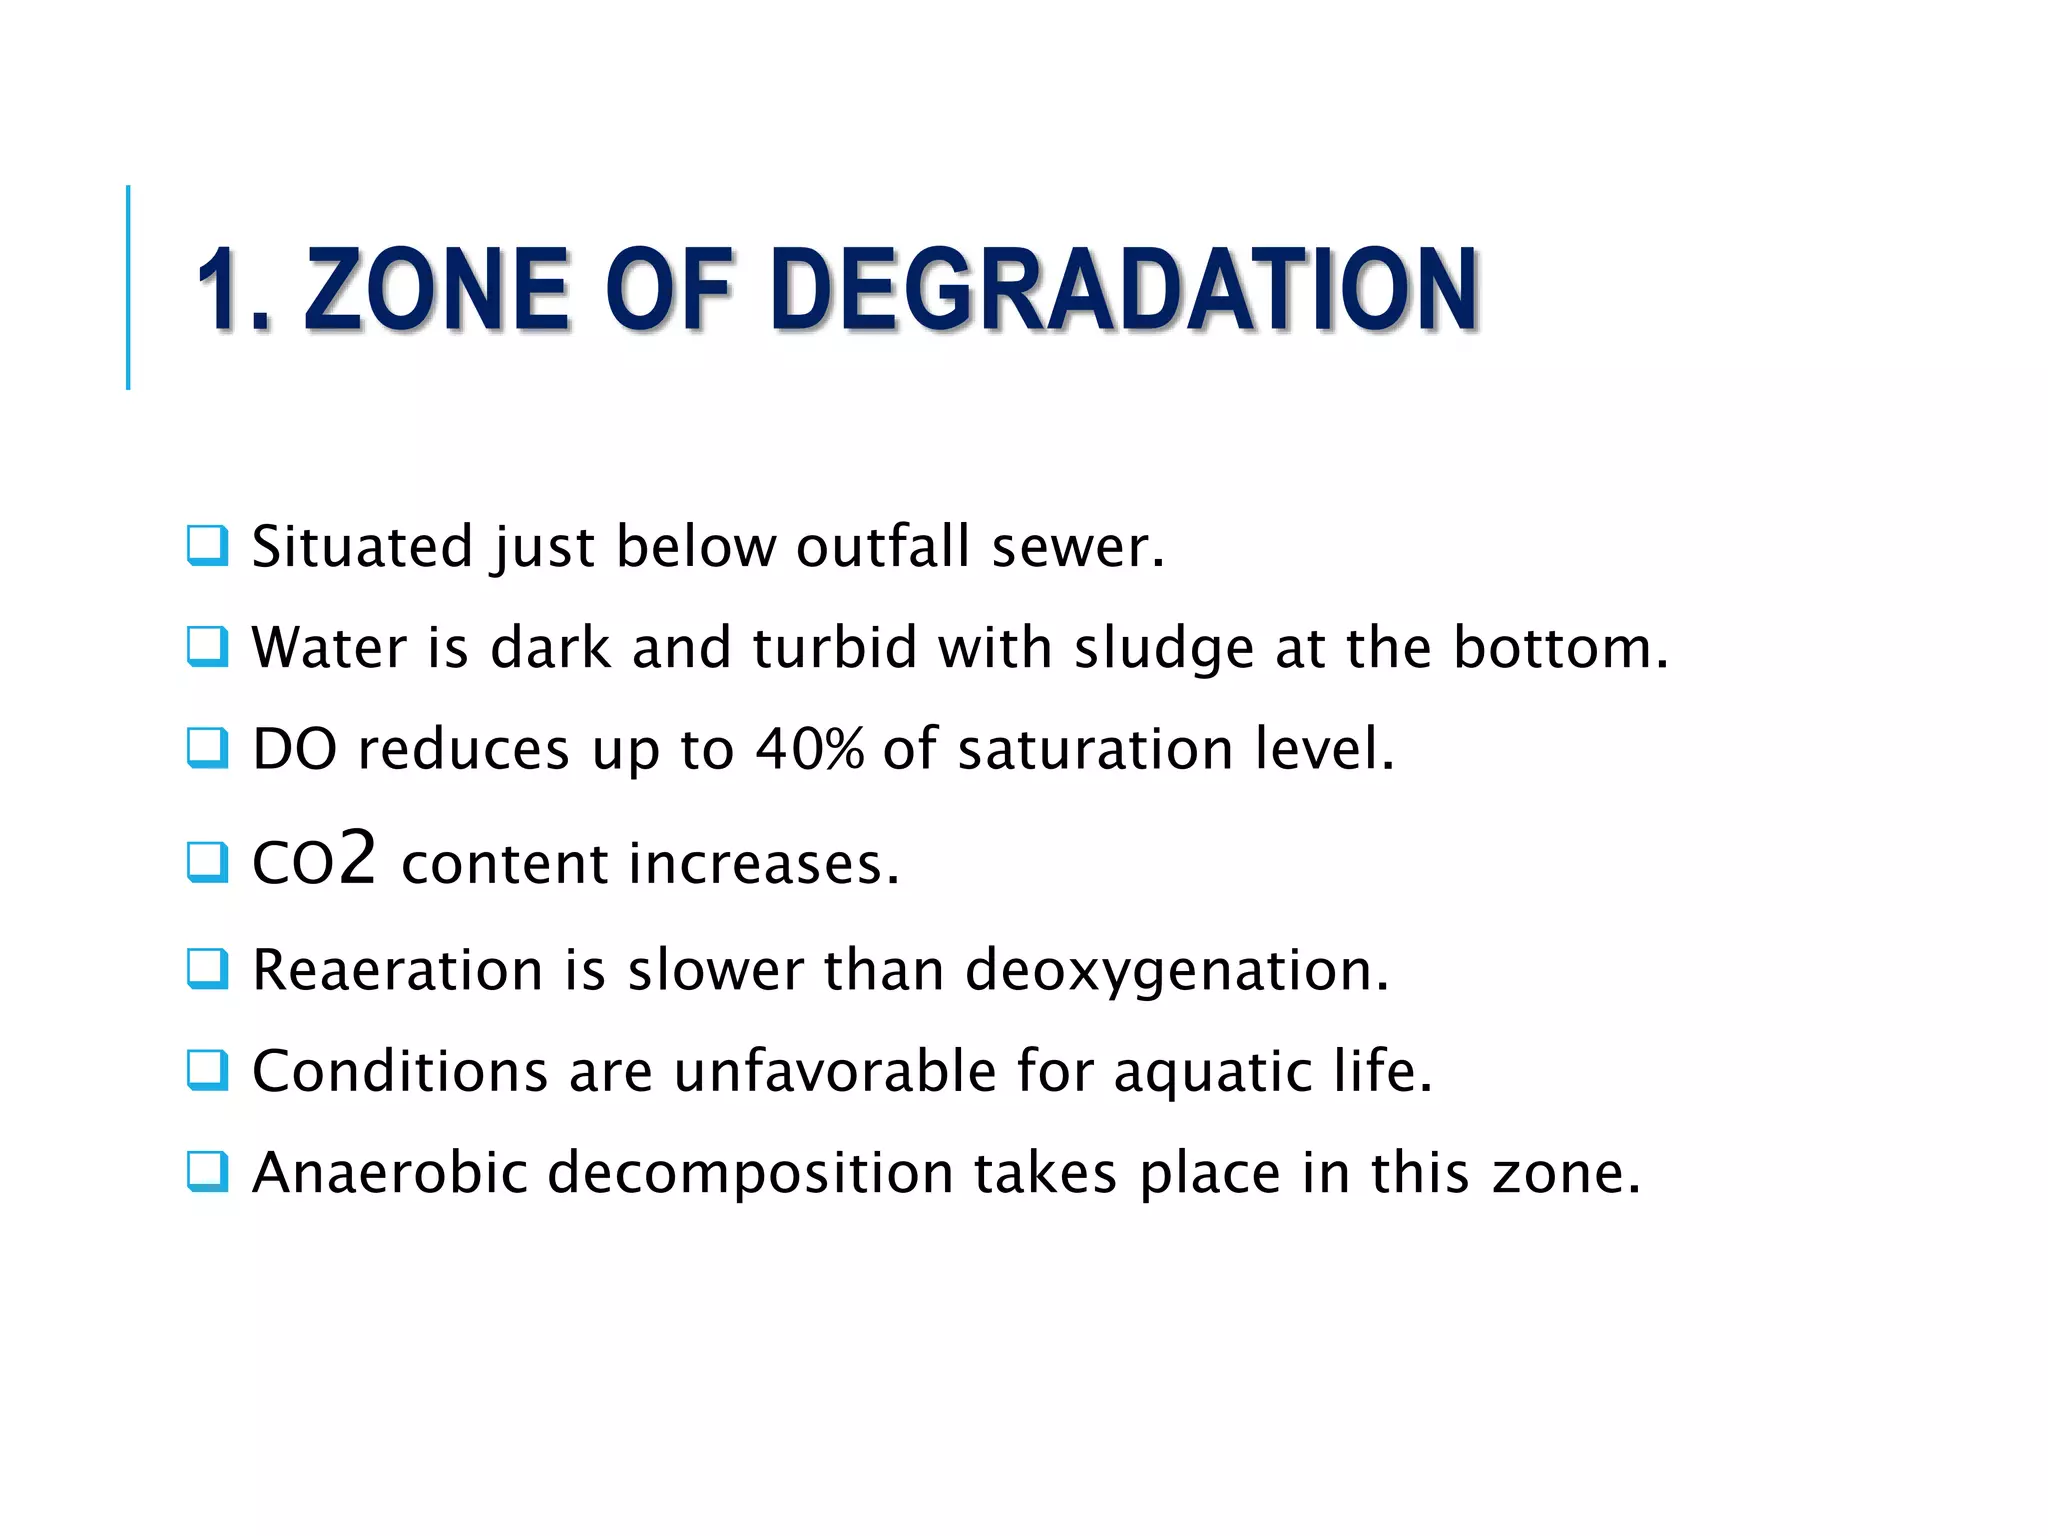
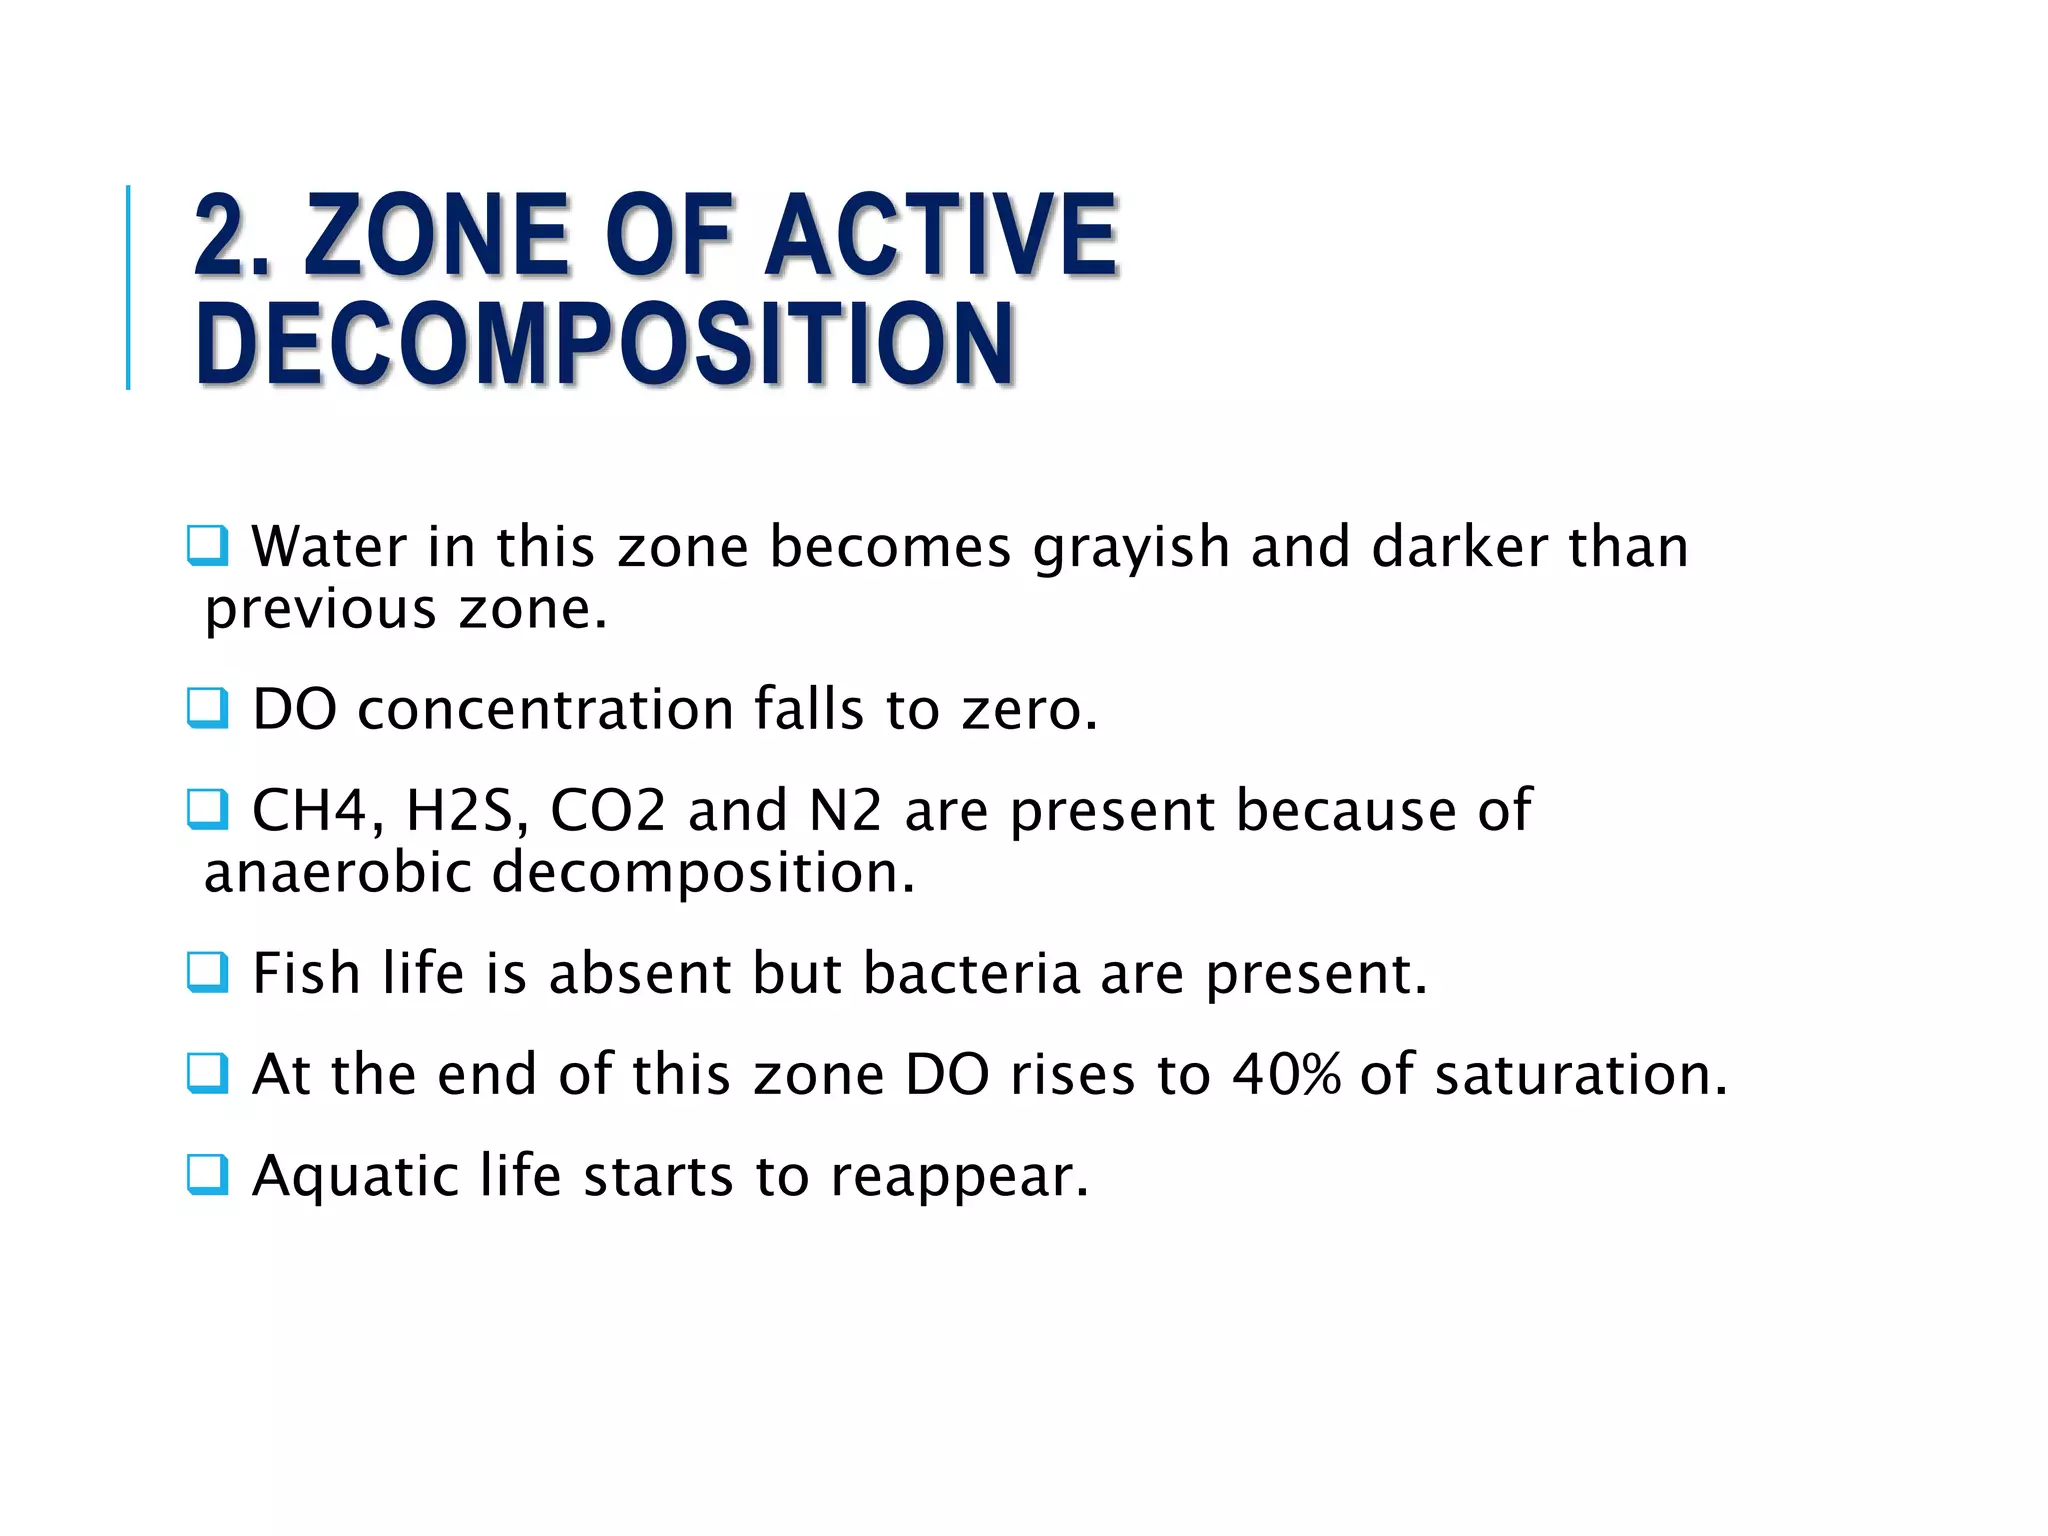
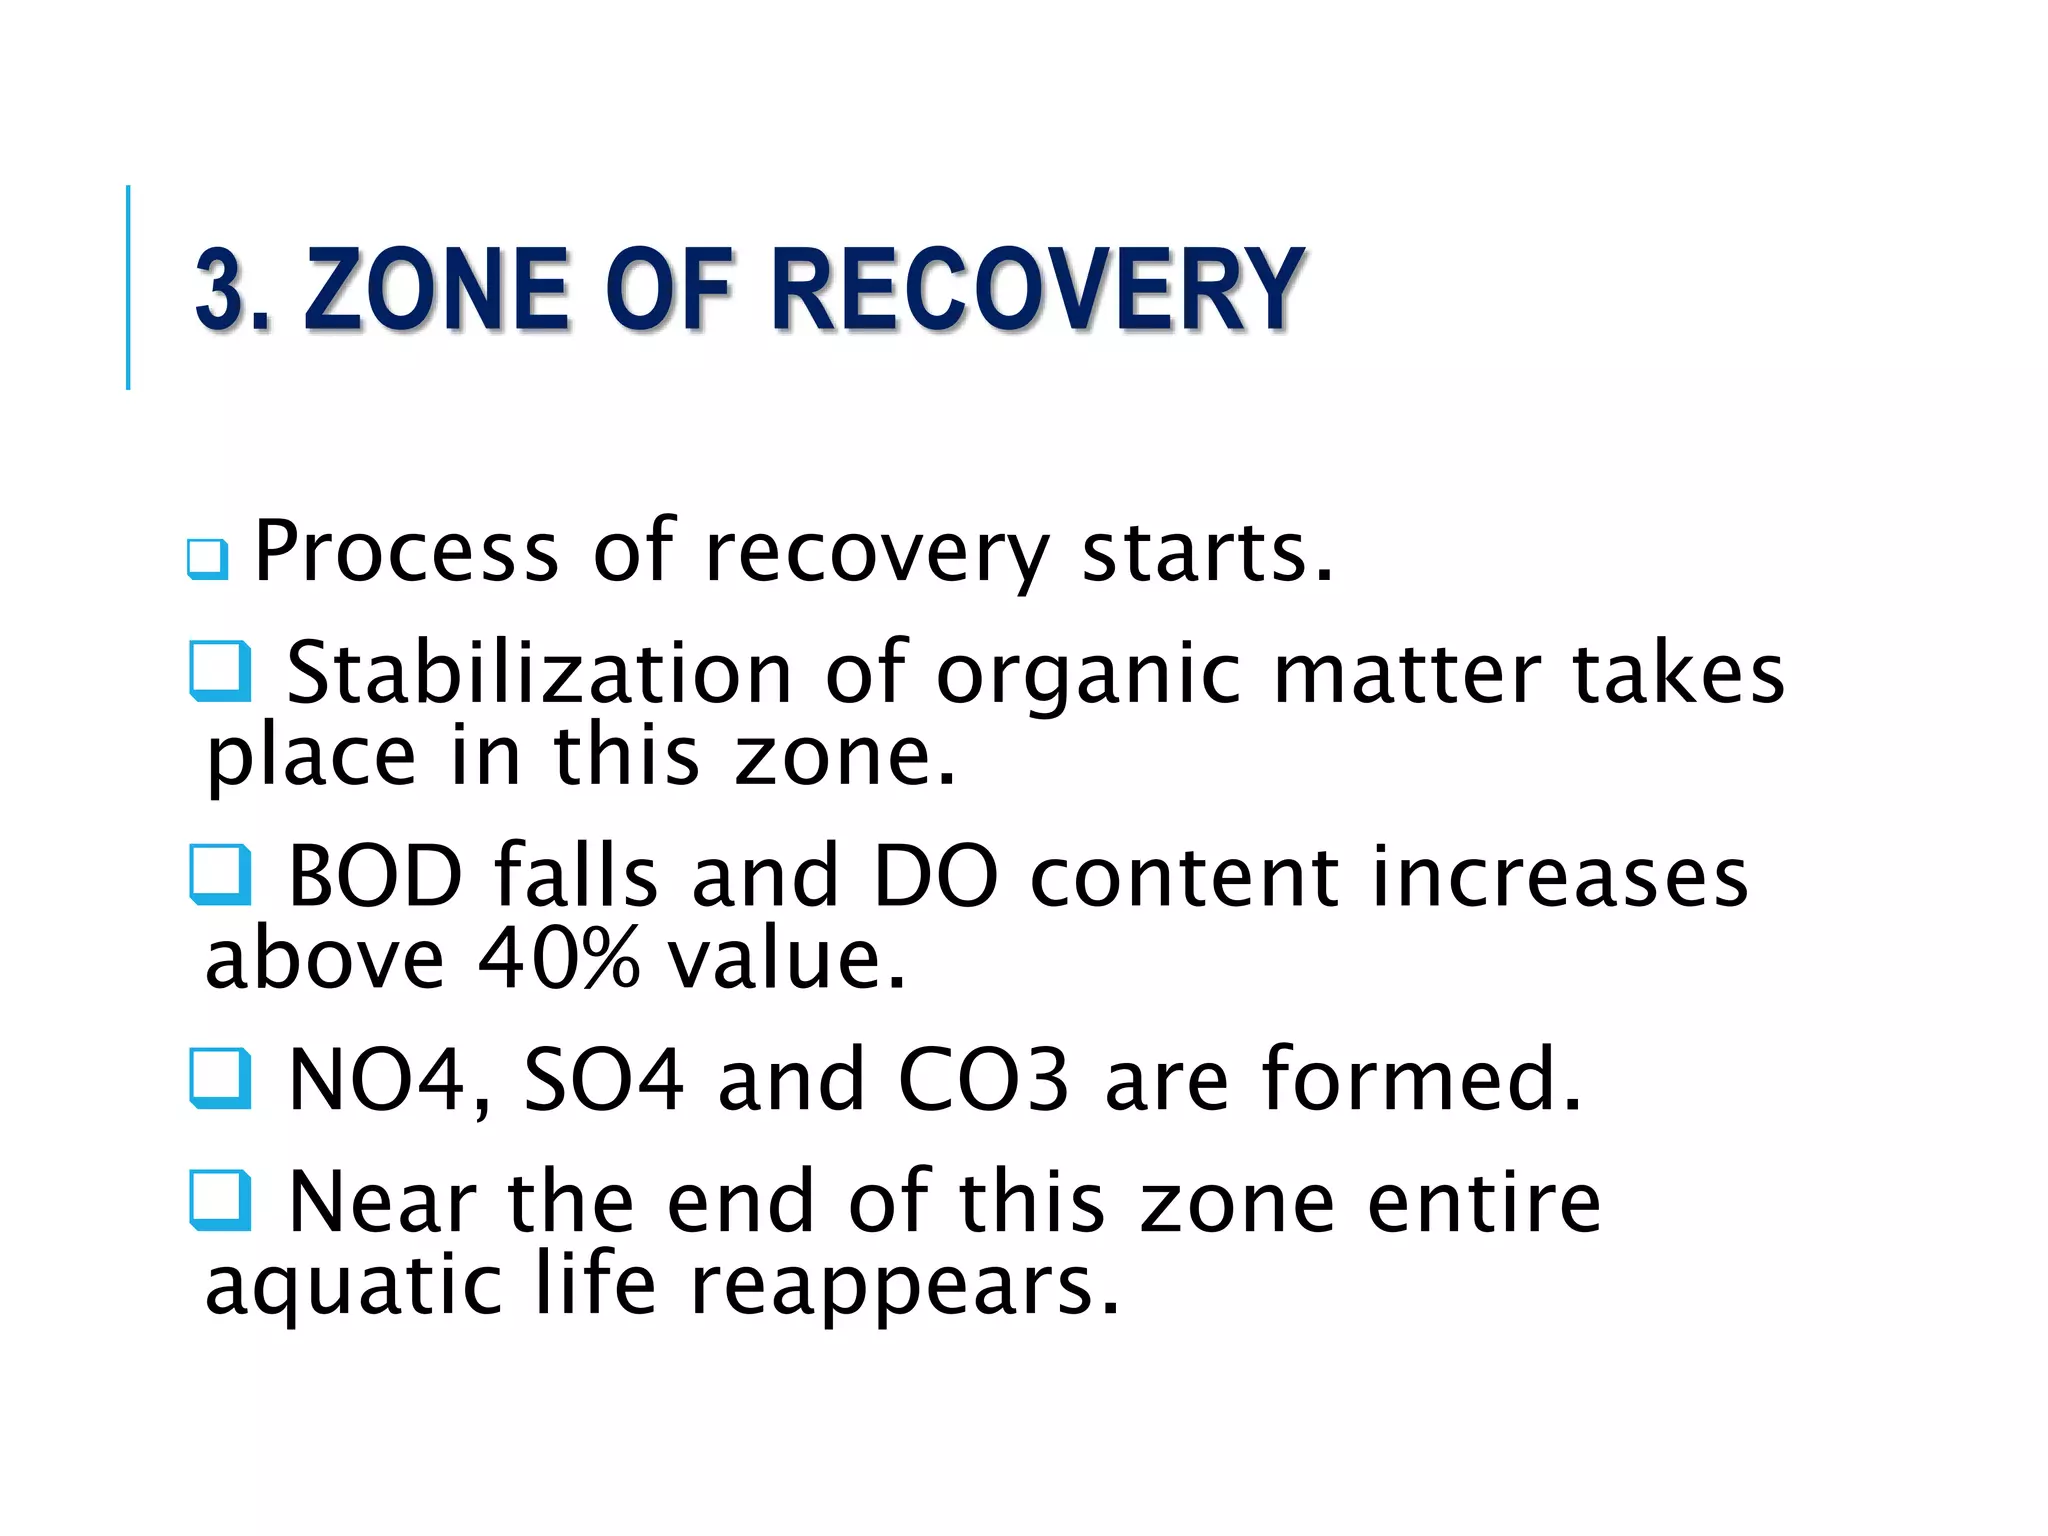
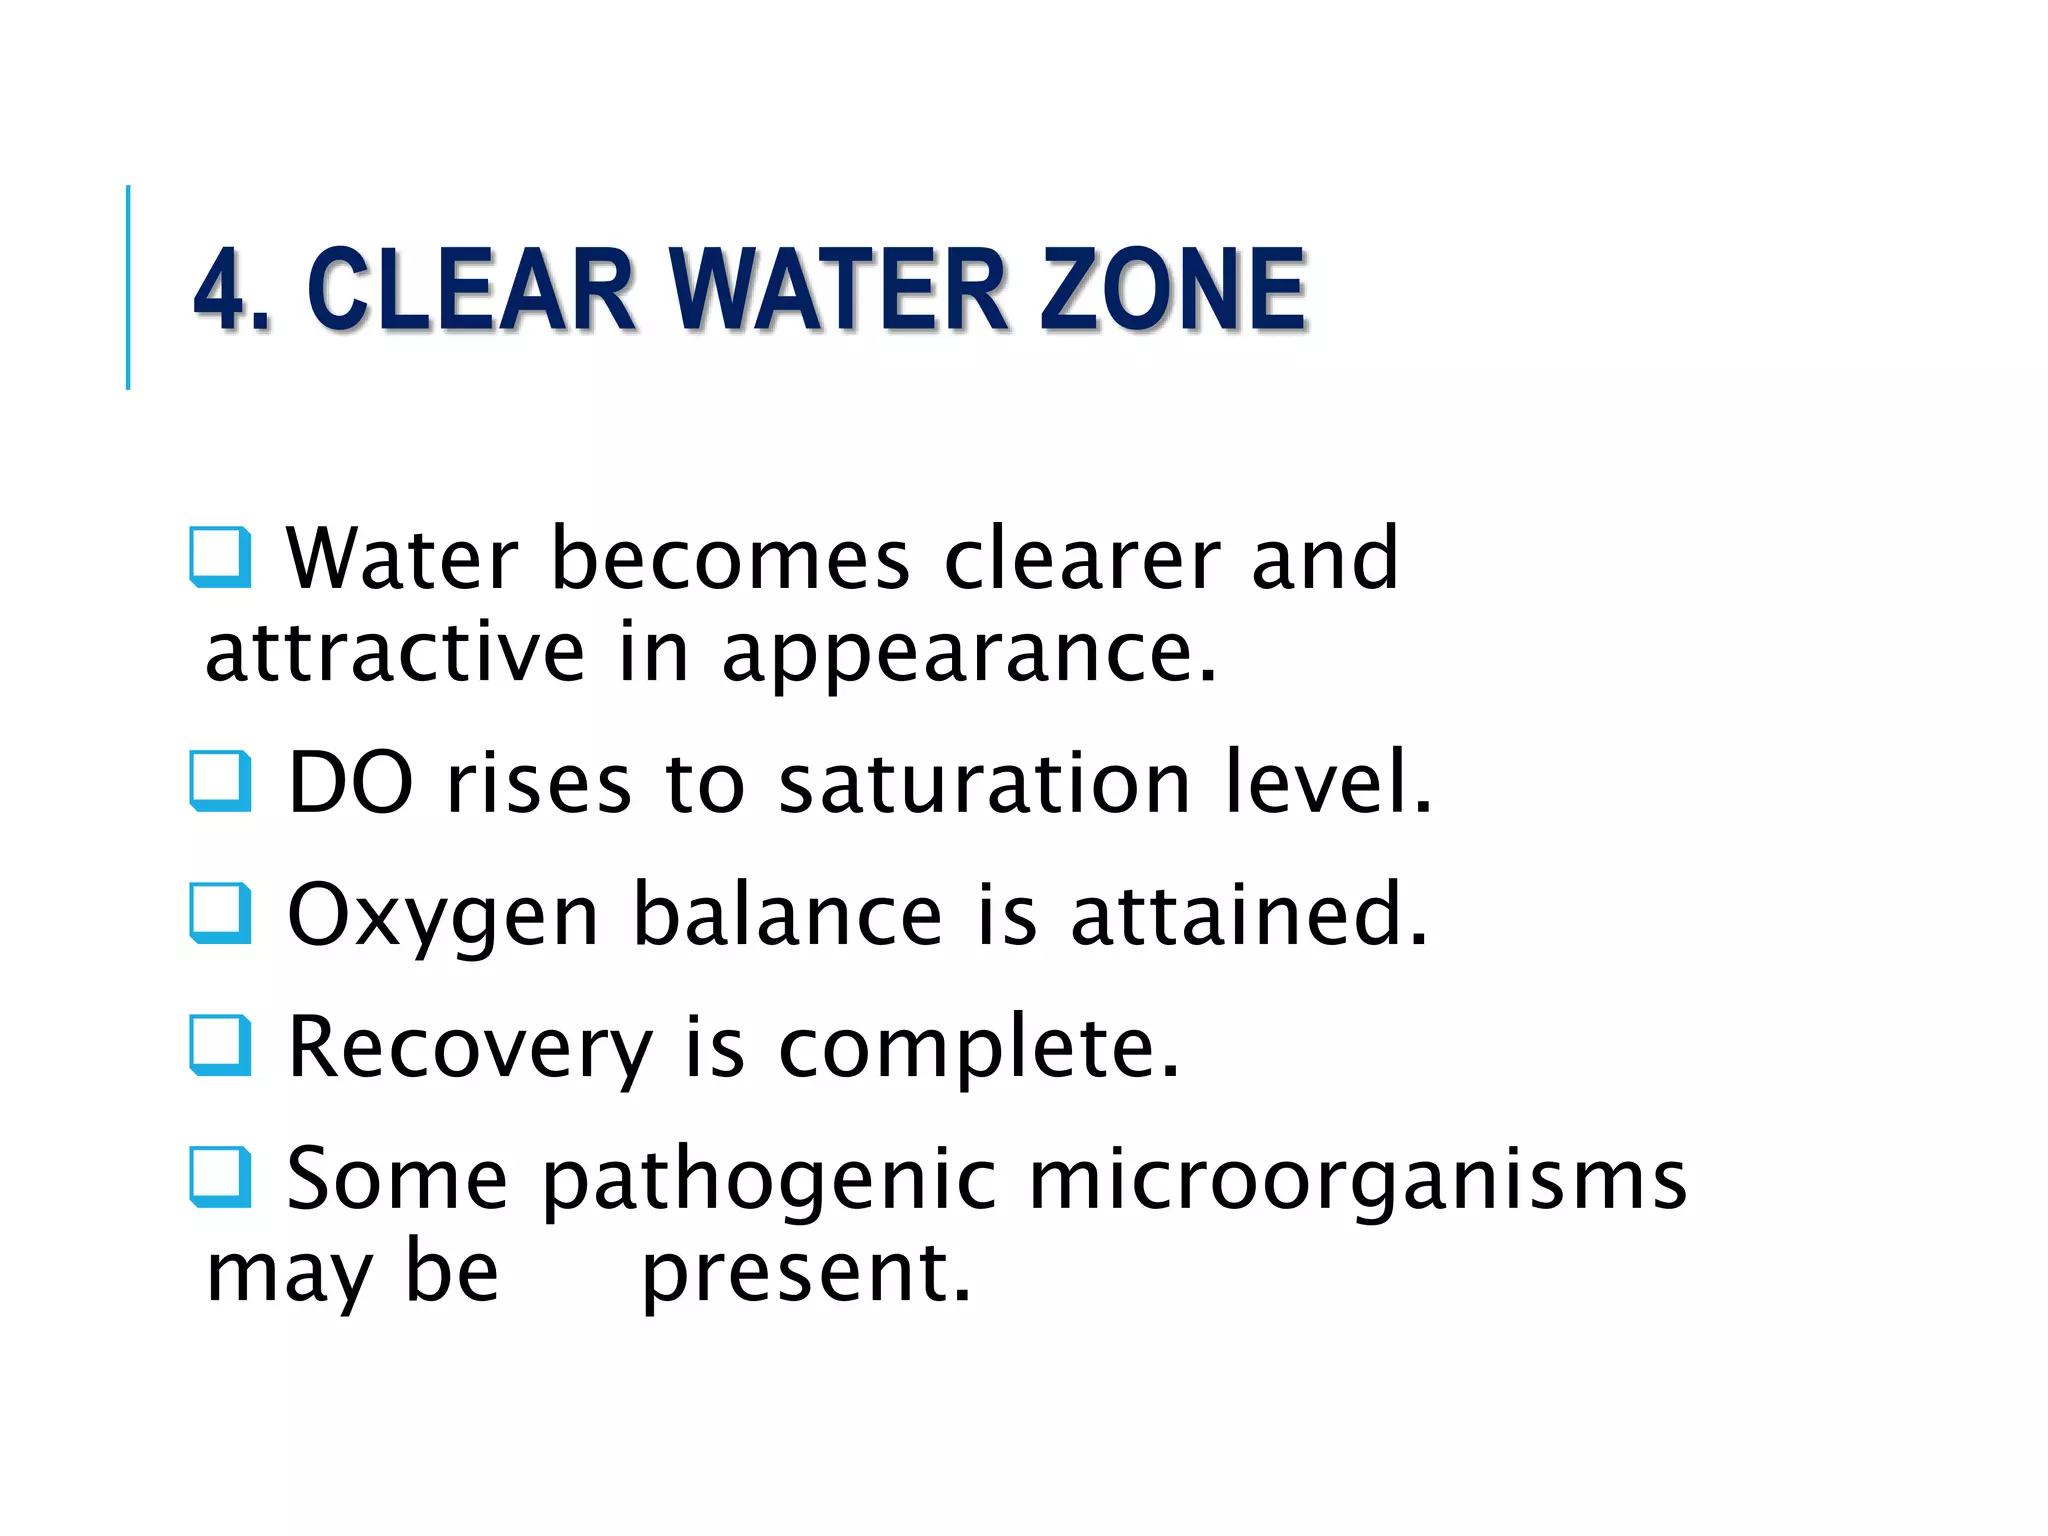
2. When wastewater is discharged into a stream, there are zones of degradation, active decomposition, and recovery before the stream reaches a clear water zone.
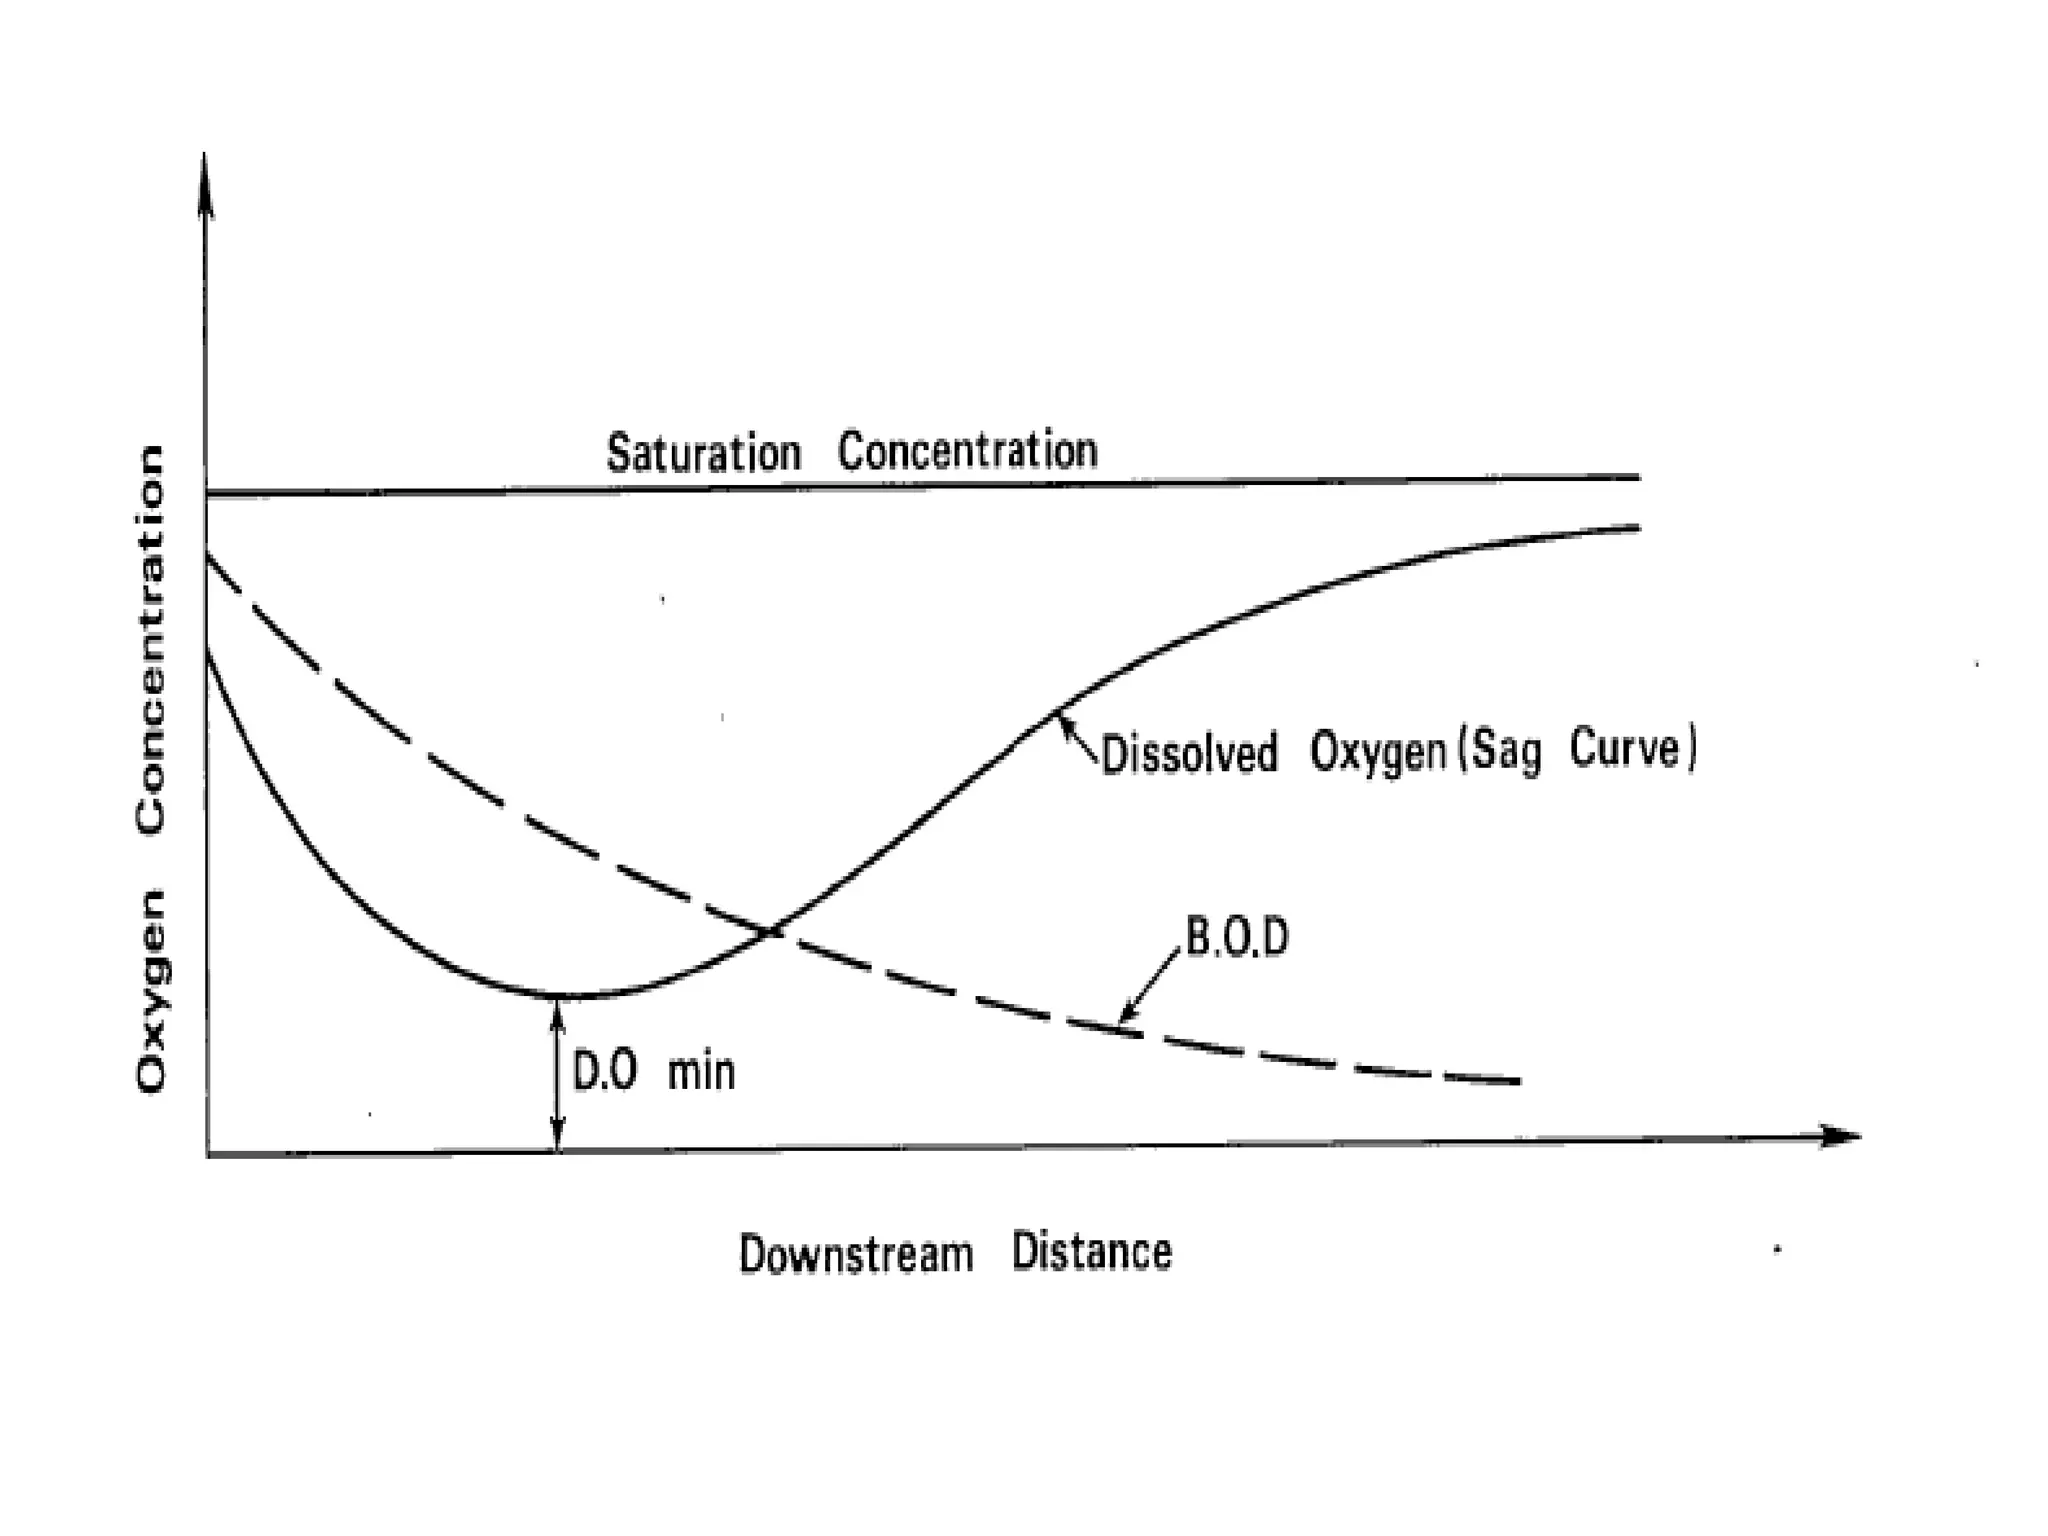
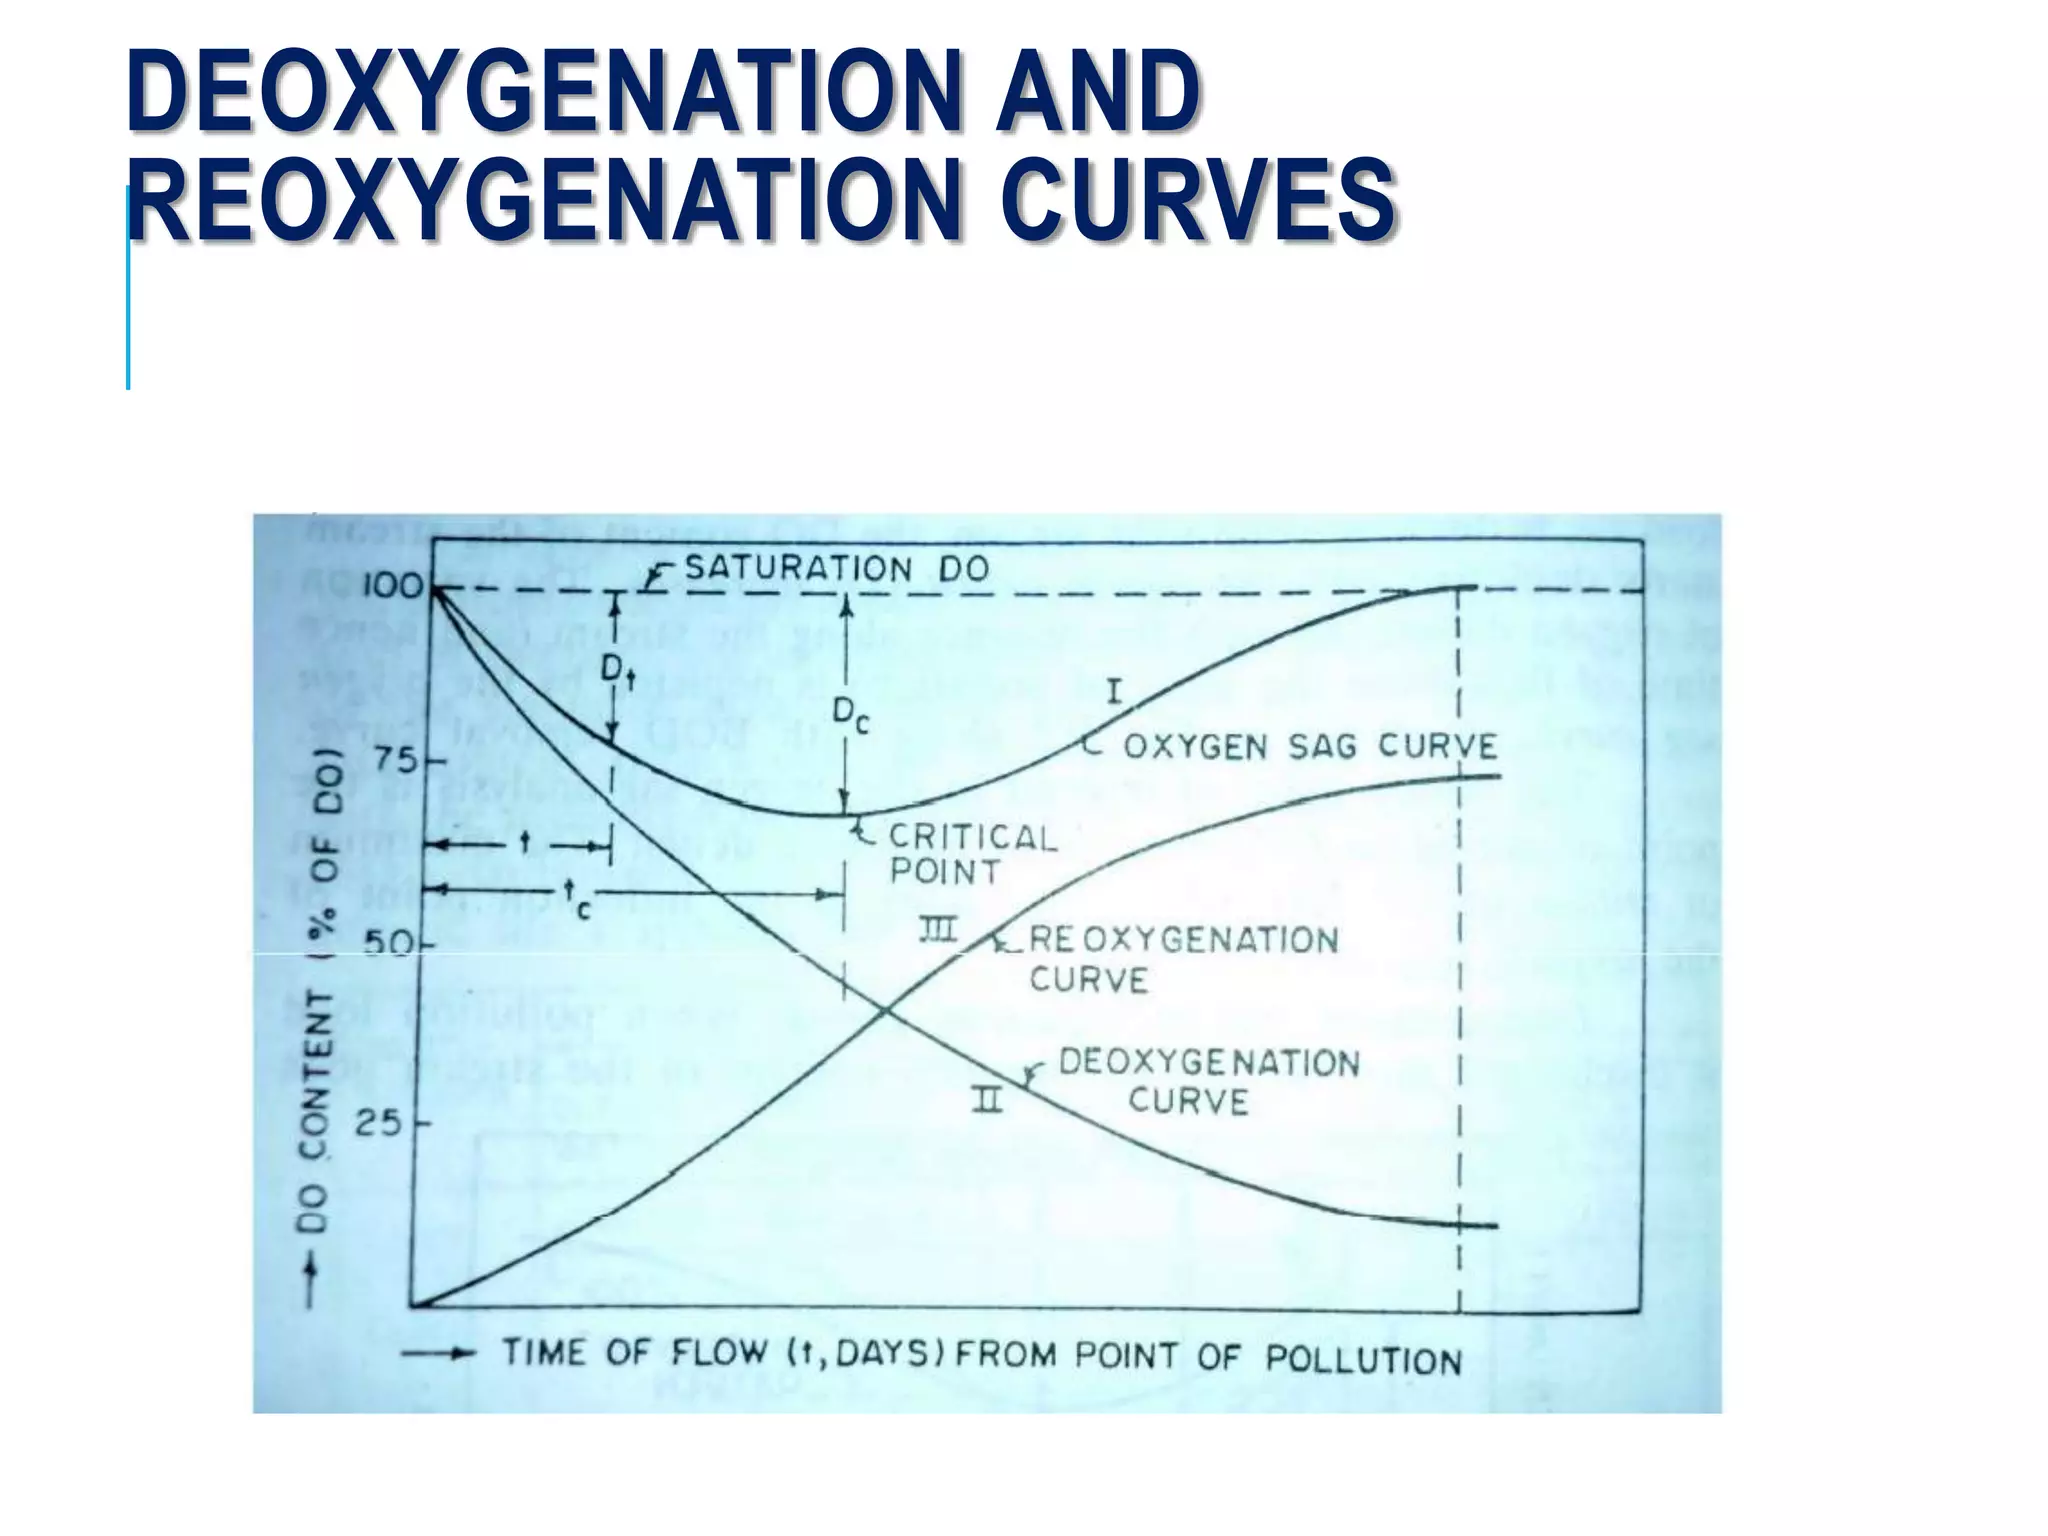
3. Dissolved oxygen levels in a stream typically follow a deoxygenation curve as organic matter is broken down, followed by a reoxygenation curve as oxygen is replenished, resulting in an overall DO sag curve.


![L 17 do sag [compatibility mode]](https://cdn.slidesharecdn.com/ss_thumbnails/l-17dosagcompatibilitymode-150311205622-conversion-gate01-thumbnail.jpg?width=640&height=640&fit=bounds)


