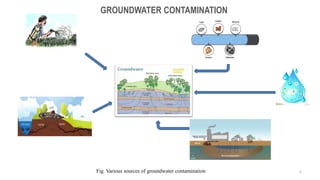
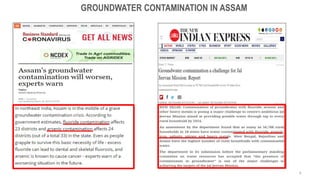
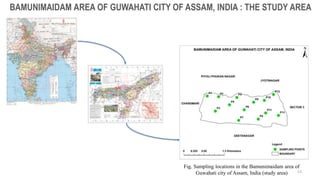
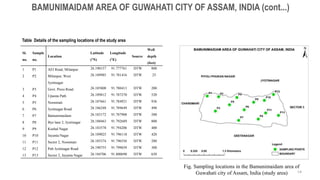
Roadmap to Membership of RICS - Pathways and Routes
PPT for project planning and design for engineers
1. GEOGRAPHIC INFORMATION SYSTEM BASED ASSESSMENT OF
GROUNDWATER QUALITY OF THE BAMUNIMAIDAM AREA OF GUWAHATI CITY
OF ASSAM, INDIA
Presented by
2. OUTLINE
■ Introduction
■ Literature review
■ Knowledge gap and need for the study
■ Research objectives and work frame
■ Study area and methodology
■ Results and discussions
■ Conclusion and future scope of work
■ References
2
3. DISTRIBUTION OF THE WATER ON EARTH
Ocean water: 97.2 percent
Glaciers and other ice: 2.15 percent
Groundwater: 0.61 percent
Fresh water lakes: 0.009 percent
Inland seas: 0.008 percent
Soil Moisture: 0.005 percent
Atmosphere: 0.001 percent
Rivers: 0.0001 percent.
Groundwater, which is in aquifers below the surface of
the Earth, is one of the world’s most important natural
resources.
More than 85% of India’s rural domestic water
requirements, 50% of its urban water requirements
and more than 50% of its irrigation requirements are
being met from groundwater resources (NRSA 2008;
Jha and Sinha 2009).
INTRODUCTION
30%
70%
World’s fresh water supply
Groundwater
Surface water
3
4. Present condition of groundwater in India
More than 85% of India’s rural domestic
water requirements, 50% of its urban water
requirements and more than 50% of its
irrigation requirements are being met from
groundwater resources (NRSA 2008; Jha and
Sinha 2009).
According to UNESCO World Water
Development Report, India is the largest
extractor of groundwater in the world.
GROUNDWATER USE
Present condition of groundwater in
Assam:
Assam has lost the maximum amount
of usable groundwater stock (between
2003 to 2015) in India (Mukherjee et al.
2019).
4
7. • Groundwater quality index (GWQI):
The groundwater quality index (GWQI) is a technique used to assess groundwater potability. It is a popular tool for evaluating
water quality which reflects the composite influence of different water quality parameters by only a single aggregate value and
the corresponding scale.
• The need for indexing:
It provides a quick and simple methodology to assess and identify the quality of water.
It is one of the most effective tools to communicate information on the quality of water to concerned citizens and policy
makers.
It gives us a better understanding of contamination levels. The rise in contamination levels in the water resources leads us
to adopt numerous monitoring approaches and it is now essential to be aware of how suitable the water is for different types
of use. Indexing serves as an important parameter for the proper assessment and management of groundwater.
7
GROUNDWATER QUALITY INDEX (GWQI)
8. Authors Study Findings
Stigter et al.
(2006)
Developed a simple methodology based on multivariate analysis to
create a GWQI and a composition index (GWCI), with the aim of
monitoring the joint influence of agriculture on several key parameters of
groundwater chemistry and potability.
• Groundwater quality in the upper aquifers was
extremely low, with an almost complete absence of
potable water.
• Impact of agricultural activity on the groundwater
composition showed large spatial variability,
accurately depicted by the GWQI maps and mainly
related to crop type and aquifer lithology.
Boyacioglu,
H., (2007)
Development of a new index called the ‘universal water quality index
(UWQI)’. This index has advantages over pre-existing indices by
reflecting the appropriateness of water for specific use, e.g. drinking
water supply rather than general supply, and has been developed by
studying the supranational standard, i.e. the European Community
Standard.
•Results revealed that the overall quality of the surface
water falls under the ‘excellent’ class. Water quality was
strongly affected by agricultural and domestic uses. It is
useful to determine the level of acceptability for the
individual parameter by referring to the concentration
ranges defined in the proposed classification scheme.
Sadashivaiah
et al. (2008)
Assessed the WQI for the groundwater of Tumkur taluk by subjecting
the samples to a comprehensive physicochemical analysis. For
calculating the WQI, 12 parameters were considered.
• The high value of WQI was found to be mainly from
the higher values of iron, nitrate, total dissolved solids,
hardness, fluorides, bicarbonate and manganese in
groundwater.
• The analysis revealed that the groundwater of the area
needs some degree of treatment before
consumption, and it also needs to be protected from
the perils of contamination.
LITERATURE REVIEW
8
9. Authors Study Findings
Pei-Yue et al. (2010) Carried out an assessment of groundwater quality in Pengyang County
based on an improved WQI. An information entropy method was
introduced to assign weight to each parameter. For calculating WQI and
assess the groundwater quality, total 74 groundwater samples were
collected and all these samples subjected to comprehensive
physicochemical analysis. Each of the groundwater samples was
analysed for 26 parameters and for computing WQI, 14 parameters
were chosen.
• Excellent quality water area covered nearly
90% of the whole region.
• High value of WQI was found to be closely
related with the high values of TDS, fluoride,
sulphate, nitrite and TH.
• In medium quality water area and poor
quality water area, groundwater needed
some degree of pretreatment before
consumption.
Saeedi et al. (2010) Developed a simple methodology based on multivariate analysis to
create a GWQI, with the aim of identifying places with best quality for
drinking within the Qazvin province, west central of Iran. The
methodology is based on the definition of GWQI using average value of
eight cation and anion parameters for 163 wells during a 3-year
period.
• The GWQI map revealed that groundwater
quality in two areas was extremely near to
mineral water quality.
• Created index map provided a
comprehensive picture of easily interpretable
for regional decision makers for better
planning and management.
Yisa et al. (2010) Targeted at evaluating the quality of River Landzu for public
consumption using the Water Quality Index (WQI). River Landzu is
particularly important in the study of surface water pollution because it
receives effluents from cottage businesses, municipal sewage,
agricultural, and urban run-off, all of which create significant changes in
water quality. The 120 water samples collected were subjected to a
detailed physicochemical analysis utilising APHA standard methods of
analysis.
• The samples had a WQI of 171.85. The
increased concentrations of iron, chromium,
and manganese, as well as COD and
turbidity, contributed to the WQI's high
rating. It was determined that the river was
polluted, and that the water was unsafe for
residential use and would require additional
treatment.
9
LITERATURE REVIEW (cont...)
10. Authors Study Findings
Kotoky et al.
(2017)
Carried out a GIS based study on the Hatigaon area of Guwahati City of
the state Assam, India to assess the groundwater quality with special
reference to fluoride contamination. Spatial variations in groundwater
quality were studied using GIS. For this study, a total of 115 groundwater
samples were collected from 115 pinpoint locations (wells) in the Hatigaon
area.
•The results revealed that fluoride contents in the
groundwater samples ranged between 0.22-11 mg/l.
The results obtained in this study and the spatial
database established in GIS proved to be helpful for
monitoring and managing groundwater contamination
due to fluoride in the study area.
Adimalla et al.
(2018)
Undertook a study on 105 groundwater samples collected from the rock
dominant semi-arid region of central Telangana and analysed for 12
parameters.
• 51% and 71% of groundwater has more than the
max. acceptable limits of fluoride (1.5 mg/l) and
nitrate concentrations (45 mg/l), thus making the
groundwater unsuitable for drinking purpose.
• According to WQI, 60% and 36% of
groundwater samples fell in excellent and good
categories for drinking purpose.
Verma et al.
(2020)
Conducted a study on 102 groundwater samples collected from the Bokaro
district of Jharkhand state, India, during the pre-and post-monsoon
seasons of the year 2014–2015. The samples were analysed for pH, TDS, TH,
calcium, magnesium, sodium, potassium, chloride, sulphate, bicarbonate,
fluoride and nitrate to evaluate the suitability of the groundwater for
drinking purposes through GIS based water WQI model.
• Poor quality of water was found the maximum in
the pre monsoon season as compared to the post
monsoon season in the study area.
• Water is not suitable for direct consumptions and
requires sustainable treatment before its utilization
for drinking uses.
10
LITERATURE REVIEW (cont...)
11. • There is no indexing of groundwater quality of the
Bamunimaidam area of Guwahati city of Assam,
India.
• A reliable monitoring of various water quality
parameters of the groundwater of the Bamunimaidam
area is not available. Even the topmost organizations
in Assam responsible for carrying out water quality
analysis take into account only few parameters.
• No study or literature is available to cite the detection
of the water quality parameters that can be found in
high levels in this Bamunimaidam area causing health
and environmental hazards.
• The implications of the groundwater quality on the
people and environment still remain a query to be
addressed.
KNOWLEDGE GAP NEED FOR THE STUDY
• Mainstream of the population of the Bamunimaidam area
of Guwahati city of Assam, India use groundwater as a
source for various water usages (CGWB).
• Assam is one of the fluoride, arsenic, and iron affected
states.
• The Bamunimaidam area has been deprived of
appropriate and reliable measures for management and
monitoring of groundwater resources with respect to its
water quality.
• No study is available to know the scenario of
groundwater quality of the Bamunimaidam area.
• No study has been done for water quality index of
groundwater of the Bamunimaidam area for drinking
purpose that will be useful for the public.
11
12. The research objectives are:
• Assessment of groundwater quality of
the Bamunimaidam area of Guwahati
city of Assam, India (study area) for
drinking purpose.
• Groundwater quality indexing for
drinking purpose by conventional index
method.
• Using GIS to make the groundwater
quality index map to assess the potable
and non-potable groundwater quality
zones.
RESEARCH OBJECTIVES AND WORK FRAME
12
Fig. Work frame
Collection of groundwater
samples
• Groundwater samples of Bamunimaidam area of
Guwahati city of Assam, India (study area) are
collected for monsoon season of the year 2023.
Data generation by
experimental analysis
• Groundwater quality is determined by assessing
20 water quality parameters, such as: pH, EC,
TDS, turbidity, TH, TA, Na+, Ca2+, Mg2+, K+, F-,
NO3
-, Cl-, SO4
2-, HCO3
-, As, Pb, Fe, Mn and Zn
Indexing of groundwater
quality for drinking purpose
and GIS based mapping
• Conventional index method was used to do
zonation of groundwater in the study area
for drinking purpose and using GIS to make
the GWQI map.
13. BAMUNIMAIDAM AREA OF GUWAHATI CITY OF ASSAM, INDIA : THE STUDY AREA
Fig. Sampling locations in the Bamunimaidam area of
Guwahati city of Assam, India (study area) 13
14. BAMUNIMAIDAM AREA OF GUWAHATI CITY OF ASSAM, INDIA (cont...)
Fig. Sampling locations in the Bamunimaidam area of
Guwahati city of Assam, India (study area) 14
Sl.
no.
Sample
no.
Location
Latitude
(°N)
Longitude
(°E)
Source
Well
depth
(feet)
1 P1 AEI Road, Milanpur 26.190157 91.777761 DTW 800
2 P2 Milanpur, West
Jyotinagar
26.189985 91.781416 DTW 25
3 P3 Govt. Press Road 26.185808 91.780413 DTW 200
4 P4 Upasna Path 26.189812 91.787270 DTW 520
5 P5 Noonmati 26.187661 91.784921 DTW 936
6 P6 Jyotinagar Road 26.186248 91.789649 DTW 490
7 P7 Bamunimaidam 26.183172 91.787908 DTW 500
8 P8 Bye lane 2, Jyotinagar 26.188463 91.792689 DTW 800
9 P9 Kushal Nagar 26.183578 91.794206 DTW 400
10 P10 Jayanta Nagar 26.189025 91.796118 DTW 420
11 P11 Sector 2, Noonmati 26.185374 91.796556 DTW 280
12 P12 Pub Jyotinagar Road 26.190755 91.799039 DTW 300
13 P13 Sector 2, Jayanta Nagar 26.184706 91.800690 DTW 650
Table Details of the sampling locations of the study area
16. Parameter Abbreviation Instrument/method used
Total hardness and total
alkalinity
TH and TA,
respectively
Titrimetric method
pH pH µ pH system 361
Electrical Conductivity and
total dissolved solids
EC and TDS,
respectively
Digital conductivity meter
Turbidity Tur
Nephelometric turbidity
meter
Fluoride F-
792 basic IC
Chloride Cl-
Nitrates NO3
-
Sulphates SO4
2-
Sodium Na+
Flame photometer
Potassium K+
Calcium Ca2+
Iron Fe
Atomic absorption
spectroscopy (AAS)
Magnesium Mg
Manganese Mn
Lead Pb
Arsenic As
Zinc Zn
Bicarbonate HCO3
- Empirical formula
Table: Required instruments/methods for analysis
16
Groundwater samples were collected for
analysis of 20 water quality parameters for
the monsoon season. The 20 water quality
parameters are:
pH, electrical conductivity (EC), turbidity
(Tur), total hardness (TH), total alkalinity
(TA), total dissolved solids (TDS), calcium
(Ca2+), sodium (Na+), potassium (K+),
fluoride (F-), chloride (Cl-), sulphate (SO4
2),
nitrate (NO3
-), bicarbonate (HCO3
-),
magnesium (Mg2+), lead (Pb), iron (Fe),
manganese (Mn), zinc (Zn) and arsenic
(As).
METHODOLOGY
17. 17
GROUNDWATER QUALITY INDEX COMPUTATION
For computing GWQI, 3 steps are followed.
In the first step, each of the water quality parameters are assigned a weight (wi) according to its relative importance in the
overall quality of groundwater.
In the second step, the relative weights were (Wi)is computed from the following equation:
Wi=wi/∑n
i=1wi (1)
Where, Wi is the relative weight; wi is the weight of each parameter; and n is the number of parameters.
In the third step, a quality rating scale (qi) for each parameter is assigned by dividing its concentration in each groundwater
sample by its respective standard according to the guidelines laid down in the BIS 10500:2012 and the result is multiplied by
100.
qi=(Ci/Si)×100 (2)
Where, qi is the quality rating; Ci is the concentration of each parameter in each groundwater sample in mg/l; and Si is
the Indian drinking water quality standard for each parameter in mg/l according to the guidelines of the BIS 10500:2012.
For computing the GWQI, the SI is first determined for each parameter, which is then used to determine the GWQI as per the
following equation.
SIi=Wi×qi (3)
GWQI=∑SIi (4)
Where, SIi is the sub-index of ith parameter; qi is the rating based on concentration of ith parameter.
18. GROUNDWATER QUALITY INDEX COMPUTATION (cont...)
Parameters Weight (wi) Relative weight (Wi)
pH 4 0.056
TDS 4 0.056
Turbidity 3 0.042
TH 3 0.042
TA 4 0.056
Na+ 3 0.042
Ca2+ 3 0.042
K+ 3 0.042
F- 5 0.069
NO3
- 5 0.069
Cl- 3 0.042
SO4
2- 3 0.042
Mg2+ 3 0.042
Mn 3 0.042
Fe 3 0.042
Pb 5 0.069
As 5 0.069
Zn 3 0.042
EC 3 0.042
HCO3
- 4 0.056
Sum= 72 1
Table. Water quality parameters and their relative weights
Range Type of groundwater
<50 Excellent
50-100 Good
100.01-200 Poor
200.01-300 Very poor
>300 Unsuitable for drinking purposes
Table. Range of GWQI and type of groundwater
In the GIS based spatial distribution mapping of GWQI, the
groundwater zones having GWQI value less than 50 (represented as
excellent quality groundwater) will be depicted in blue colour,
zones having GWQI value in the range 50-100 (represented as good
quality groundwater) in green colour, zones having GWQI value in
the range 100.01-200 (represented as poor quality groundwater) in
yellow colour, zones having GWQI value in the range 200.01-300
(represented as very poor quality groundwater)in orange colour; and
zones having GWQI value more than 300 (represented as unsuitable
for drinking purposes) in red colour.
18
21. 21
GROUNDWATER QUALITY OF THE BAMUNIMAIDAM AREA
* The units are in mg/l except pH, EC and turbidity. The unit for turbidity is NTU, EC is μS/cm and pH is unitless.
Minimum Maximum Mean Std. Deviation
Tur 0 28 2 8
EC 219 619 443 120
TDS 140 396 284 77
pH 5.46 6.70 6.21 0.39
TA 58 198 125 53
TH 106 148 130 13
Ca2+
17.0 53.2 35.4 10.5
Mg2+
8.2 22.8 14.2 4.5
Na+
0 0 0 0
K+
0 0 0 0
F-
0.10 1.70 0.59 0.60
NO3
-
0 0 0 0
Cl-
13.80 82.90 43.58 26.16
SO4
2-
7.40 77.80 28.25 22.67
HCO3
-
70.76 241.56 152.97 64.84
Fe 0.02 1.30 0.13 0.35
Mn 0 0 0 0
As 0 0 0 0
Pb 0 0 0 0
Zn 0 0 0 0
Table: Statistics of the analysed concentrations of the water quality parameters of groundwater of the Bamunimaidam area
22. 22
GROUNDWATER QUALITY OF THE BAMUNIMAIDAM AREA (cont...)
• In the present study, the decrease in pH values of groundwater samples could be due to higher amounts of various
salts and minerals in the study area’s groundwater (Anwar, K. M., and Aggarwal, V. 2016).
• The higher EC values of groundwater samples could be due to higher levels of various salts and minerals in the
groundwater, as well as increased water mobility, which speeds up more rock-water contact in the study area (Anwar, K.
M., and Aggarwal, V. 2016).
• TDS levels of the groundwater of the study area are under the permissible limit in the monsoon season. TDS levels
are due to groundwater depletion during the dry season, salt leaching and dissolving from rocks and soil, and human-
induced activities (Sharma, D. A., et al. 2016). One of the main explanations for the increase in TDS levels during lean
periods could be runoff from home sewage that seeps into the groundwater.
23. 23
GROUNDWATER QUALITY OF THE BAMUNIMAIDAM AREA (cont...)
• Except for one location, there is no turbidity in the groundwater of the study area due to very low precipitation
infiltration into groundwater. Turbidity in groundwater decreases as deposition time increases, which explains the
downward trend in turbidity over the lean era (Azis, A., et al. 2015).
• TH values are found under the permissible limit in the groundwater of the study area. TH found in this study can be
attributed to the fact that TH in groundwater is primarily due to calcium carbonates and bicarbonates, with magnesium
carbonates and bicarbonates coming in second. (Pal, P. 2017). Furthermore, Ca2+ ion levels are observed in the
groundwater of the study area, implying that TH levels are are there.
• Because the pH of the groundwater is determined to be in the acidic range, TA levels are likewise low.
24. 24
GROUNDWATER QUALITY OF THE BAMUNIMAIDAM AREA (cont...)
• Potential municipal sources of Ca2+ ions in groundwater, such as sewage, home waste, and industrial waste,
contribute a complicated quantity of Ca2+ ions to groundwater, resulting in the formation of ionic pollutants. Because of
the leaching process, the concentration of Ca2+ ions in groundwater may be higher during the pre-monsoon season than
during the monsoon season (Baysal, A., et al. 2013).
• Mg2+ containing minerals, ion exchange of minerals from rocks, and animal, household, and industrial squanders are
the main sources of Mg2+ in this area’s groundwater.
• K+ concentrations are not found in the groundwater of the study area, which could be due to non presence of
eugenically occurring salt scrapes and no fertilizer percolating/leaching into the subsurface.
25. 25
GROUNDWATER QUALITY OF THE BAMUNIMAIDAM AREA (cont...)
• In India, it is widely accepted that higher fluoride levels in groundwater are due to geogenic processes, primarily
from rocks containing high quantities of fluorine-containing minerals (Mukherjee, I., and Singh, U. K. 2018). Granitic and
gneisses rocks dominate the research area, and these rocks include a significant amount of high fluorine minerals (Kotoky,
P., et al. 2017).
• In the study area’s groundwater, nitrate is found to be absent. The absence of NO3
- could be attributed to no leaching
from plant nutrients and NO3
- fertilisers in farming areas (WHO 1993; WHO 2004).
• Leaching from gangrenous cisterns, family and animal wastes, community sewages, farming, and fertilisers could all
contribute to very low Cl- levels in groundwater (Appelo, C. A. J., and Postma, D. 1996; Narsimha, A., and Sudarshan, V.
2013; Adimalla, N., and Venkatayogi, S. 2018).
26. 26
GROUNDWATER QUALITY OF THE BAMUNIMAIDAM AREA (cont...)
• Rainfall, dissolution of Mn in minerals from nearby rocks, and leaching of Mn in percolating through soils all
contribute to Mn in groundwater (Weng, H. X., et al. 2007; Luzati, S., et al. 2016). Mn concentrations are absent in
groundwater of the study area.
• Higher Fe concentrations in the aquifers could have occurred through interactions between oxidized Fe minerals and
organic matter, followed by Fe2CO3 dissolution at a lower pH. When this type of water is originally extracted from the
well, it is clear, but it quickly becomes hazy and eventually brown due to Fe(OH)3 precipitation, which is a typical
problem in groundwater (Mondal, N. C., et al. 2010). Another reason for the high Fe concentration could be the organic
matter's elimination of dissolved oxygen, resulting in lowered circumstances. The solubility of Fe-bearing minerals
(siderite, marcacite, etc.) rises under reducing circumstances, resulting in an enrichment of dissolved Fe in groundwater
(Applin, K. R., and Zhao, N. 1989).
27. 27
GROUNDWATER QUALITY OF THE BAMUNIMAIDAM AREA (cont...)
• The release of Pb through sediment adsorption, dust transported via atmospheric and continental crust erosion,
precipitation and deposition of airborne particles, and lead availability in global pollution may all contribute to Pb in
groundwater (Dodge, R. E., and Brass, G. W. 1984; Erel, Y., and Patterson, C. C. 1994). Pb is found to be absent in the
groundwater of the study area.
• Organic metal complexes and inorganic ions are both anthropogenic sources of As (Pal, P., et al. 2009; Ramesh, R.,
et al. 1995; Mondal, N. C., et al. 2010). As is found to be absent in the groundwater of the study area.
• Zn is used as an anticorrosion agent, and galvanized pipelines are employed in the building of the boreholes. Zn
could be discharged into the groundwater due to corrosion of pump parts (Mondal, N. C., et al. 2010). Because of its
limited mobility from the area of rock weathering or natural sources, Zn is present in very low concentrations (BIS 1998).
29. CLASSIFICATION PERCENTAGE
Excellent ( < 50) 92.31 %
Good ( 50 - 100) 0 %
Poor ( 100.01 - 200) 7.69 %
Very Poor ( 200.01 - 300) 0 %
Unsuitable ( > 300) 0 %
GROUNDWATER QUALITY INDEX FOR THE BAMUNIMAIDAM AREA
29
30. • The groundwater quality parameters such as electrical conductivity, total dissolved solids, total hardness, sodium, calcium,
potassium, magnesium, fluoride, sulphate, chloride, nitrate, manganese and iron are found to have higher concentrations.
• On the basis of the conventional method of groundwater quality indexing using GIS, it was observed from the GIS based map
that the quality of groundwater is mostly good (for drinking purpose) in the Bamunimaidam area during the monsoon season.
• The results of this study also show that using GIS to assess groundwater quality can provide useful information. These GIS
based methodologies have proven to be effective in mapping groundwater quality in the research locations. The regional
variation map of the groundwater quality index in the research area indicated that the majority of the groundwater samples met
the I.S. 10500:2012 and WHO drinking water quality requirements.
• The groundwater quality scenario in the Bamunimaidam area demands for continuous monitoring and groundwater quality
enhancement methodologies. The study also suggests the decreasing use of groundwater as there are plenty of surface water
bodies in Assam.
CONCLUSION
30
31. • Groundwater quality indexing using other methods, such as principal component analysis (multivariate statistical technique),
entropy method etc.
• Groundwater assessment for drinking purpose of the remaining areas of Assam.
• Groundwater assessment and indexing for irrigation purpose.
FUTURE SCOPE OF WORK
31
32. APHA (2012) Standard methods for the examination of water and wastewater vol 22. 22nd Edition edn.
Banerji, S., & Mitra, D. (2019). Geographical information system-based groundwater quality index assessment of northern part of Kolkata, India for drinking
purpose. Geocarto International, 34(9), 943-958.
BIS IS10500, 2012. Indian Standard Drinking Water–Specification (Second revision). Bureau of Indian Standards (BIS), New Delhi, India.
Chumi K. (2015), A Study on Drinking Water Quality Parameters in Palashbari Area, Kamrup District (Rural), Assam, Volume: 2, Issue: 9, 478-480 Sep 2015
www.allsubjectjournal.com e-ISSN: 2349-4182 p-ISSN: 2349-5979.
Fagbote, E. O., Olanipekun, E. O., & Uyi, H. S. (2014). Water quality index of the ground water of bitumen deposit impacted farm settlements using entropy weighted
method. International Journal of Environmental Science and Technology, 11(1), 127-138.
Gorgij, A. D., Kisi, O., Moghaddam, A. A., & Taghipour, A. (2017). Groundwater quality ranking for drinking purposes, using the entropy method and the spatial
autocorrelation index. Environmental earth sciences, 76(7), 269.
Haloi, N. and Sarma, H.P. (2011): “Ground Water Quality Assessment of some parts of Brahmaputra Flood plain in Barpeta district, Assam with special focus on Fluoride,
Nitrate, Sulphate and Iron analysis”, International Journal of ChemTech Research, Vol. 3, No.3, pp 1302-1308.
Kotoky P., “Assessment and Mapping of Groundwater Quality and Water Quality Index of The Brahmaputra River of The Kamrup Metro District of Assam, India Using
Geographic Information System”, M.E. dissertation submitted to Assam Engineering College under Gauhati University, 2017.
Manoshi Lahkar and Krishna G. Bhattacharyya.(2015). Assessment of Groundwater Quality in Nagaon District of Assam, India, with Special Reference to Fluoride. ISBN:
978-81-930585-8-9.
Mukherjee A et al. (2006) Arsenic contamination in groundwater: a global perspective with emphasis on the Asian scenario Journal of Health, Population and Nutrition:142-163
REFERENCES
32
33. NRSA G (2008) of India Ground Water Prospect Mapping for Rajib Gandhi National Drinking Water Mission 256.
Selvam S, Manimaran G, Sivasubramanian P, Balasubramanian N, Seshunarayana T (2014) GIS-based evaluation of water quality index of groundwater resources around
Tuticorin coastal city, South India Environmental earth sciences 71:2847-2867
Shannon, C.E., Weaver, W. and Burks, A.W., 1951. The mathematical theory of communication.
Remesan, R., & Panda, R. K. (2007). Groundwater quality mapping using GIS: A study from India's Kapgari watershed. Environmental Quality Management, 16(3), 41-60.
Uddin, M. G., Nash, S., and Olbert, A. I. (2020), “A review of water quality index models and their use for assessing surface water quality.” Ecological Indicators, Volume 122,
2021, 107218, ISSN 1470-160X
Wu, J., Xue, C., Tian, R. and Wang, S., 2017. Lake water quality assessment: a case study of Shahu Lake in the semiarid loess area of northwest China. Environmental Earth
Sciences, 76(5), 232.
33