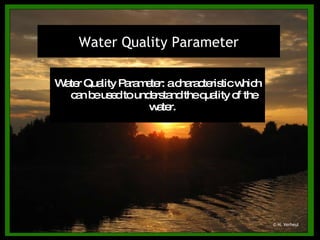
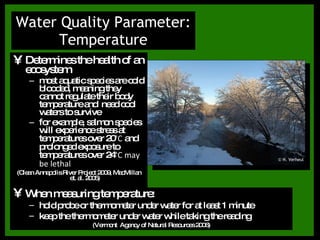
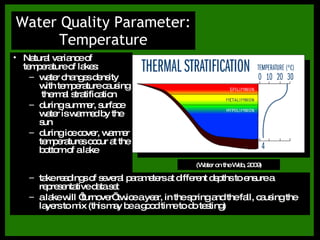
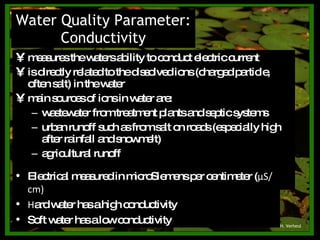
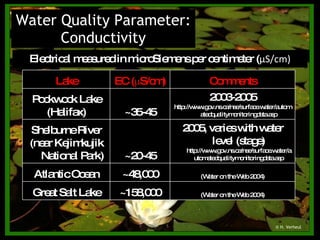
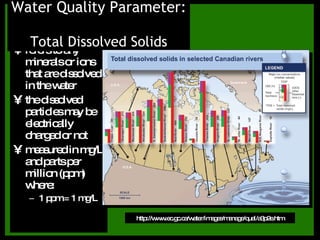
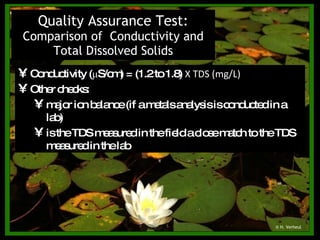
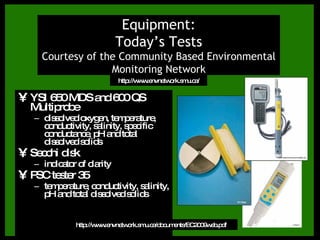
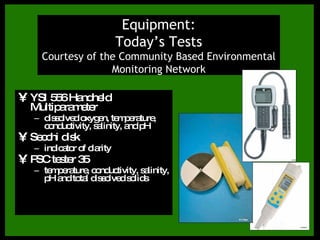
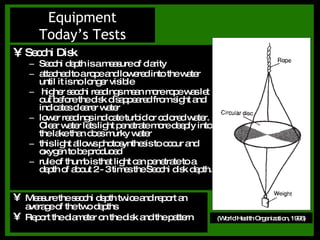
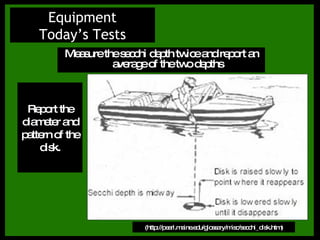
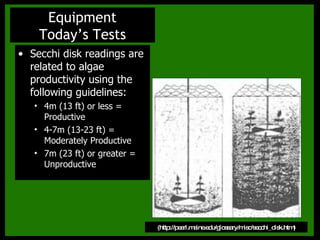
Water Quality Testing Session © H. Verheul
Water Quality Parameter: a characteristic which can be used to understand the quality of the water.  Water Quality Parameter © H. Verheul
Determines the health of an ecosystem most aquatic species are cold blooded, meaning they cannot regulate their body temperature and  need cool waters to survive for example, salmon species will experience stress at temperatures over 20°C and prolonged exposure to temperatures over 24°C may be lethal (Clean Annapolis River Project 2009, MacMillan et. al. 2005) Water Quality Parameter: Temperature When measuring temperature: hold probe or thermometer under water for at least 1 minute keep the thermometer under water while taking the reading (Vermont  Agency of Natural Resources 2006) © H. Verheul
Water Quality Parameter: Temperature (Water on the Web, 2009) Natural variance of temperature of lakes: water changes density with temperature causing  thermal stratification during summer, surface water is warmed by the sun  during ice cover, warmer temperatures occur at the bottom of a lake take readings of several parameters at different depths to ensure a representative data set a lake will ‘turnover’ twice a year, in the spring and the fall, causing the layers to mix (this may be a good time to do testing)
Water Quality Parameter: Temperature temperature affects other parameters such as pH, dissolved oxygen and nutrient levels water temperature may also be affected by industrial or municipal effluents or runoff that flows over warm concrete or pavement measurable thermal pollution may rarely occur, slight changes in temperature may add to effects already being caused by other types of pollution long-term monitoring of temperature may be useful in determining the effects of climate change © H. Verheul
Clarity clarity is affected by algae, soil particles, and other materials suspended in the water  secchi disk depth is primarily used as an indicator of algae abundance and general lake productivity. Although it is only an indicator, it is the simplest and one of the most effective tools for estimating a lake's productivity. Water Quality Parameter: Clarity (Water on the Web, 2009) Productivity the growth rate of organisms © H. Verheul
A measure of the acidity of water.  It affects the biological and chemical processes in water Measured with a pH meter Water Quality Parameter: pH http://www.ec.gc.ca/water/en/manage/qual/e_ph.htm
Effects of ph After: http://www.ec.gc.ca/acidrain/acidwater.html Effects of pH
pH can be influenced by: rainfall (acid rain) the type of bedrock limestone can help neutralize the water granite has little effect on pH dumping of chemicals by individuals, industries, and communities acid mine drainage or acid rock drainage Water Quality Parameter: pH © H. Verheul
Effects of Acid Rain in Nova Scotia http://www.novascotiasalmon.ns.ca/newsandissues/acidrain_map.htm
when dissolved oxygen in water is too low aquatic life, such as fish, suffocate. levels below 60% saturation are known to cause stress to aquatic life. Water Quality Parameter: Dissolved Oxygen Canadian  Water Quality Guidelines for the Protection of Aquatic Life (2007) : warm water:  early life stages: 6 mg/L other life stages: 5.5 mg/L cold water:  early life stages: 9.5 mg/L other life stages: 6.5 mg/L
measures the waters ability to conduct electric current is directly related to the dissolved ions (charged particle, often salt) in the water main sources of ions in water are: wastewater from treatment plants and septic systems urban runoff such as from salt on roads (especially high after rainfall and snowmelt) agricultural runoff Water Quality Parameter: Conductivity © H. Verheul Electrical measured in microSiemens per centimeter ( μ S/cm) Hard water has a high conductivity Soft water has a low conductivity
Water Quality Parameter: Conductivity © H. Verheul Electrical measured in microSiemens per centimeter ( μ S/cm) Lake EC ( μ S/cm) Comments Pockwock Lake (Halifax) ~35-45 2003-2005 http://www.gov.ns.ca/nse/surface.water/automatedqualitymonitoringdata.asp Shelburne River (near Kejimkujik National Park) ~20-45 2005, varies with water level (stage)  http://www.gov.ns.ca/nse/surface.water/automatedqualitymonitoringdata.asp Atlantic Ocean ~48,000 (Water on the Web 2004) Great Salt Lake ~158,000 (Water on the Web 2004)
refers to any minerals or ions that are dissolved in the water  the dissolved particles may be electrically charged or not measured in mg/L and parts per million (ppm) where: 1 ppm = 1 mg/L Water Quality Parameter:  Total Dissolved Solids http://www.ec.gc.ca/water/images/manage/qual/a3p2e.htm
Quality Assurance Test:  Comparison of  Conductivity and Total Dissolved Solids © H. Verheul Conductivity ( μ S/cm) = (1.2 to 1.8)  Χ  TDS (mg/L) Other checks: major ion balance (if a metals analysis is conducted in a lab) is the TDS measured in the field a close match to the TDS measured in the lab
Essential for plant growth; excess levels can result in excess plant growth(sometimes called eutrophication or algal blooms) Can have negative effects on water quality: depletes oxygen in water nitrate may have direct toxic effects on aquatic life Water Quality Parameter: Nitrates and Phosphorous http://blog.pricegrabber.com/shopgreen/files/2008/03/wsci_01_img0017.jpg
Comes from point sources such as wastewater treatment plants or industrial discharges or non point sources like agricultural runoff or atmospheric deposition. Water Quality Parameter: Nitrates and Phosphorous http://anmp.umd.edu/Bkgrnd/image44.gif
CCME Guidelines: maximum level of phosphorus  is dependant on the type of lake but ranges from 0.004 mg/L to 0.1 mg/L maximum level of nitrates to prevent toxic effects on aquatic life is 13 mg/L Water Quality Parameter: Nitrates and Phosphorous http://ceqg-rcqe.ccme.ca/ (CCME 1999)
Water Quality Parameter: Sediments can destroy aquatic habitat by covering fish spawning areas  may contain toxins which can be harmful to aquatic life can make the water foggy which blocks sunlight passage to plant life and can clog the gills of fish Solid matter such as sand which is transported in rivers and streams. Sediments will be deposited in still water, such as a lake or pool; this is called deposition or sedimentation. © H. Verheul
Water Quality Parameter: Sediments Some unnatural causes of erosion which increases the sediment in streams are: construction; erosion can be prevented by proper practises deforestation; once stabilizing vegetation has been removed from the top soil, erosion can occur during rainfall improper farming practices © H. Verheul
YSI 650 MDS and 600 QS Multiprobe dissolved oxygen, temperature, conductivity, salinity, specific conductance, pH and total dissolved solids Secchi disk indicator of clarity PSC tester 35 temperature, conductivity, salinity, pH and total dissolved solids Equipment: Today’s Tests Courtesy of the Community Based Environmental Monitoring Network http://www.envnetwork.smu.ca/documents/EC2009web.pdf http://www.envnetwork.smu.ca/
YSI 556 Handheld Multiparameter dissolved oxygen, temperature, conductivity, salinity, and pH Equipment: Today’s Tests Courtesy of the Community Based Environmental Monitoring Network http://www.envnetwork.smu.ca/documents/EC2009web.pdf
Secchi Disk Secchi depth is a measure of clarity attached to a rope and lowered into the water until it is no longer visible higher secchi readings mean more rope was let out before the disk disappeared from sight and indicates clearer water lower readings indicate turbid or colored water. Clear water lets light penetrate more deeply into the lake than does murky water this light allows photosynthesis to occur and oxygen to be produced rule of thumb is that light can penetrate to a depth of about 2 - 3 times the Secchi disk depth. Equipment Today’s Tests (World Health Organization, 1996) Measure the secchi depth twice and report an average of the two depths Report the diameter on the disk and the pattern
Equipment Today’s Tests (http://pearl.maine.edu/glossary/misc/secchi_disk.htm) Measure the secchi depth twice and report an average of the two depths Report the diameter and pattern of the disk.
Secchi disk readings are related to algae productivity using the following guidelines:  4m (13 ft) or less = Productive 4-7m (13-23 ft) = Moderately Productive 7m (23 ft) or greater = Unproductive Equipment Today’s Tests (http://pearl.maine.edu/glossary/misc/secchi_disk.htm)
References Bartram J. and Ballance R. 1996. Water Quality Monitoring: A practical guide to the design and implementation of freshwater quality studies and monitoring programmes. United Nations Environment Programmes, World Health Organization.  Canadian Council of Ministers of the Environment (CCME). 1999. Canadian water quality guidelines for the protection of aquatic life. In: Canadian environmental quality guidelines. Canadian Council of Ministers of the Environment, Winnipeg, Manitoba. Available at:  http://ceqg-rcqe.ccme.ca/?config=ccme&thesite=ceqg&words=&image.x=8&image.y=8 Glenen J. and Sharpe A. 2009. Annapolis River 2008 Annual Water Quality Monitoring Report. Clean Annapolis River Project. Annapolis Royal, Nova Scotia. Available at: http://www.annapolisriver.ca/downloads/Annapolis_River_Guardians_2008.pdf  MacMillan et al. 2005. Canadian Technical Report of Fisheries and Aquatic Sciences 2582: Characterization of Summer Water Temperatures for 312 selected sites in Nova Scotia. Department of Fisheries and Oceans. Moncton, New Brunswick.  Water on the Web. 2004. Water on the Web - Monitoring Minnesota Lakes on the Internet and Training Water Science Technicians for the Future - A National On-line Curriculum using Advanced Technologies and Real-Time Data. University of Minnesota-Duluth, Duluth, MN 55812. Available at: http://WaterOntheWeb.org Wieler C. 2007. Delivery of Ecological Monitoring Information to Decision-Makers.  Environmental Monitoring and Assessment Network, Environment Canada, Burlington, Ontario. Available at: http://www.eman-rese.ca/eman/reports/publications/intro.html

Testing The Waters Water Quality Testing Session

  • 1.
    Water Quality TestingSession © H. Verheul
  • 2.
    Water Quality Parameter:a characteristic which can be used to understand the quality of the water. Water Quality Parameter © H. Verheul
  • 3.
    Determines the healthof an ecosystem most aquatic species are cold blooded, meaning they cannot regulate their body temperature and need cool waters to survive for example, salmon species will experience stress at temperatures over 20°C and prolonged exposure to temperatures over 24°C may be lethal (Clean Annapolis River Project 2009, MacMillan et. al. 2005) Water Quality Parameter: Temperature When measuring temperature: hold probe or thermometer under water for at least 1 minute keep the thermometer under water while taking the reading (Vermont Agency of Natural Resources 2006) © H. Verheul
  • 4.
    Water Quality Parameter:Temperature (Water on the Web, 2009) Natural variance of temperature of lakes: water changes density with temperature causing thermal stratification during summer, surface water is warmed by the sun during ice cover, warmer temperatures occur at the bottom of a lake take readings of several parameters at different depths to ensure a representative data set a lake will ‘turnover’ twice a year, in the spring and the fall, causing the layers to mix (this may be a good time to do testing)
  • 5.
    Water Quality Parameter:Temperature temperature affects other parameters such as pH, dissolved oxygen and nutrient levels water temperature may also be affected by industrial or municipal effluents or runoff that flows over warm concrete or pavement measurable thermal pollution may rarely occur, slight changes in temperature may add to effects already being caused by other types of pollution long-term monitoring of temperature may be useful in determining the effects of climate change © H. Verheul
  • 6.
    Clarity clarity isaffected by algae, soil particles, and other materials suspended in the water secchi disk depth is primarily used as an indicator of algae abundance and general lake productivity. Although it is only an indicator, it is the simplest and one of the most effective tools for estimating a lake's productivity. Water Quality Parameter: Clarity (Water on the Web, 2009) Productivity the growth rate of organisms © H. Verheul
  • 7.
    A measure ofthe acidity of water. It affects the biological and chemical processes in water Measured with a pH meter Water Quality Parameter: pH http://www.ec.gc.ca/water/en/manage/qual/e_ph.htm
  • 8.
    Effects of phAfter: http://www.ec.gc.ca/acidrain/acidwater.html Effects of pH
  • 9.
    pH can beinfluenced by: rainfall (acid rain) the type of bedrock limestone can help neutralize the water granite has little effect on pH dumping of chemicals by individuals, industries, and communities acid mine drainage or acid rock drainage Water Quality Parameter: pH © H. Verheul
  • 10.
    Effects of AcidRain in Nova Scotia http://www.novascotiasalmon.ns.ca/newsandissues/acidrain_map.htm
  • 11.
    when dissolved oxygenin water is too low aquatic life, such as fish, suffocate. levels below 60% saturation are known to cause stress to aquatic life. Water Quality Parameter: Dissolved Oxygen Canadian Water Quality Guidelines for the Protection of Aquatic Life (2007) : warm water: early life stages: 6 mg/L other life stages: 5.5 mg/L cold water: early life stages: 9.5 mg/L other life stages: 6.5 mg/L
  • 12.
    measures the watersability to conduct electric current is directly related to the dissolved ions (charged particle, often salt) in the water main sources of ions in water are: wastewater from treatment plants and septic systems urban runoff such as from salt on roads (especially high after rainfall and snowmelt) agricultural runoff Water Quality Parameter: Conductivity © H. Verheul Electrical measured in microSiemens per centimeter ( μ S/cm) Hard water has a high conductivity Soft water has a low conductivity
  • 13.
    Water Quality Parameter:Conductivity © H. Verheul Electrical measured in microSiemens per centimeter ( μ S/cm) Lake EC ( μ S/cm) Comments Pockwock Lake (Halifax) ~35-45 2003-2005 http://www.gov.ns.ca/nse/surface.water/automatedqualitymonitoringdata.asp Shelburne River (near Kejimkujik National Park) ~20-45 2005, varies with water level (stage) http://www.gov.ns.ca/nse/surface.water/automatedqualitymonitoringdata.asp Atlantic Ocean ~48,000 (Water on the Web 2004) Great Salt Lake ~158,000 (Water on the Web 2004)
  • 14.
    refers to anyminerals or ions that are dissolved in the water the dissolved particles may be electrically charged or not measured in mg/L and parts per million (ppm) where: 1 ppm = 1 mg/L Water Quality Parameter: Total Dissolved Solids http://www.ec.gc.ca/water/images/manage/qual/a3p2e.htm
  • 15.
    Quality Assurance Test: Comparison of Conductivity and Total Dissolved Solids © H. Verheul Conductivity ( μ S/cm) = (1.2 to 1.8) Χ TDS (mg/L) Other checks: major ion balance (if a metals analysis is conducted in a lab) is the TDS measured in the field a close match to the TDS measured in the lab
  • 16.
    Essential for plantgrowth; excess levels can result in excess plant growth(sometimes called eutrophication or algal blooms) Can have negative effects on water quality: depletes oxygen in water nitrate may have direct toxic effects on aquatic life Water Quality Parameter: Nitrates and Phosphorous http://blog.pricegrabber.com/shopgreen/files/2008/03/wsci_01_img0017.jpg
  • 17.
    Comes from pointsources such as wastewater treatment plants or industrial discharges or non point sources like agricultural runoff or atmospheric deposition. Water Quality Parameter: Nitrates and Phosphorous http://anmp.umd.edu/Bkgrnd/image44.gif
  • 18.
    CCME Guidelines: maximumlevel of phosphorus is dependant on the type of lake but ranges from 0.004 mg/L to 0.1 mg/L maximum level of nitrates to prevent toxic effects on aquatic life is 13 mg/L Water Quality Parameter: Nitrates and Phosphorous http://ceqg-rcqe.ccme.ca/ (CCME 1999)
  • 19.
    Water Quality Parameter:Sediments can destroy aquatic habitat by covering fish spawning areas may contain toxins which can be harmful to aquatic life can make the water foggy which blocks sunlight passage to plant life and can clog the gills of fish Solid matter such as sand which is transported in rivers and streams. Sediments will be deposited in still water, such as a lake or pool; this is called deposition or sedimentation. © H. Verheul
  • 20.
    Water Quality Parameter:Sediments Some unnatural causes of erosion which increases the sediment in streams are: construction; erosion can be prevented by proper practises deforestation; once stabilizing vegetation has been removed from the top soil, erosion can occur during rainfall improper farming practices © H. Verheul
  • 21.
    YSI 650 MDSand 600 QS Multiprobe dissolved oxygen, temperature, conductivity, salinity, specific conductance, pH and total dissolved solids Secchi disk indicator of clarity PSC tester 35 temperature, conductivity, salinity, pH and total dissolved solids Equipment: Today’s Tests Courtesy of the Community Based Environmental Monitoring Network http://www.envnetwork.smu.ca/documents/EC2009web.pdf http://www.envnetwork.smu.ca/
  • 22.
    YSI 556 HandheldMultiparameter dissolved oxygen, temperature, conductivity, salinity, and pH Equipment: Today’s Tests Courtesy of the Community Based Environmental Monitoring Network http://www.envnetwork.smu.ca/documents/EC2009web.pdf
  • 23.
    Secchi Disk Secchidepth is a measure of clarity attached to a rope and lowered into the water until it is no longer visible higher secchi readings mean more rope was let out before the disk disappeared from sight and indicates clearer water lower readings indicate turbid or colored water. Clear water lets light penetrate more deeply into the lake than does murky water this light allows photosynthesis to occur and oxygen to be produced rule of thumb is that light can penetrate to a depth of about 2 - 3 times the Secchi disk depth. Equipment Today’s Tests (World Health Organization, 1996) Measure the secchi depth twice and report an average of the two depths Report the diameter on the disk and the pattern
  • 24.
    Equipment Today’s Tests(http://pearl.maine.edu/glossary/misc/secchi_disk.htm) Measure the secchi depth twice and report an average of the two depths Report the diameter and pattern of the disk.
  • 25.
    Secchi disk readingsare related to algae productivity using the following guidelines: 4m (13 ft) or less = Productive 4-7m (13-23 ft) = Moderately Productive 7m (23 ft) or greater = Unproductive Equipment Today’s Tests (http://pearl.maine.edu/glossary/misc/secchi_disk.htm)
  • 26.
    References Bartram J.and Ballance R. 1996. Water Quality Monitoring: A practical guide to the design and implementation of freshwater quality studies and monitoring programmes. United Nations Environment Programmes, World Health Organization. Canadian Council of Ministers of the Environment (CCME). 1999. Canadian water quality guidelines for the protection of aquatic life. In: Canadian environmental quality guidelines. Canadian Council of Ministers of the Environment, Winnipeg, Manitoba. Available at: http://ceqg-rcqe.ccme.ca/?config=ccme&thesite=ceqg&words=&image.x=8&image.y=8 Glenen J. and Sharpe A. 2009. Annapolis River 2008 Annual Water Quality Monitoring Report. Clean Annapolis River Project. Annapolis Royal, Nova Scotia. Available at: http://www.annapolisriver.ca/downloads/Annapolis_River_Guardians_2008.pdf MacMillan et al. 2005. Canadian Technical Report of Fisheries and Aquatic Sciences 2582: Characterization of Summer Water Temperatures for 312 selected sites in Nova Scotia. Department of Fisheries and Oceans. Moncton, New Brunswick. Water on the Web. 2004. Water on the Web - Monitoring Minnesota Lakes on the Internet and Training Water Science Technicians for the Future - A National On-line Curriculum using Advanced Technologies and Real-Time Data. University of Minnesota-Duluth, Duluth, MN 55812. Available at: http://WaterOntheWeb.org Wieler C. 2007. Delivery of Ecological Monitoring Information to Decision-Makers. Environmental Monitoring and Assessment Network, Environment Canada, Burlington, Ontario. Available at: http://www.eman-rese.ca/eman/reports/publications/intro.html

Editor's Notes

  • #3 A water quality parameter is a measurement which can be used to understand the quality of the water. Examples are pH (or acidity), dissolved oxygen, total dissolved solids and clarity. We will go over a few of the more common parameters that are tested for including the ones that we will test for today.
  • #5 When explaining this, relate it to how warm air rises in a house. It is because as air heats up, it becomes more dense, which means that it becomes less heavy.
  • #7 The clarity of a stream, river, or lake can be affected by many things, such as plants and algae, soil particles and other materials suspended in the water. The most affordable method for measuring clarity is by using a Secchi disk, which is shown in the photo above. It is usually used to estimate the abundance of algae (or the productivity of a lake), but keep in mind it is only an indicator.
  • #8 The pH is the measure of the acidity of water.
  • #11 What causes acid rain? When fossil fuels are burned, chemicals are released into the atmosphere. A chemical reaction takes place in the atmosphere which forms acids that fall back down to the earth in the form of rain and snow. In Nova Scotia, the bedrock is largely composed of granite, which does not have a strong buffering capacity to bring the pH up.
  • #13 Surface runoff is when water flows over the land into a stream, river or lake.
  • #15 An ion is an electrically charged particle in the water.
  • #17 Note that only in slow moving streams, lakes or ponds will this be noticeable.
  • #20 Silt and Sedimentation - Sediments may contain toxicants which can be detrimental to aquatic organisms.
  • #21 Silt and Sedimentation - Sediments may contain toxicants which can be detrimental to aquatic organisms.
  • #22 Equipment: Today’s Tests (Courtesy of the Community Based Environmental Monitoring Network_ - YSI 650 MDS and 600 QS Multiprobe - measures: dissolved oxygen, temperature, conductivity, salinity, specific conductance, pH and total dissolved solids - Secchi disk - measures: turbidity indirectly - PSC tester 35 - measures: temperature, conductivity, salinity, pH and total dissolved solids
  • #23 Equipment: Today’s Tests (Courtesy of the Community Based Environmental Monitoring Network_ - YSI 650 MDS and 600 QS Multiprobe - measures: dissolved oxygen, temperature, conductivity, salinity, specific conductance, pH and total dissolved solids - Secchi disk - measures: turbidity indirectly - PSC tester 35 - measures: temperature, conductivity, salinity, pH and total dissolved solids
  • #24 Secchi disk: - secchi depth is a measure of clarity - attached to a rape and lowered into the water until it is no longer visible - higher secchi readings mean more rope was let out before the disk disappeared from sight and indicates clearer water - lower readinds indicate turbid or colored water. Clear water lets light penetrate more deeply into the lake than does murky water - this light allows photosyntheses to occur and oxygen to be produced - rule of thumb is that light can penetrate to a depth of about 2-3 times the secchi disk depth Measure the secchi depth twice and report an average of the two depths Report the diameter on the disk and the pattern
  • #25 Secchi disk: - secchi depth is a measure of clarity - attached to a rape and lowered into the water until it is no longer visible - higher secchi readings mean more rope was let out before the disk disappeared from sight and indicates clearer water - lower readinds indicate turbid or colored water. Clear water lets light penetrate more deeply into the lake than does murky water - this light allows photosyntheses to occur and oxygen to be produced - rule of thumb is that light can penetrate to a depth of about 2-3 times the secchi disk depth Measure the secchi depth twice and report an average of the two depths Report the diameter on the disk and the pattern
  • #26 Secchi disk: - secchi depth is a measure of clarity - attached to a rape and lowered into the water until it is no longer visible - higher secchi readings mean more rope was let out before the disk disappeared from sight and indicates clearer water - lower readinds indicate turbid or colored water. Clear water lets light penetrate more deeply into the lake than does murky water - this light allows photosyntheses to occur and oxygen to be produced - rule of thumb is that light can penetrate to a depth of about 2-3 times the secchi disk depth Measure the secchi depth twice and report an average of the two depths Report the diameter on the disk and the pattern