Downloaded 143 times

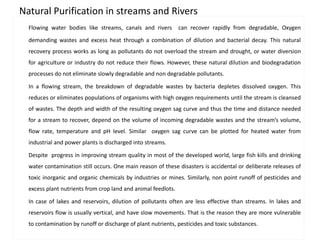
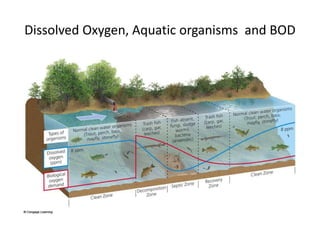

Natural streams have a self-purification capacity to break down and remove pollutants. However, as human settlements grew, the amount and types of pollutants entering water bodies exceeded this capacity. Smaller streams were affected first as dissolved oxygen levels dropped, harming aquatic life. The speed and completeness of natural purification in a stream depends on factors like water volume, flow rate, temperature, and sunlight exposure. Dissolved oxygen is particularly important for breaking down biodegradable organic matter and supporting aquatic life.


![L 17 do sag [compatibility mode]](https://cdn.slidesharecdn.com/ss_thumbnails/l-17dosagcompatibilitymode-150311205622-conversion-gate01-thumbnail.jpg?width=640&height=640&fit=bounds)


