Download to read offline


![G. Arun Kumar et al. Int. Journal of Engineering Research and Applications www.ijera.com
ISSN : 2248-9622, Vol. 5, Issue 4, ( Part -4) April 2015, pp.65-70
www.ijera.com 69 | P a g e
Fig 3: Graphical representation of K, Na, SO4, Cl, and TH concentrations in ground water samples
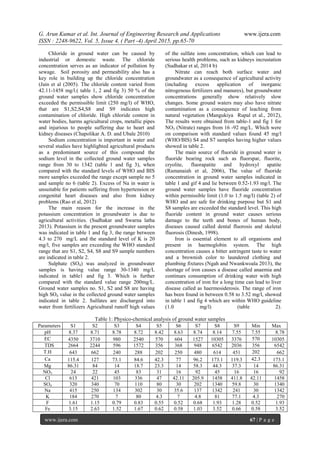
Fig 4: F and Fe Concentrations in Groundwater samples
V. CONCLUSION
After analysis of various Physico-chemical
parameters, so improving access to safe drinking-water
can result in tangible benefits to health. Every effort
should be made to achieve drinking-water quality as
safe as practicable. On the basis of above discussion, it
may be concluded that the quality of ground water is
not suitable for drinking purpose as directly from the
sources. The ground water of Inkollu mandal villages
possessed higher values of pH, EC, TDS, Na, Mg,
T.H, Cl, K and Fe, and slightly higher levels in NO3,
SO4, and F. Remaining all parameters were in the
permissible limits. Hence in all sampling stations are
required some degree of treatment before consumption
and it also needs to be protecting from contamination.
Reference
[1] APHA (American Public Health
Association), 1995. 19 th
Edition.
[2] Water System Council (2007) “Wellcare
Publications” Retrieved from
www.wellcarehotline.org.
[3] Brian O. (2007) Environmental Quality
Centre Environmental Engineering and Earth
Sciences Wilkes University. Wilkes- Barre,
PA 1876. Webmaster.
[4] Ayodele, J.Tand Abubakar, M. B,
(1998).Trace Elements Contamination of
Rainwater in the Semi arid Region of Kano.
Nigeria. Journal of Environmental
Management and Health, vol. 9, No. 4.
[5] World Health Organization: (2011) Drinking
Water Standards and Health Advisories
Office of Water U.S. Environmental
Protection Agency Washington, DC.
[6] Sudhakar Gummadi, Swarnalatha. G, Z.
Vishnuvardhan, Harika.D,(2014 a). Statistical
Analysis of the Groundwater Samples from
Bapatla Mandal, Guntur District, Andhra
Pradesh, India. Journal of Envi sci,
Toxicology & Food Tech. 8(1) PP 27-32.
[7] American Public Health Association (APHA)
1998. Standard Methods for the examination
of water and waste water, 18th
edition.
MWWA&WPCF, Washington.](https://image.slidesharecdn.com/n504046570-150428005219-conversion-gate01/85/Physico-Chemical-Analysis-of-Selected-Groundwater-Samples-of-Inkollu-Mandal-Prakasam-District-Andhra-Pradesh-India-5-320.jpg)
![G. Arun Kumar et al. Int. Journal of Engineering Research and Applications www.ijera.com
ISSN : 2248-9622, Vol. 5, Issue 4, ( Part -4) April 2015, pp.65-70
www.ijera.com 70 | P a g e
[8] Rajan M. R. and I. Paneerselvam. 2005.
Indian J. Environ and Ecoplan. Vol. 10, No.3:
771-776.
[9] Thakare S. B., A.V. Parvate and M. Rao.
2005. Indian J. Environ and Ecoplan. Vol.
10 No.3: 657-661.
[10] Bisht Shikha, Patra, B. A.,Gupta N. C., Arora
Saurabh, and R. Singh. 2007 Assessment of
Drinking Water Quality of Delhi, India
.In:12th ISMAS-WS-2007, March 25-30,
Cidade de Goa, Dona Paula, Goa. Nitrate
pollution of groundwater in northern China
[11] Koul Nishtha, Lokhande R.S.and DharJ.K.,
(2012) Physicochemical, bacteriological and
pesticide analysis of tap water in
Millennium city Gurgoan, Haryana, India,
Int. Res. J. Environment Sci., 1(2),1-7.
[12] Pradeep J. K., (1998) Hydrology and quality
of ground water Hirapur district, Sagar
(M.P.), Pollution Research,17 (1), 91-94.
[13] Jain C.K., Kumar C. P. and Sharma M. K.,
(2003), Ground water qualities of
Ghataprabha command area Karnataka,
Indian Journal Environ and Ecoplan, 7(2),
251-262
[14] Das N.C , (2013 )Physico-Chemical
Characteristics of Selected GroundWater
Samples of Ballarpur City of Chandrapur
District, Maharashtra,India. Int. Res. J.
Environment Sci. Vol. 2(11), 96-100,
November ISSN 2319–1414
[15] BIS, (1991) Indian standards specifications
for drinking water, Bureau of Indian
Standards, IS:10500.
[16] Bhattacharya T., Chakraborty S. and Tuck
Neha, (2012) Physico-chemical
characterization of ground water of Anand
district, Gujrat, India, Int. Res. J. Envi Sci.,
1(1), 28-33.
[17] Dilip B. P., Rajndra V.T.and Rewatkar S.
B.,(2001),Physicochemical characteristics of
ground water of Armori town of Gadchiroli
district, Maharashtra, India, Poll. Res.,
20(2), 207-209.
[18] Jain C.K., Bhatio K. K. and Kumar S.
R.,(2005) Groundwater quality in
Malaprabha sub-basin Karnataka,
International Journal of Environmental
protection, 23(3), 321-329
[19] Chapolikar A. D. and Ubale M. B., (2010), A
correlation study on physico-chemical
characteristics of ground water in Thane
Belapur industrial area, Mumbai, Current
World Environment, 5(1), 67-71
[20] Rao G T, Rao V V S G, Sarma V S, Dhakate
R, Surinaidu L, Mahesh J, Ramesh G, 2012,
Int. J. Environ. Sci. Technol. 9:297–310.
[21] Sudhakar.Gummadi and Swarna latha. G,
(2013), Seasonal Variation of Groundwater
Analysis from Bapatla mandal, Guntur
District, Andhra Pradesh, International
Journal of Scientific Research, Vol: 2. 11.
ISSN No 2277 - 8179
[22] Sudhakar Gummadi, Swarnalatha.G, V.
Venkataratnamma, Z.Vishnuvardhan. (2014
b), Water quality index for groundwater of
Bapatla Mandal, coastal Andhra Pradesh,
India, International Journal of Environmental
Sciences, V- 5, 1,
[23] Mangukiya Rupal, Bhattacharya Tanushree
and Chakraborty Sukalyan, (2012), Quality
Characterization of Groundwater using Water
Quality Index in Surat city, Gujarat, India,
International Research Journal of
Environment Sciences, 1(4), pp 14-23. ISSN
2319–1414.
[24] Ramanaiah S.V., Venkata M. S., Rajkumar B.
and Sharma P. N., (2006), Monitoring of
fluoride concentration in ground water of
Prakasham district in India: Correlation
with physicochemical parameters, Journal of
Environ Science & Engg., 48(2), 129-13416
[25] Ranjana Agrawal, (2009), Study of Physico-
chemical Parameters of Groundwater Quality
of dudu town in rajasthan, Rasayan J.Chem,
Vol.2, (4), pp-969-971,ISSN: 0974-1496
[26] Dinesh C., Fluoride and human health-
cause for concern, Indian J. of Environ Prot.,
19(2), 81-89 (1998)
[27] Ngah S.A. and Nwankwoala H. O., (2013),
Iron (Fe 2+
) occurrence and distribution in
ground water source in different
geomorphological zones of Eastern Niger
Delta, Arch. Appl. Sci. Res., 5(2), 266-277](https://image.slidesharecdn.com/n504046570-150428005219-conversion-gate01/85/Physico-Chemical-Analysis-of-Selected-Groundwater-Samples-of-Inkollu-Mandal-Prakasam-District-Andhra-Pradesh-India-6-320.jpg)

The study assesses the physico-chemical quality of groundwater in Inkollu Mandal, Prakasam District, Andhra Pradesh, India, through parameters such as pH, electrical conductivity, total dissolved solids, and various mineral concentrations. Analysis of nine groundwater samples indicated that many exceeded WHO and BIS standards, particularly concerning pH, electrical conductivity, and total hardness, raising health concerns for potable water quality in the area. Results highlighted significant contamination and deterioration of water quality, necessitating further monitoring and mitigation measures.


