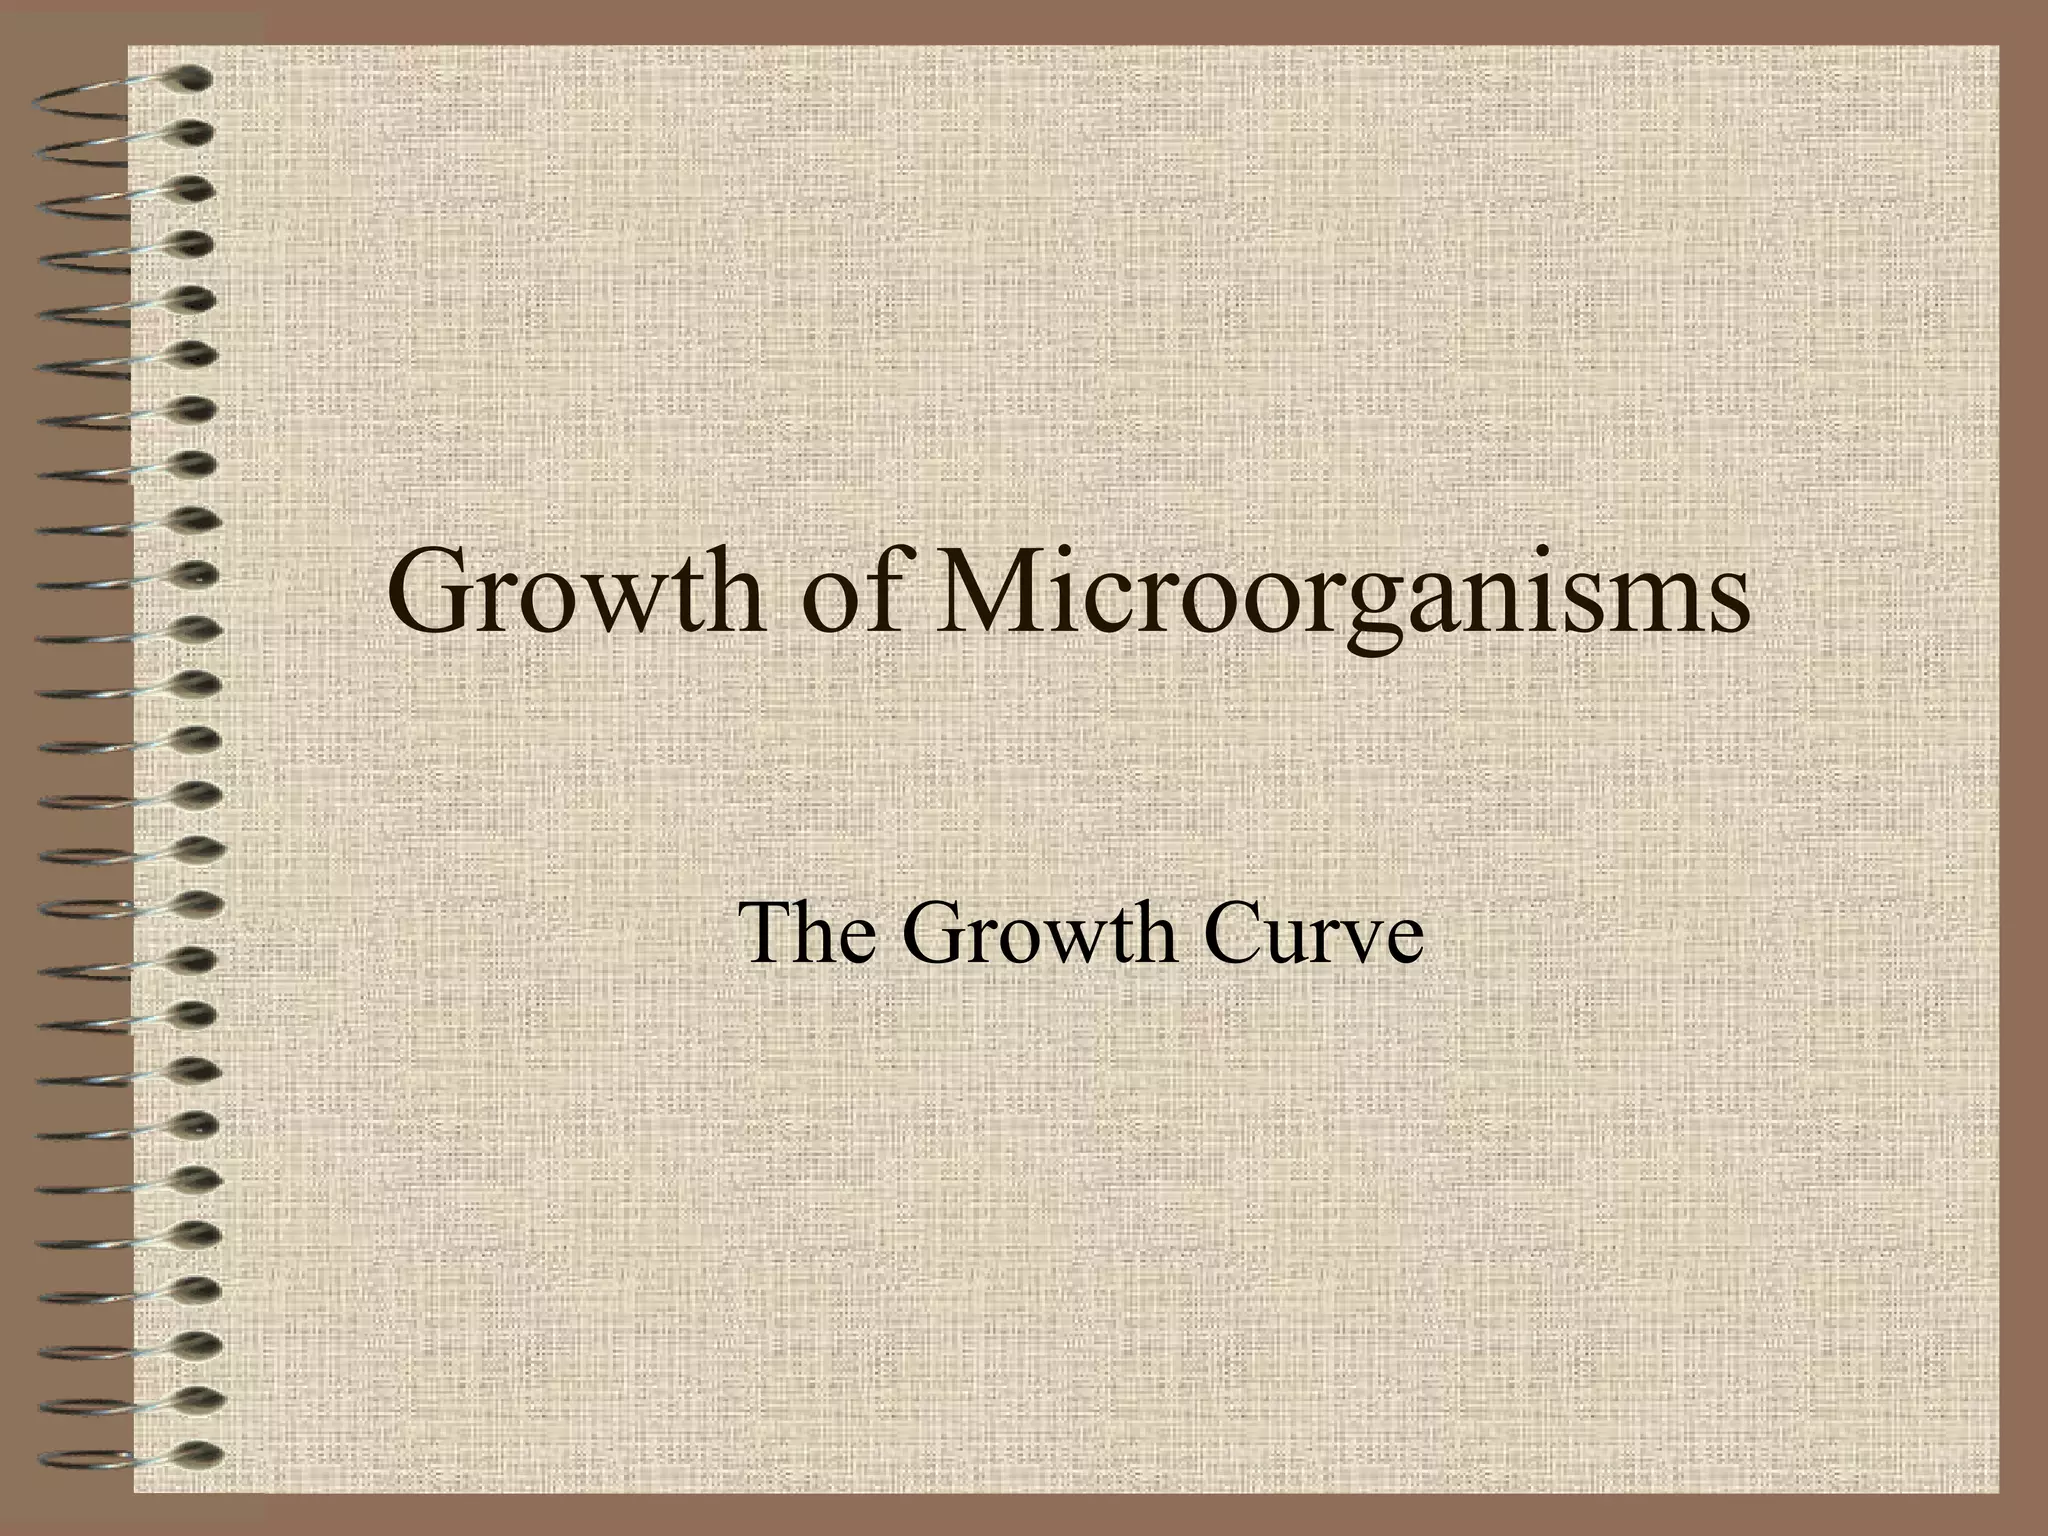
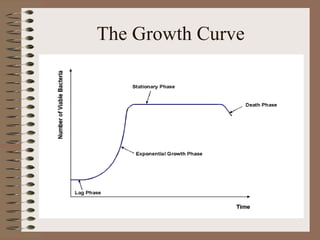
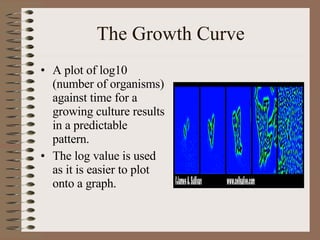
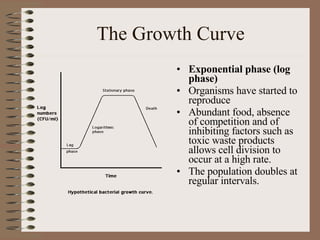
Growth of Microorganisms The Growth Curve
The Growth Curve
The Growth Curve
The Growth Curve A plot of log10 (number of organisms) against time for a growing culture results in a predictable pattern. The log value is used as it is easier to plot onto a graph.
The Growth Curve Lag phase Short period immediately after inoculation Organisms are synthesising the enzymes needed to exploit the new medium. Cells may grow in size but not usually in number (If organisms have been transferred from an identical medium, at the same temperature, the lag phase may be very short).
The Growth Curve Exponential phase (log phase) Organisms have started to reproduce Abundant food, absence of competition and of inhibiting factors such as toxic waste products allows cell division to occur at a high rate. The population doubles at regular intervals.
The Growth Curve Plotted as arithmetic numbers of cells, the log phase would be a curve of ever increasing gradient; plotted as log10 of cell numbers, it gives a straight line .
The Growth Curve Stationary phase In a closed culture food soon runs out or the organisms become poisoned by their own accumulated wastes As a results growth slows down and stops. If the population is being measured by a total cell count, or by turbidity readings, there may be no apparent further change.
The Growth Curve Death phase A viable count will soon show a decline in cell numbers as cells die This will continue until there are no living cells left..

Growth Of Microorganisms

  • 1.
    Growth of MicroorganismsThe Growth Curve
  • 2.
  • 3.
  • 4.
    The Growth CurveA plot of log10 (number of organisms) against time for a growing culture results in a predictable pattern. The log value is used as it is easier to plot onto a graph.
  • 5.
    The Growth CurveLag phase Short period immediately after inoculation Organisms are synthesising the enzymes needed to exploit the new medium. Cells may grow in size but not usually in number (If organisms have been transferred from an identical medium, at the same temperature, the lag phase may be very short).
  • 6.
    The Growth CurveExponential phase (log phase) Organisms have started to reproduce Abundant food, absence of competition and of inhibiting factors such as toxic waste products allows cell division to occur at a high rate. The population doubles at regular intervals.
  • 7.
    The Growth CurvePlotted as arithmetic numbers of cells, the log phase would be a curve of ever increasing gradient; plotted as log10 of cell numbers, it gives a straight line .
  • 8.
    The Growth CurveStationary phase In a closed culture food soon runs out or the organisms become poisoned by their own accumulated wastes As a results growth slows down and stops. If the population is being measured by a total cell count, or by turbidity readings, there may be no apparent further change.
  • 9.
    The Growth CurveDeath phase A viable count will soon show a decline in cell numbers as cells die This will continue until there are no living cells left..