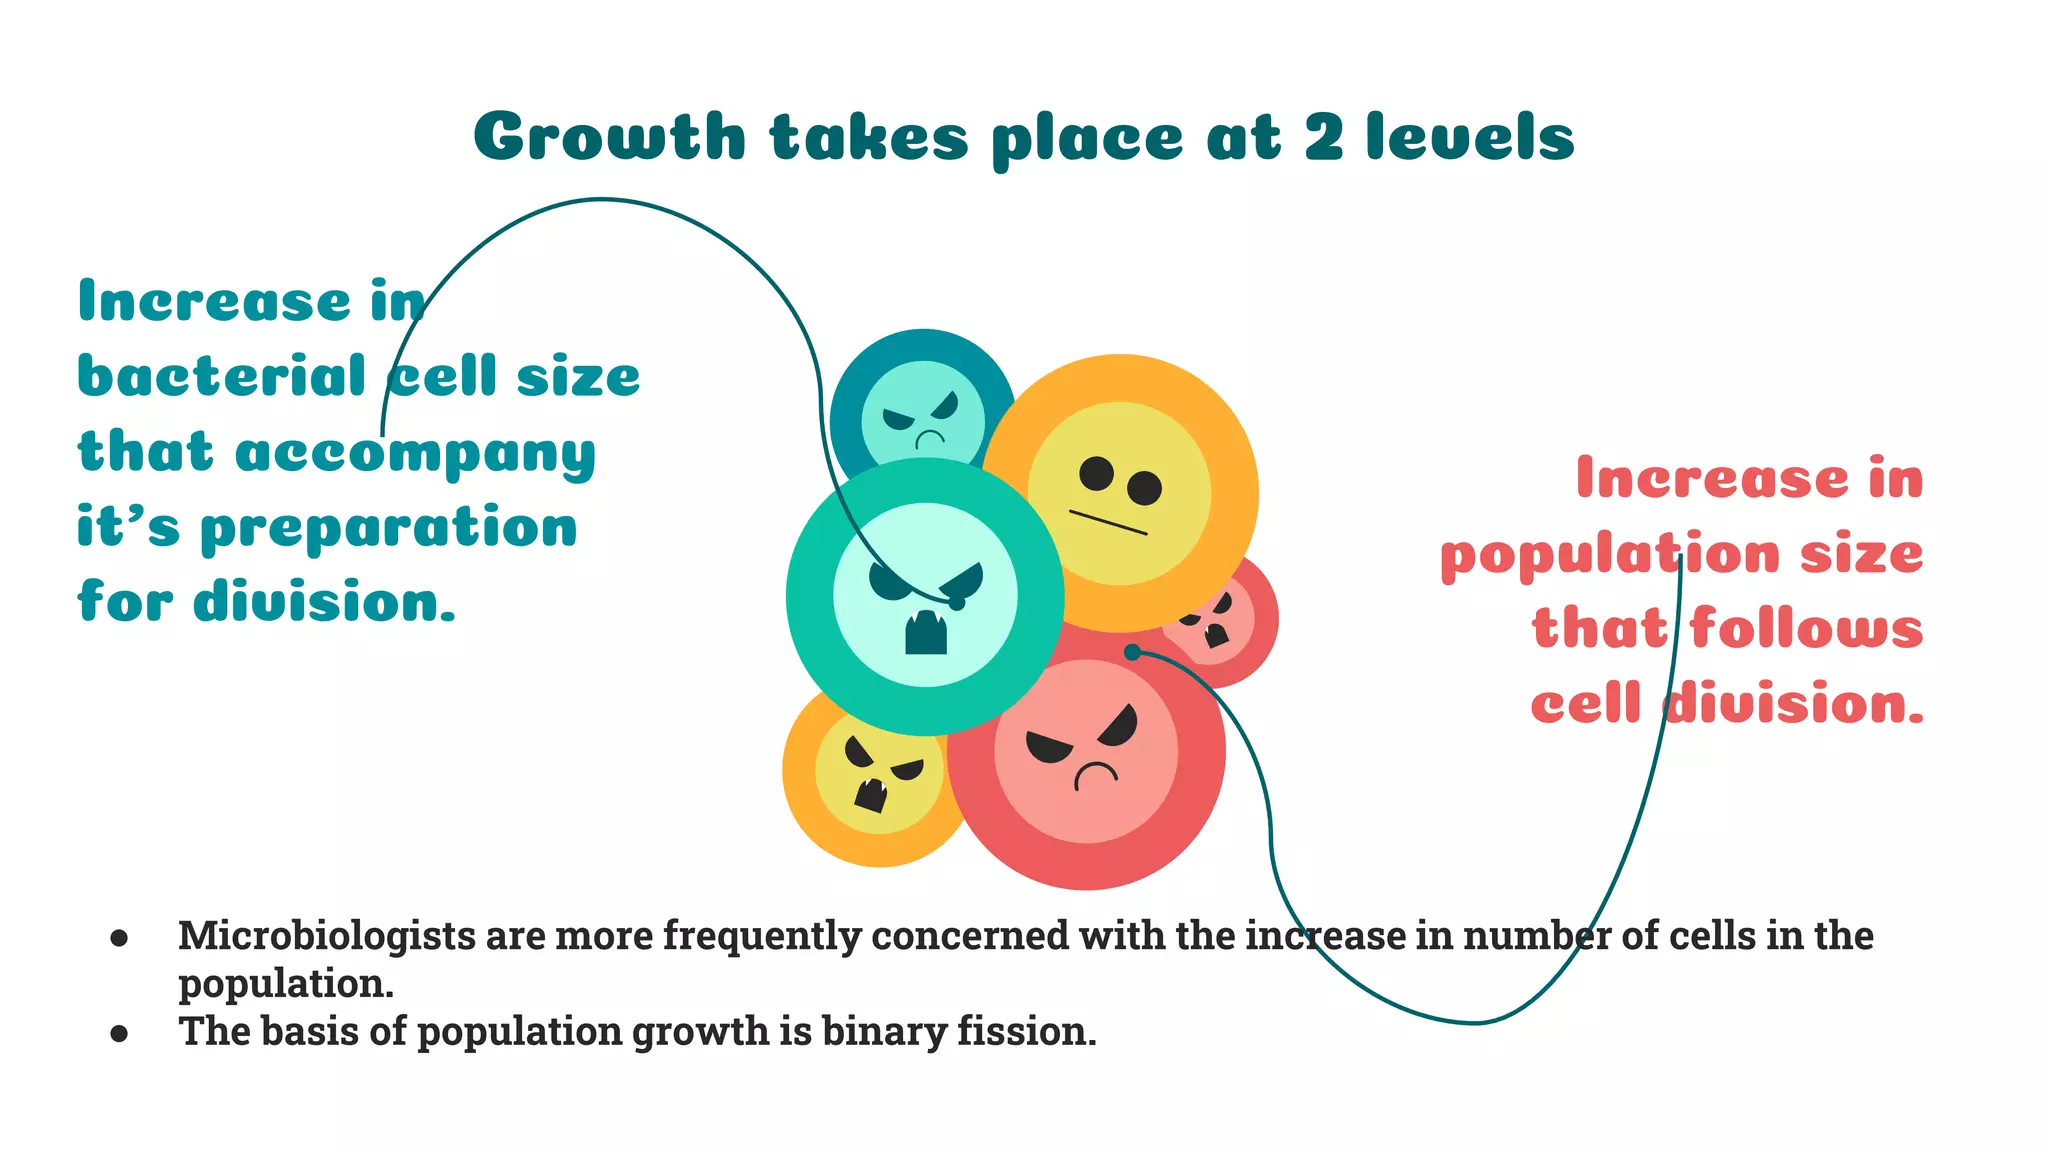
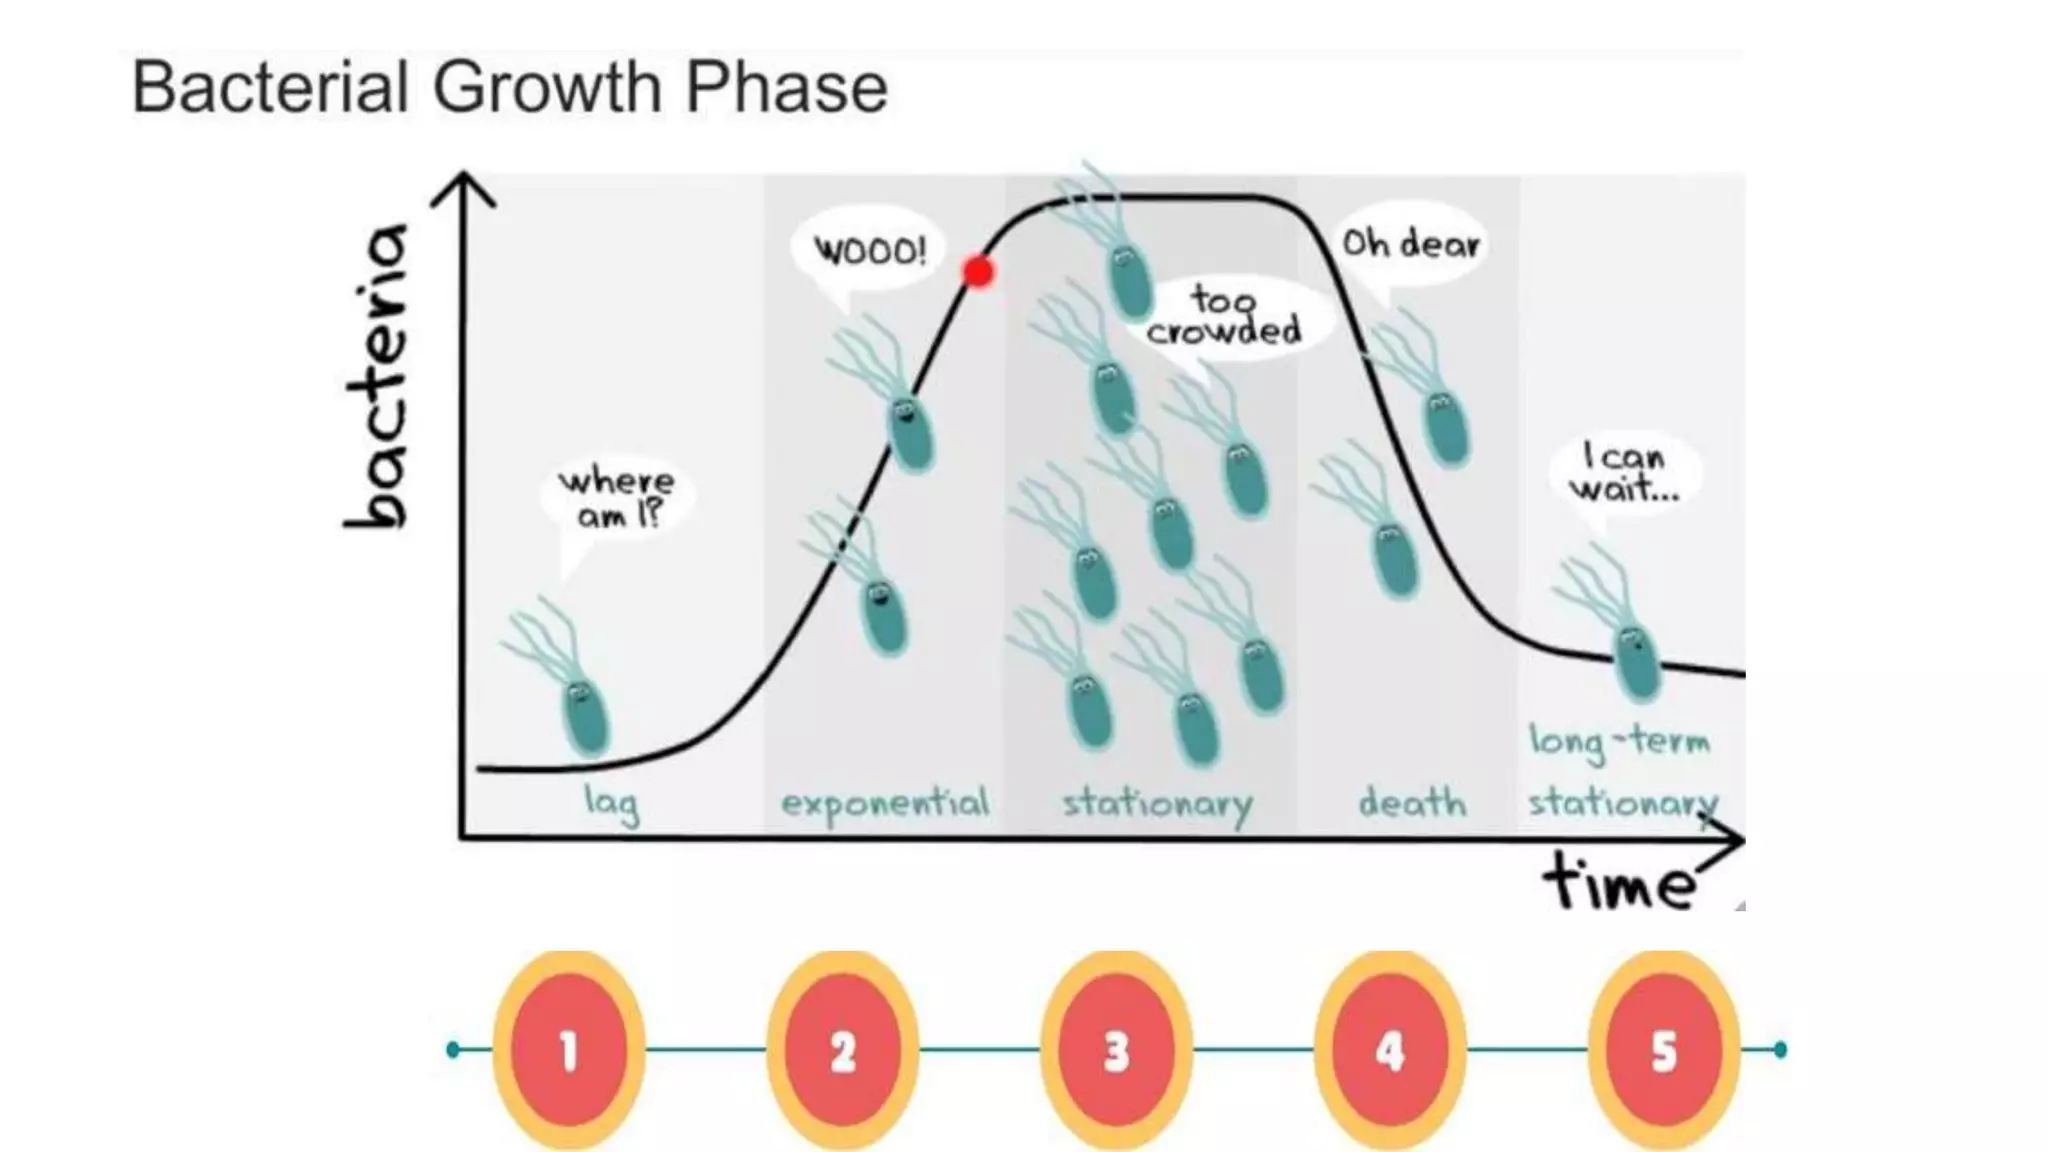
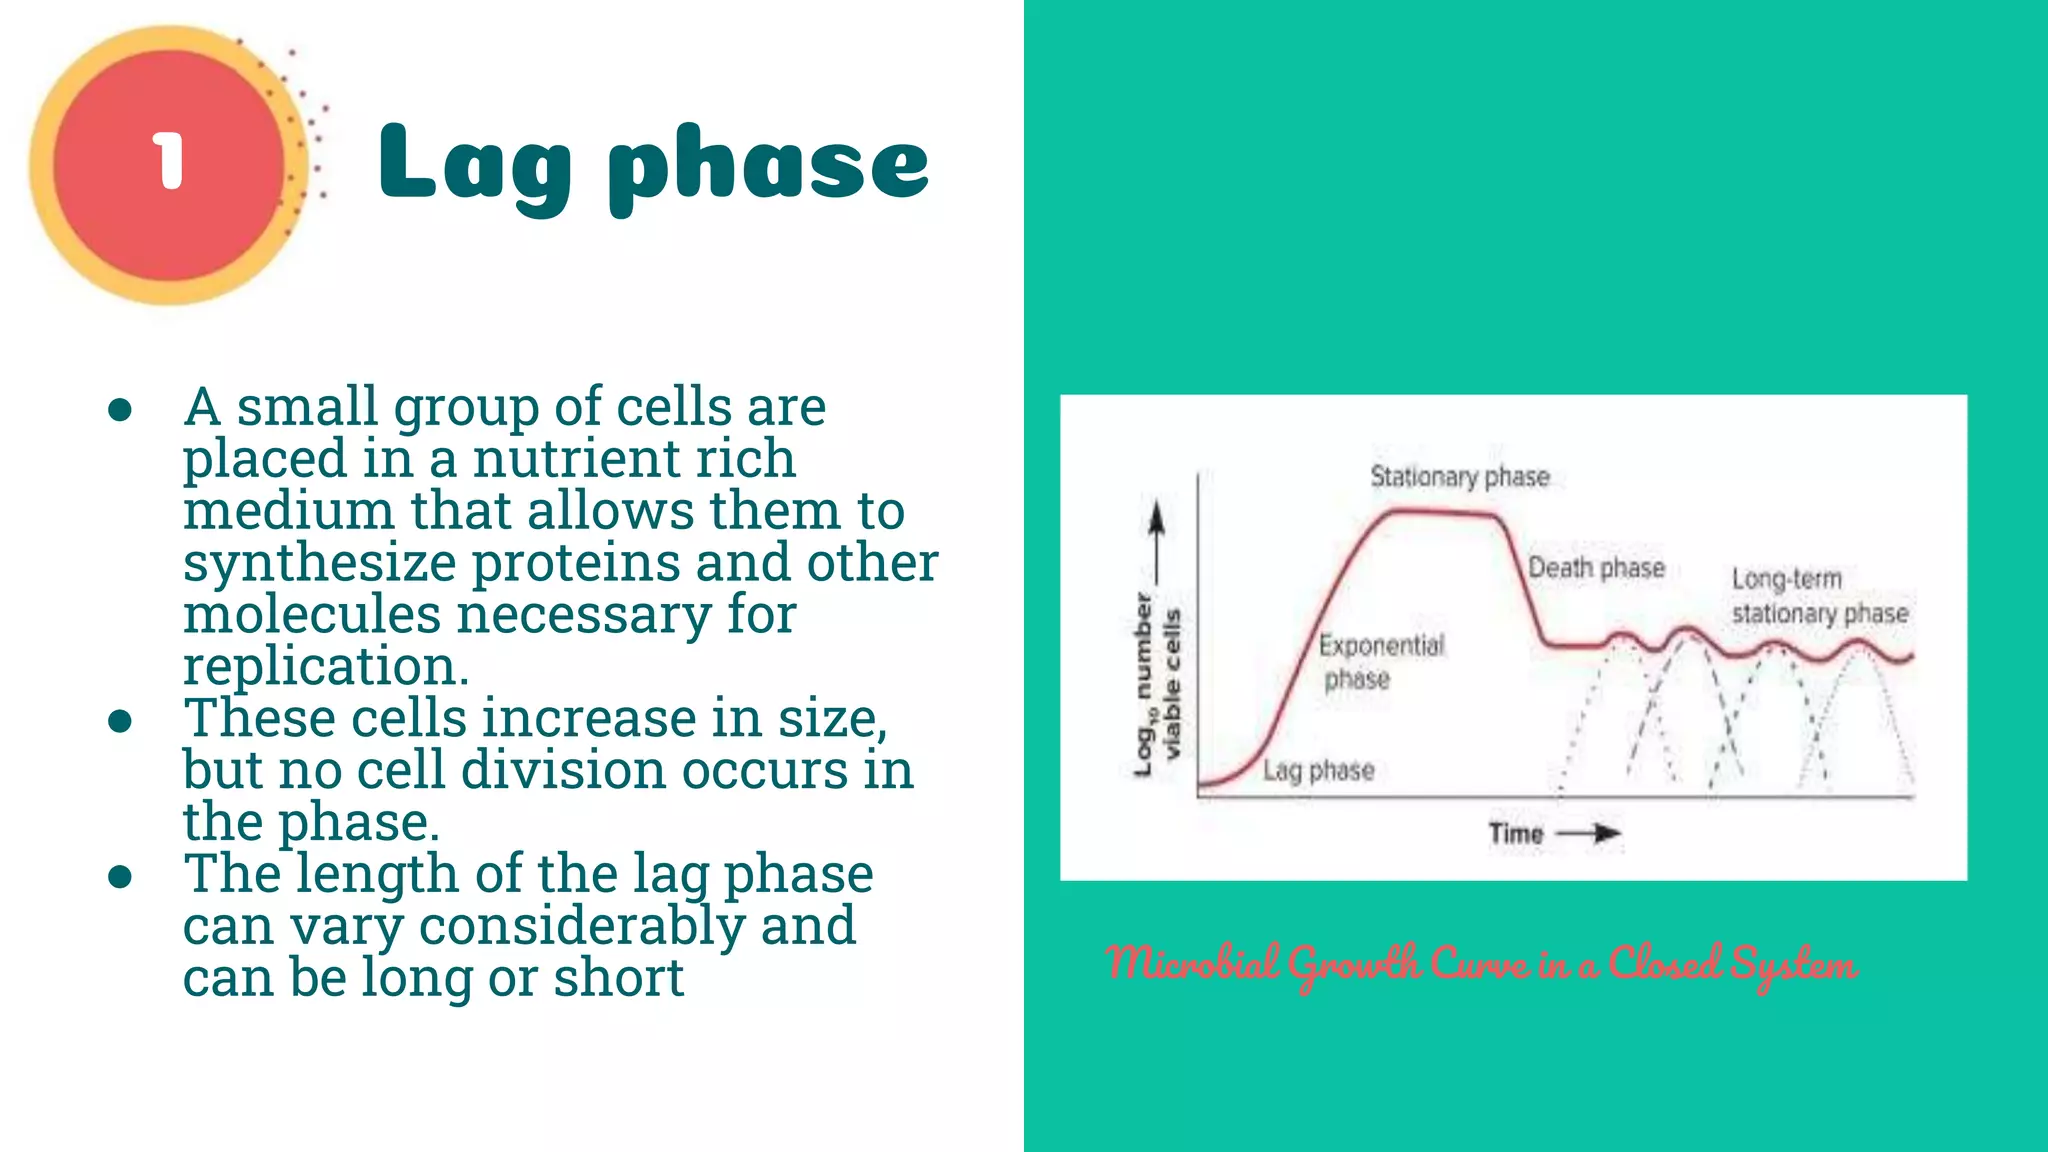
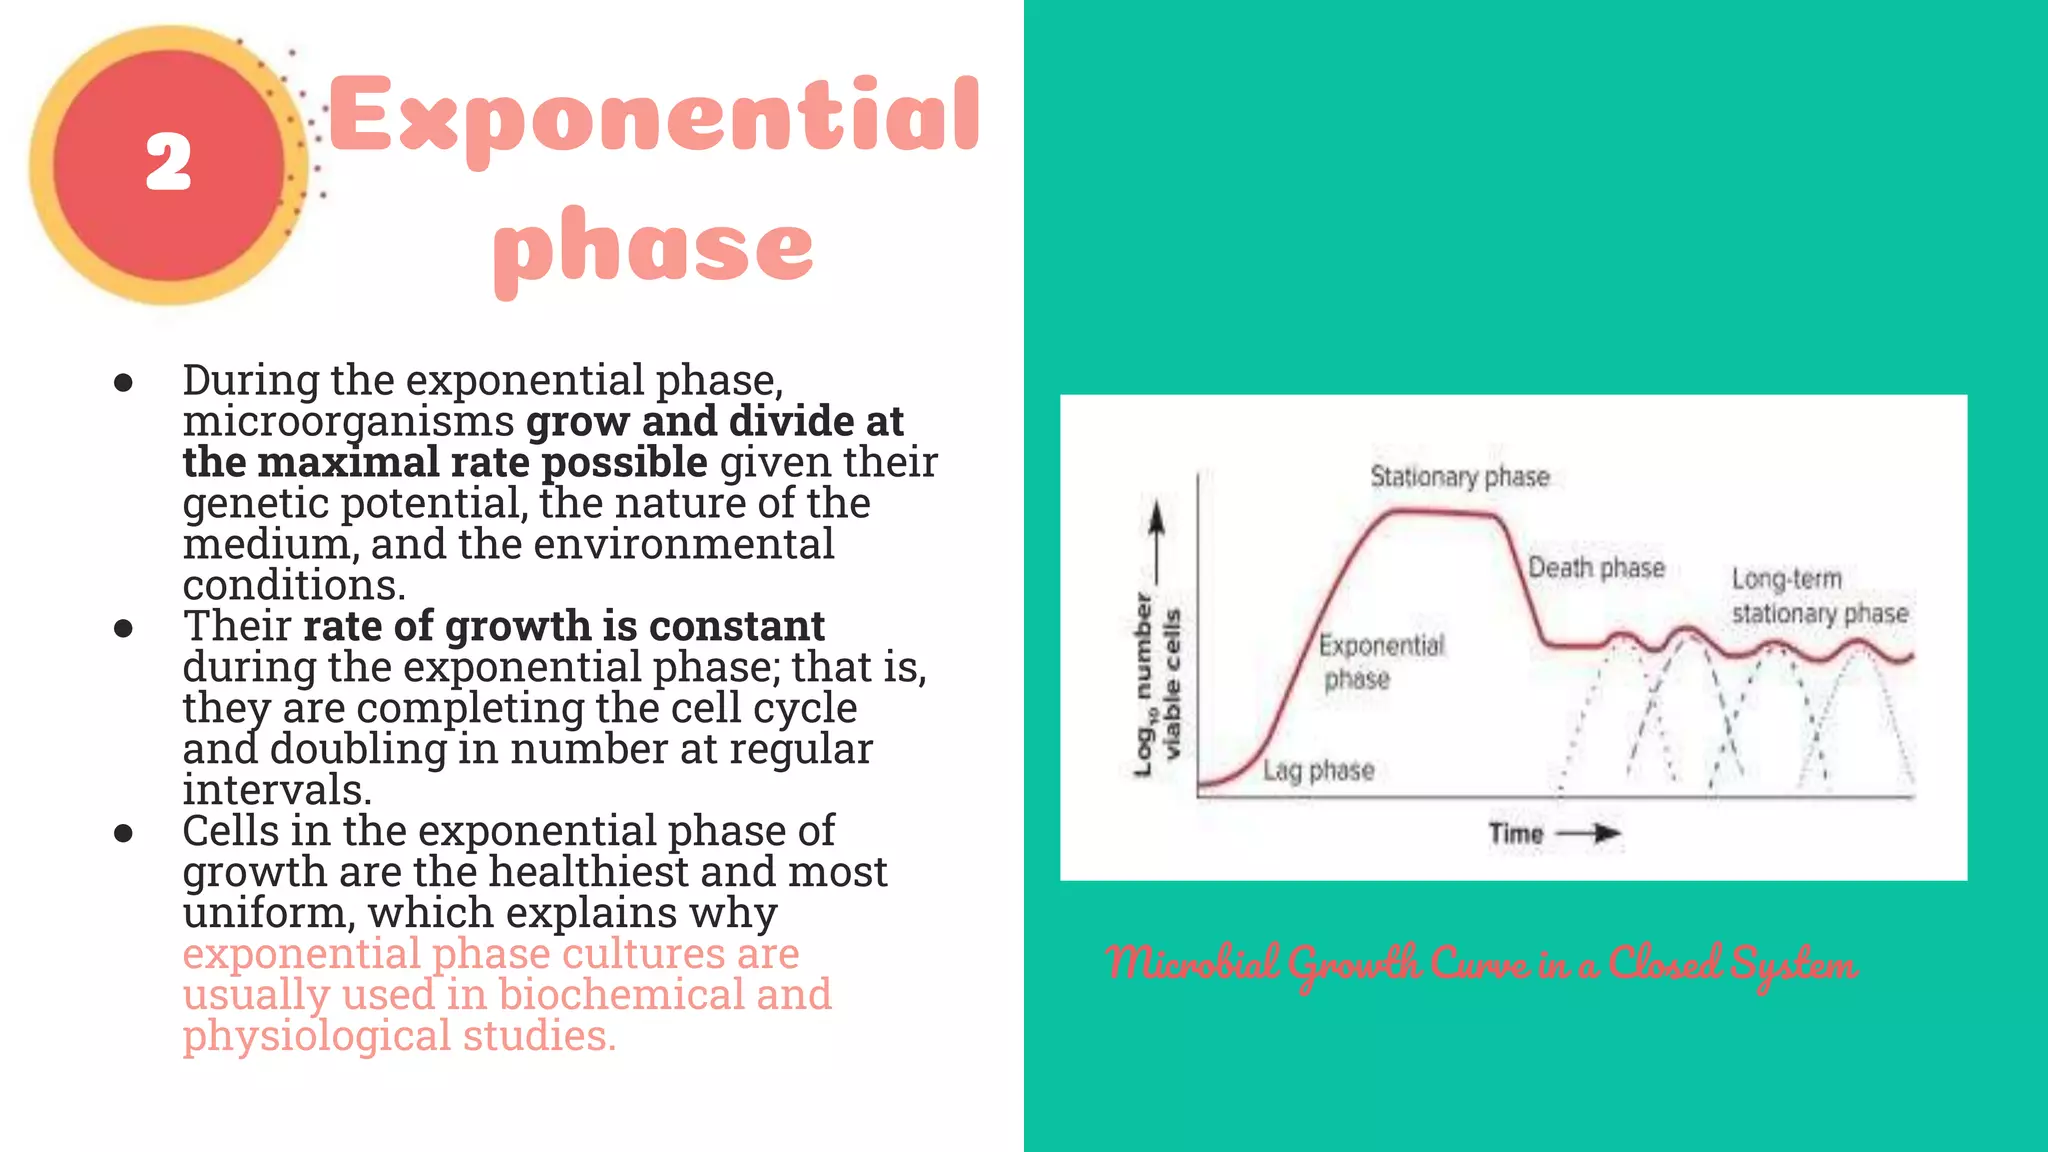
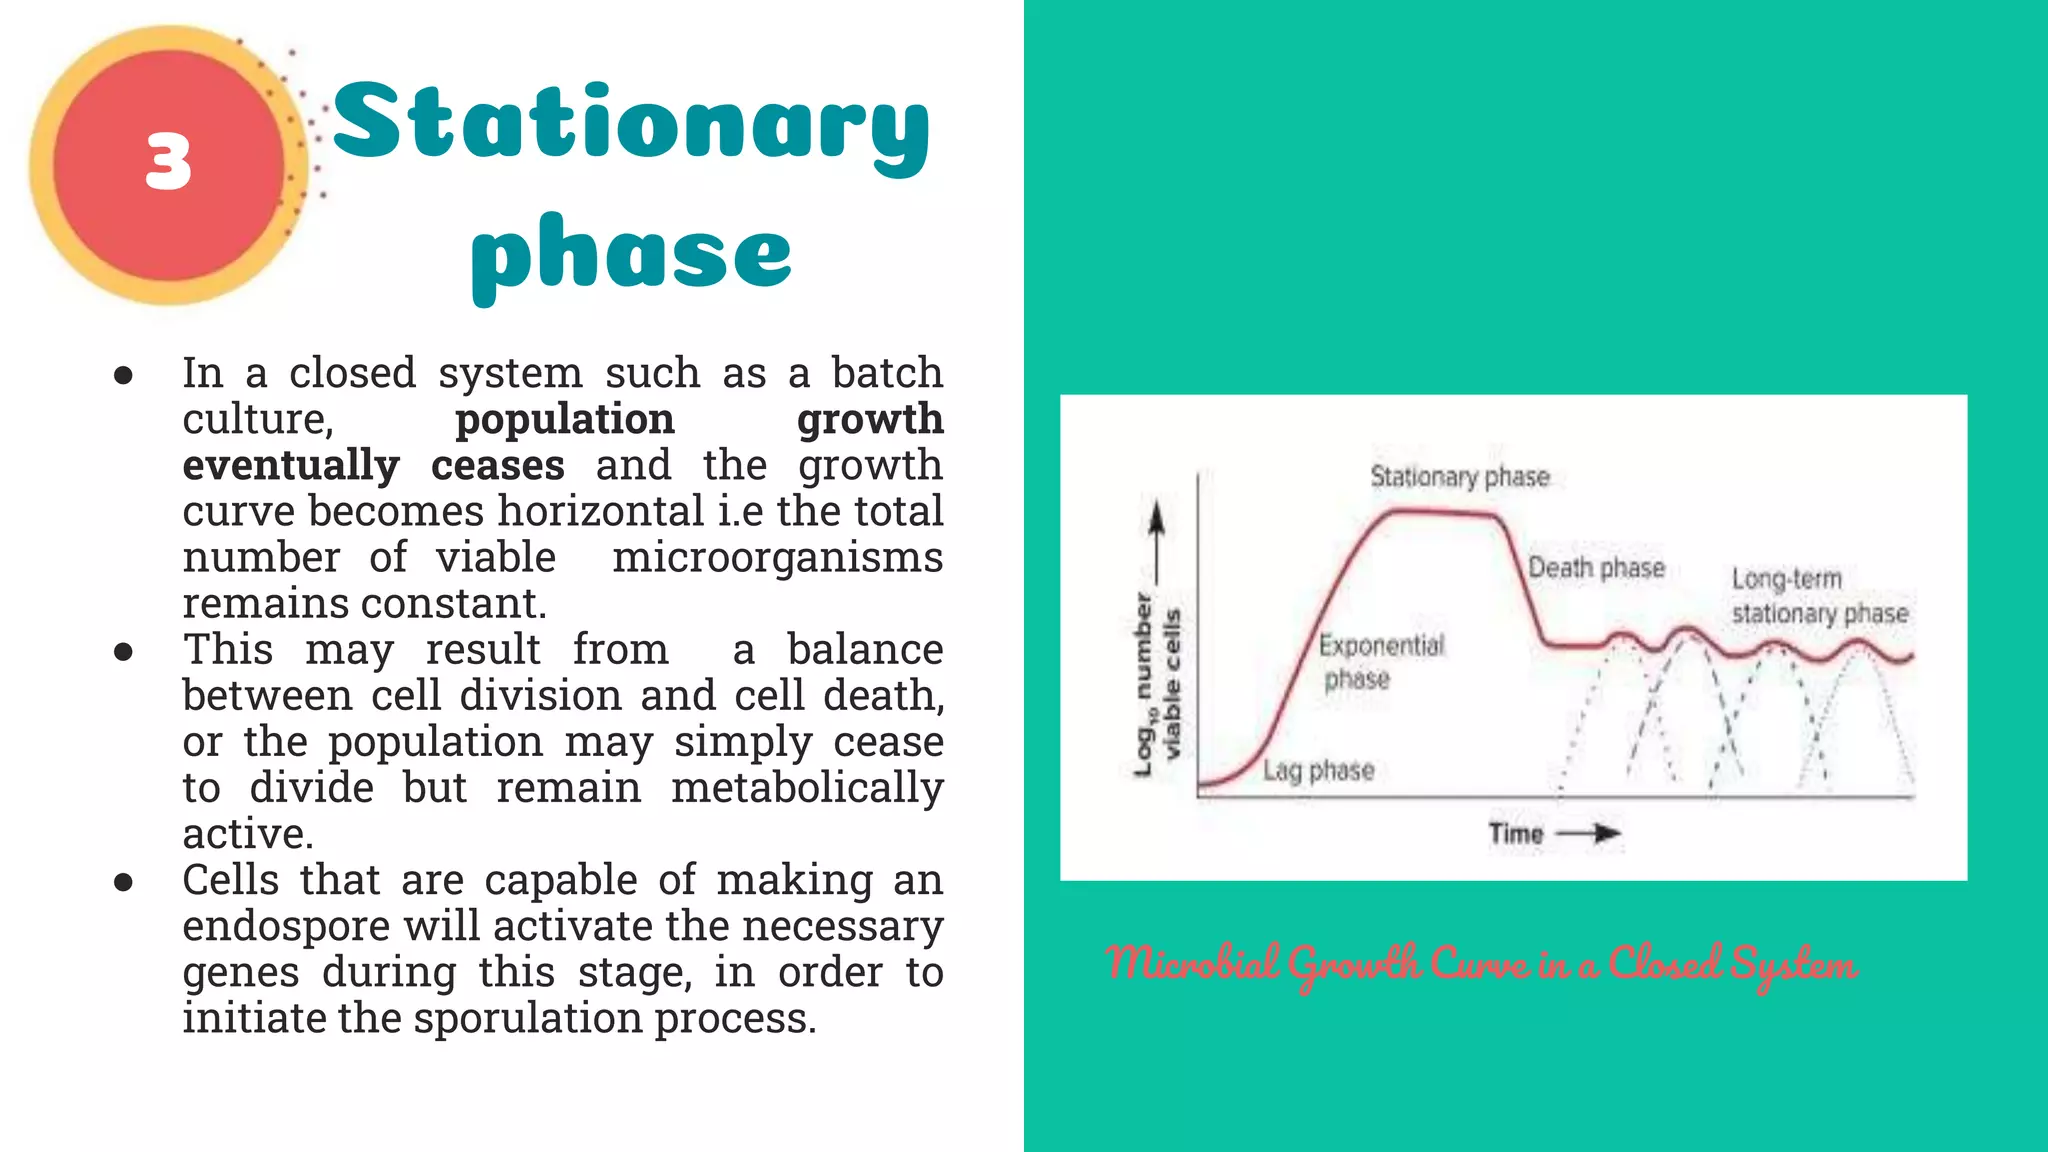
1. The document discusses microbial growth curves and the different phases of bacterial growth: lag, exponential, stationary, and death phase.
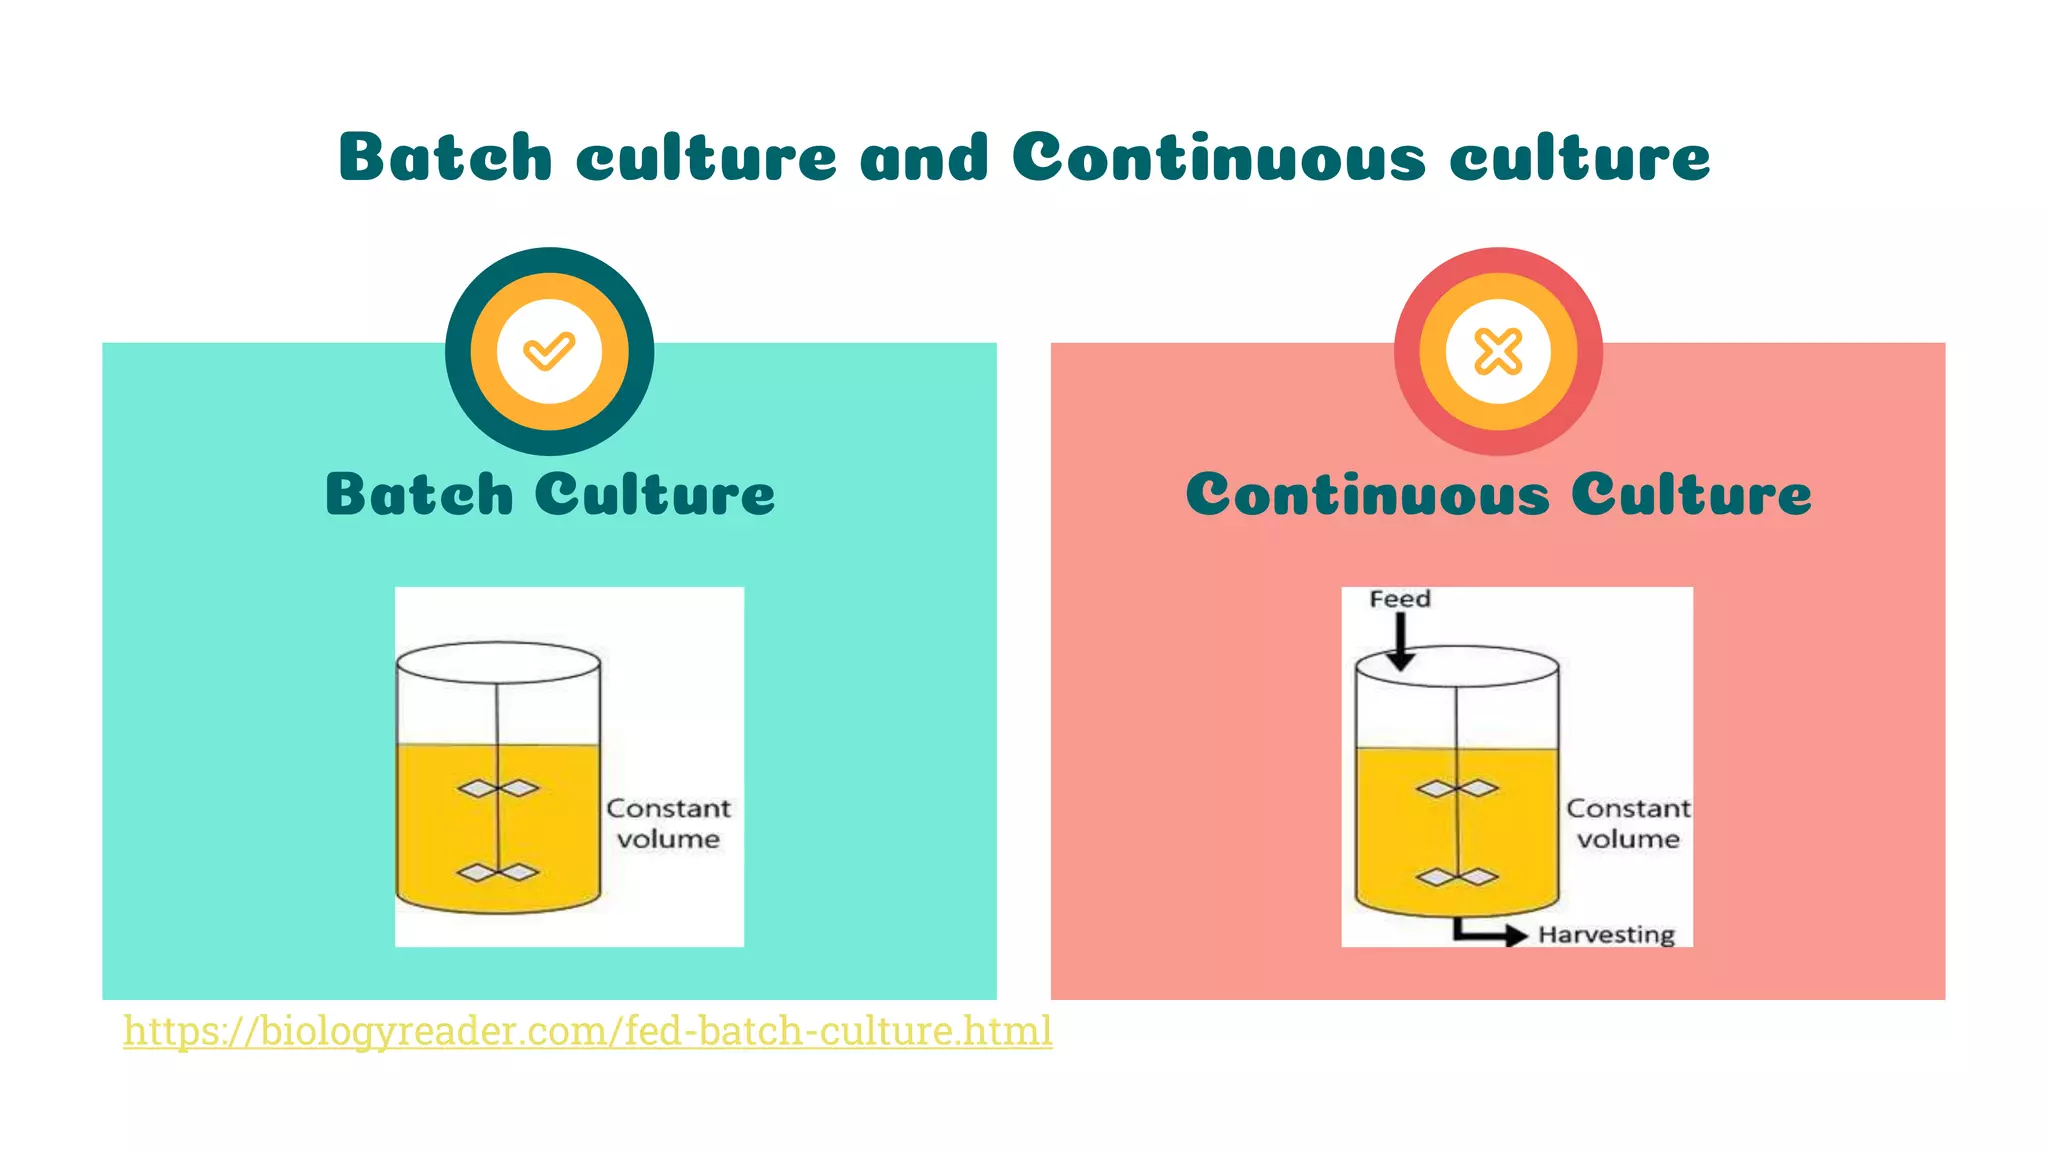
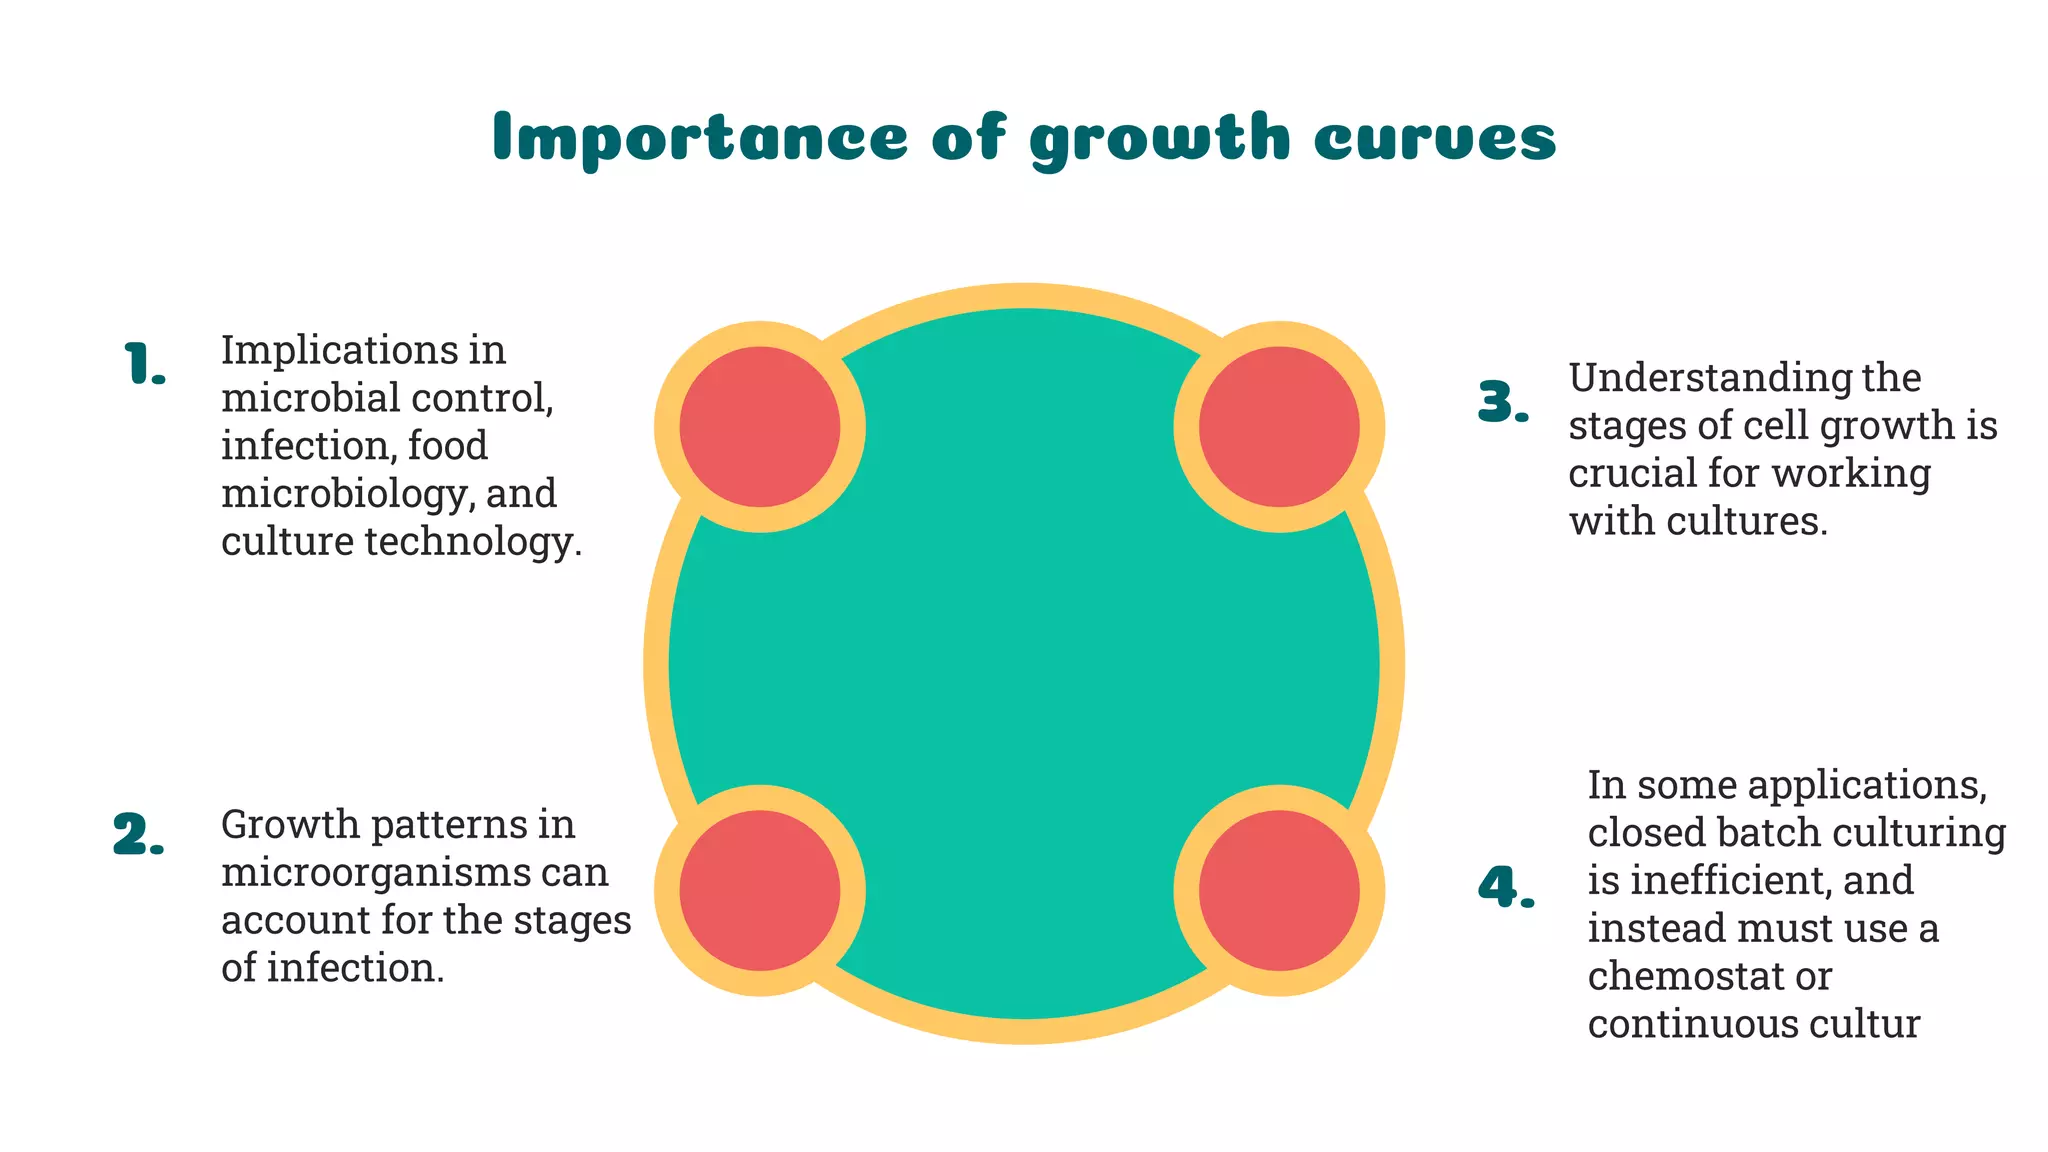
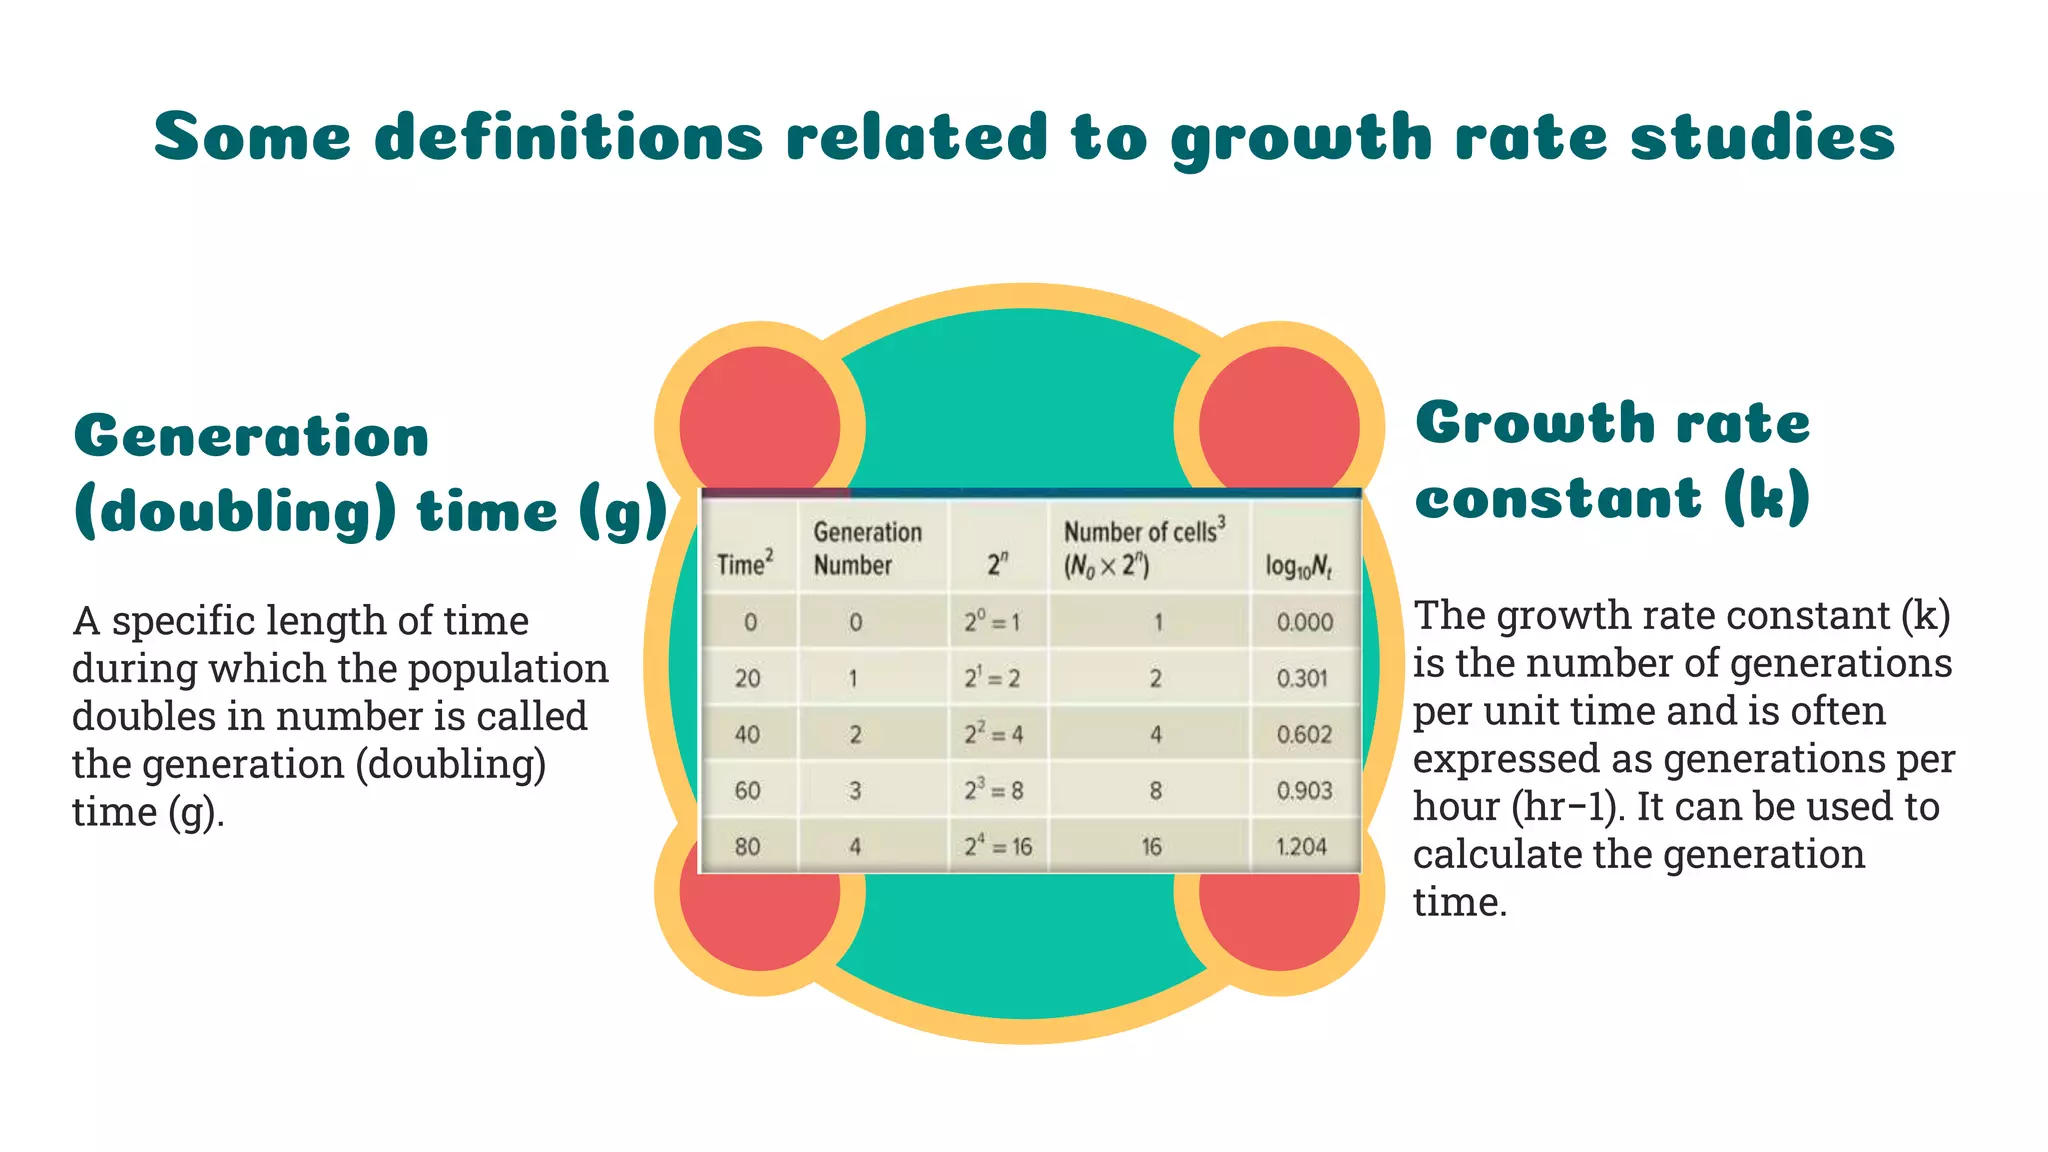
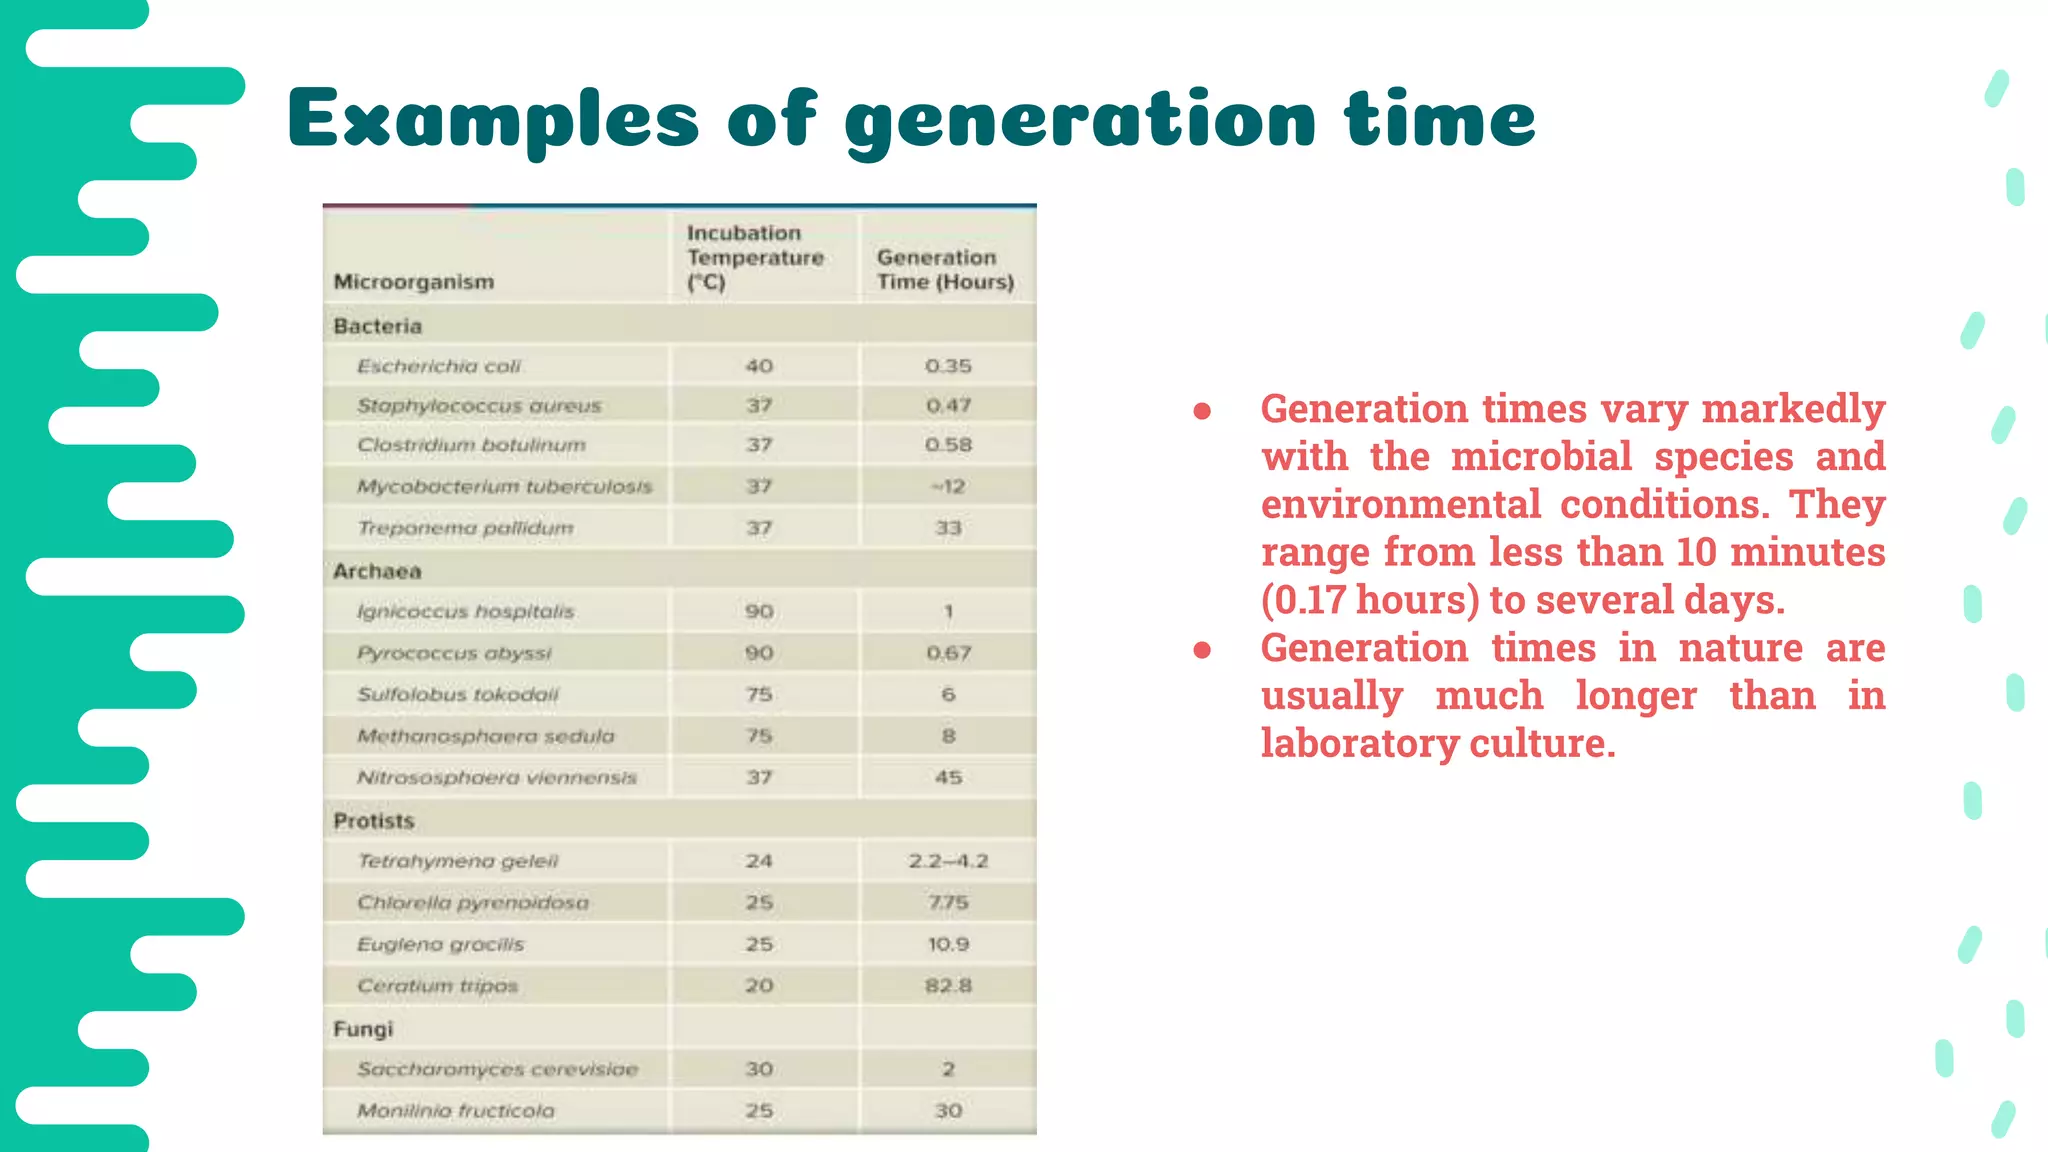
2. It explains key concepts like generation time, growth rate constant, batch and continuous culture techniques, and the importance of understanding growth curves.
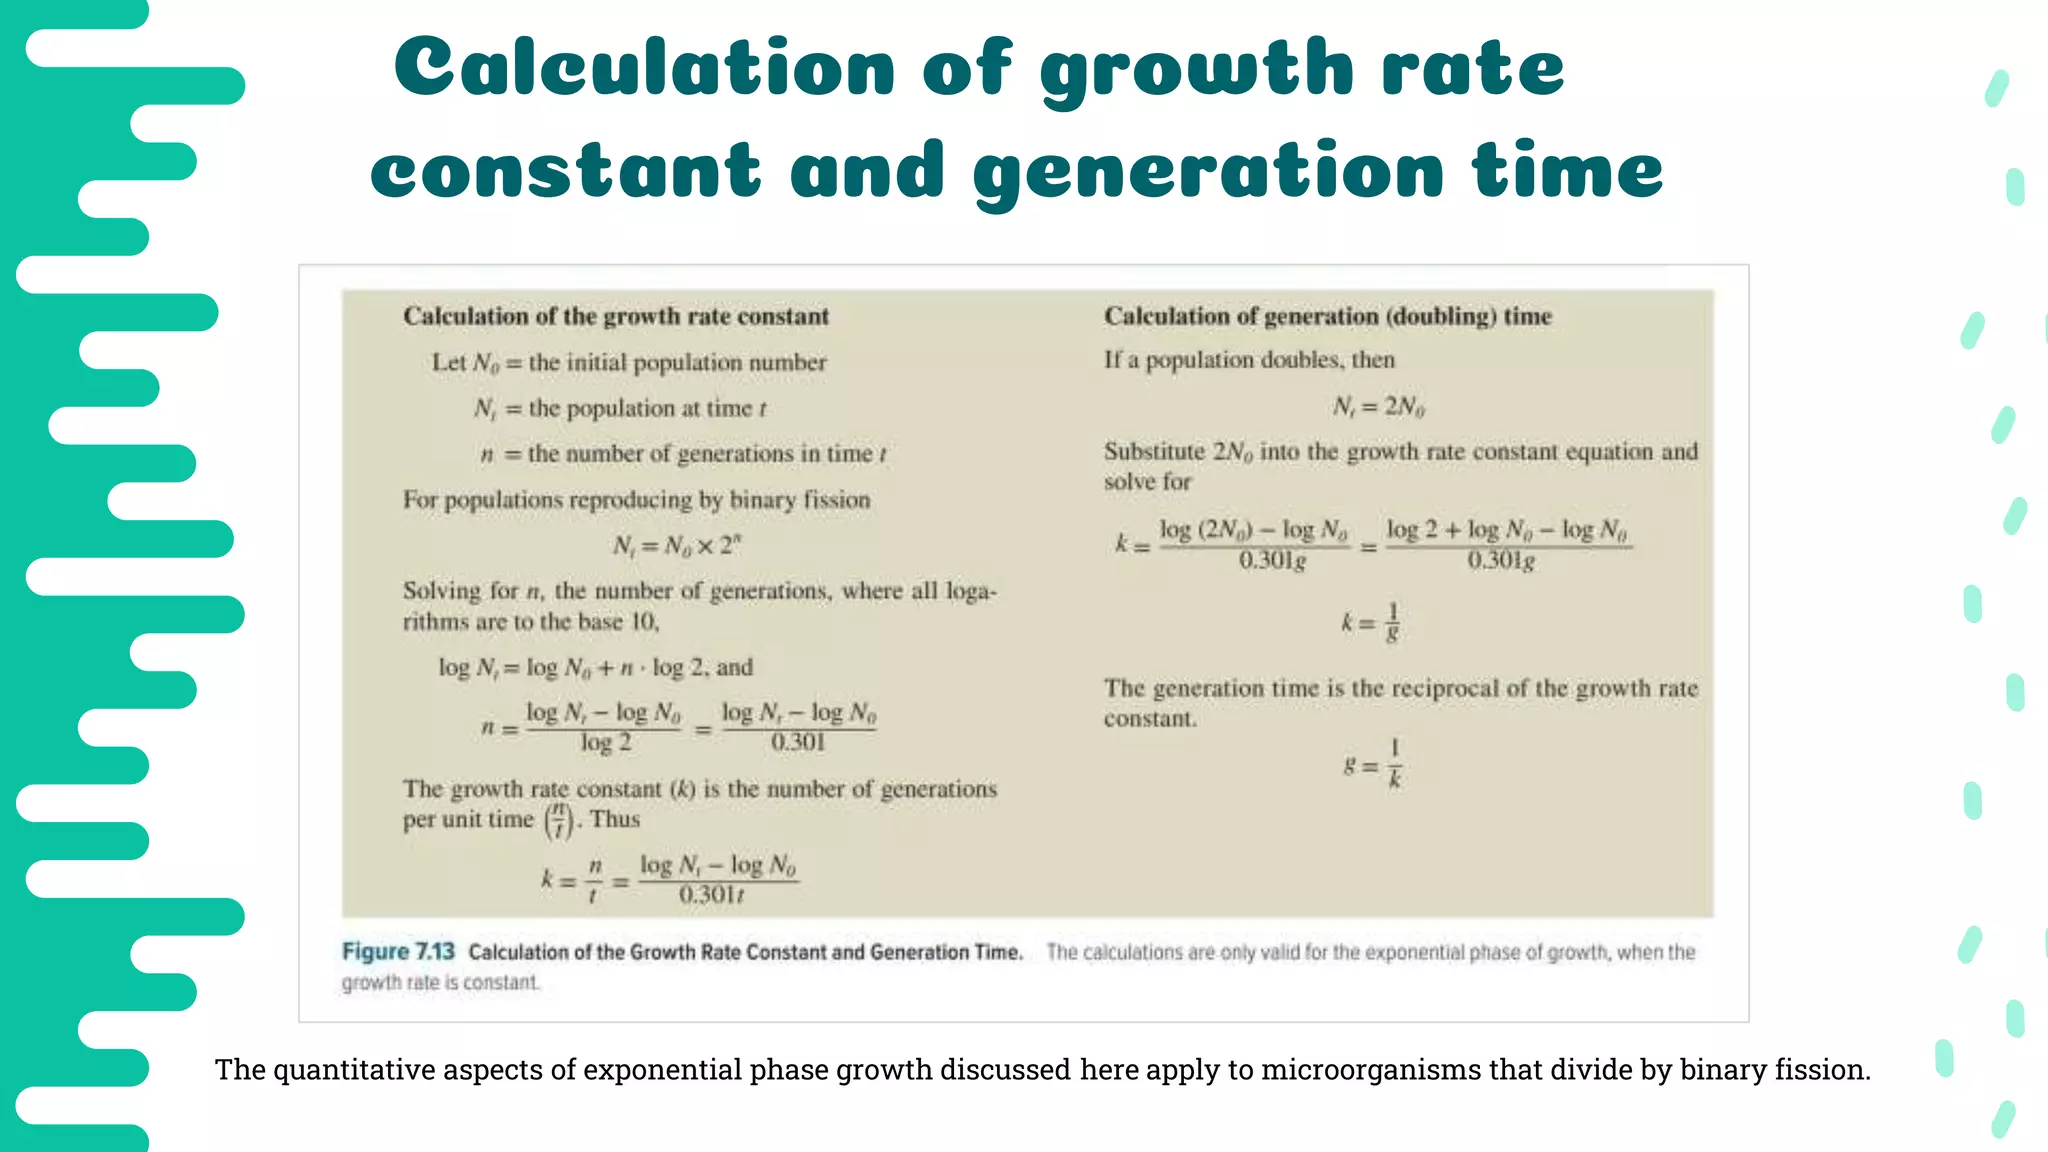
3. The mathematics of growth is also covered, including definitions and calculations of generation time and growth rate constant.