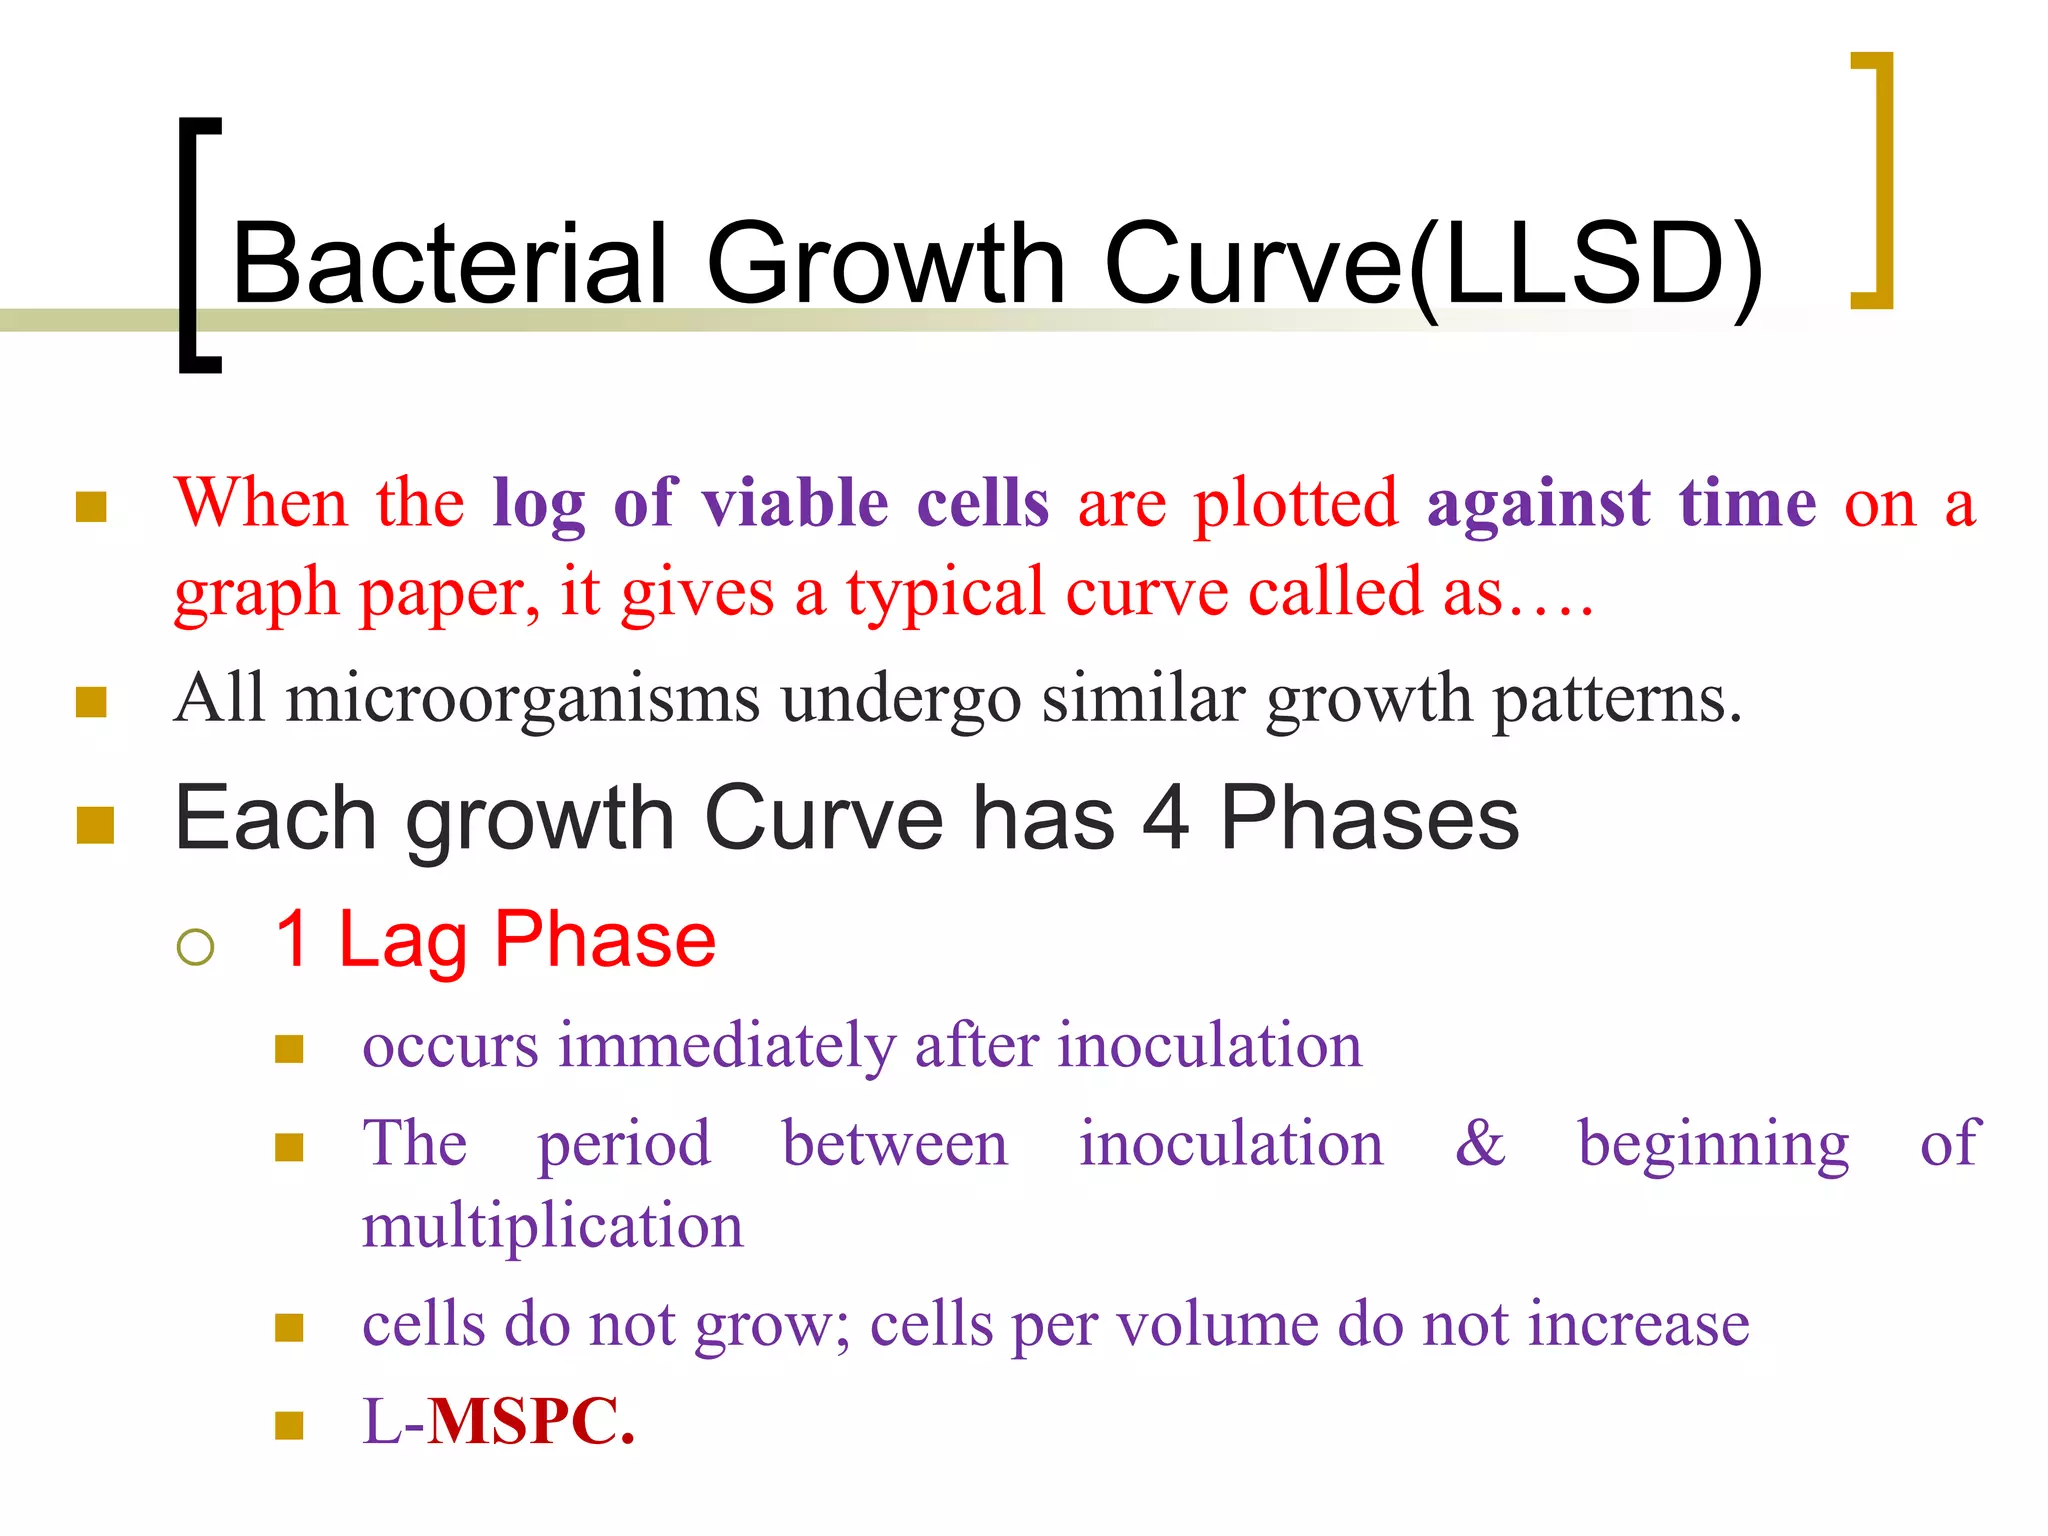
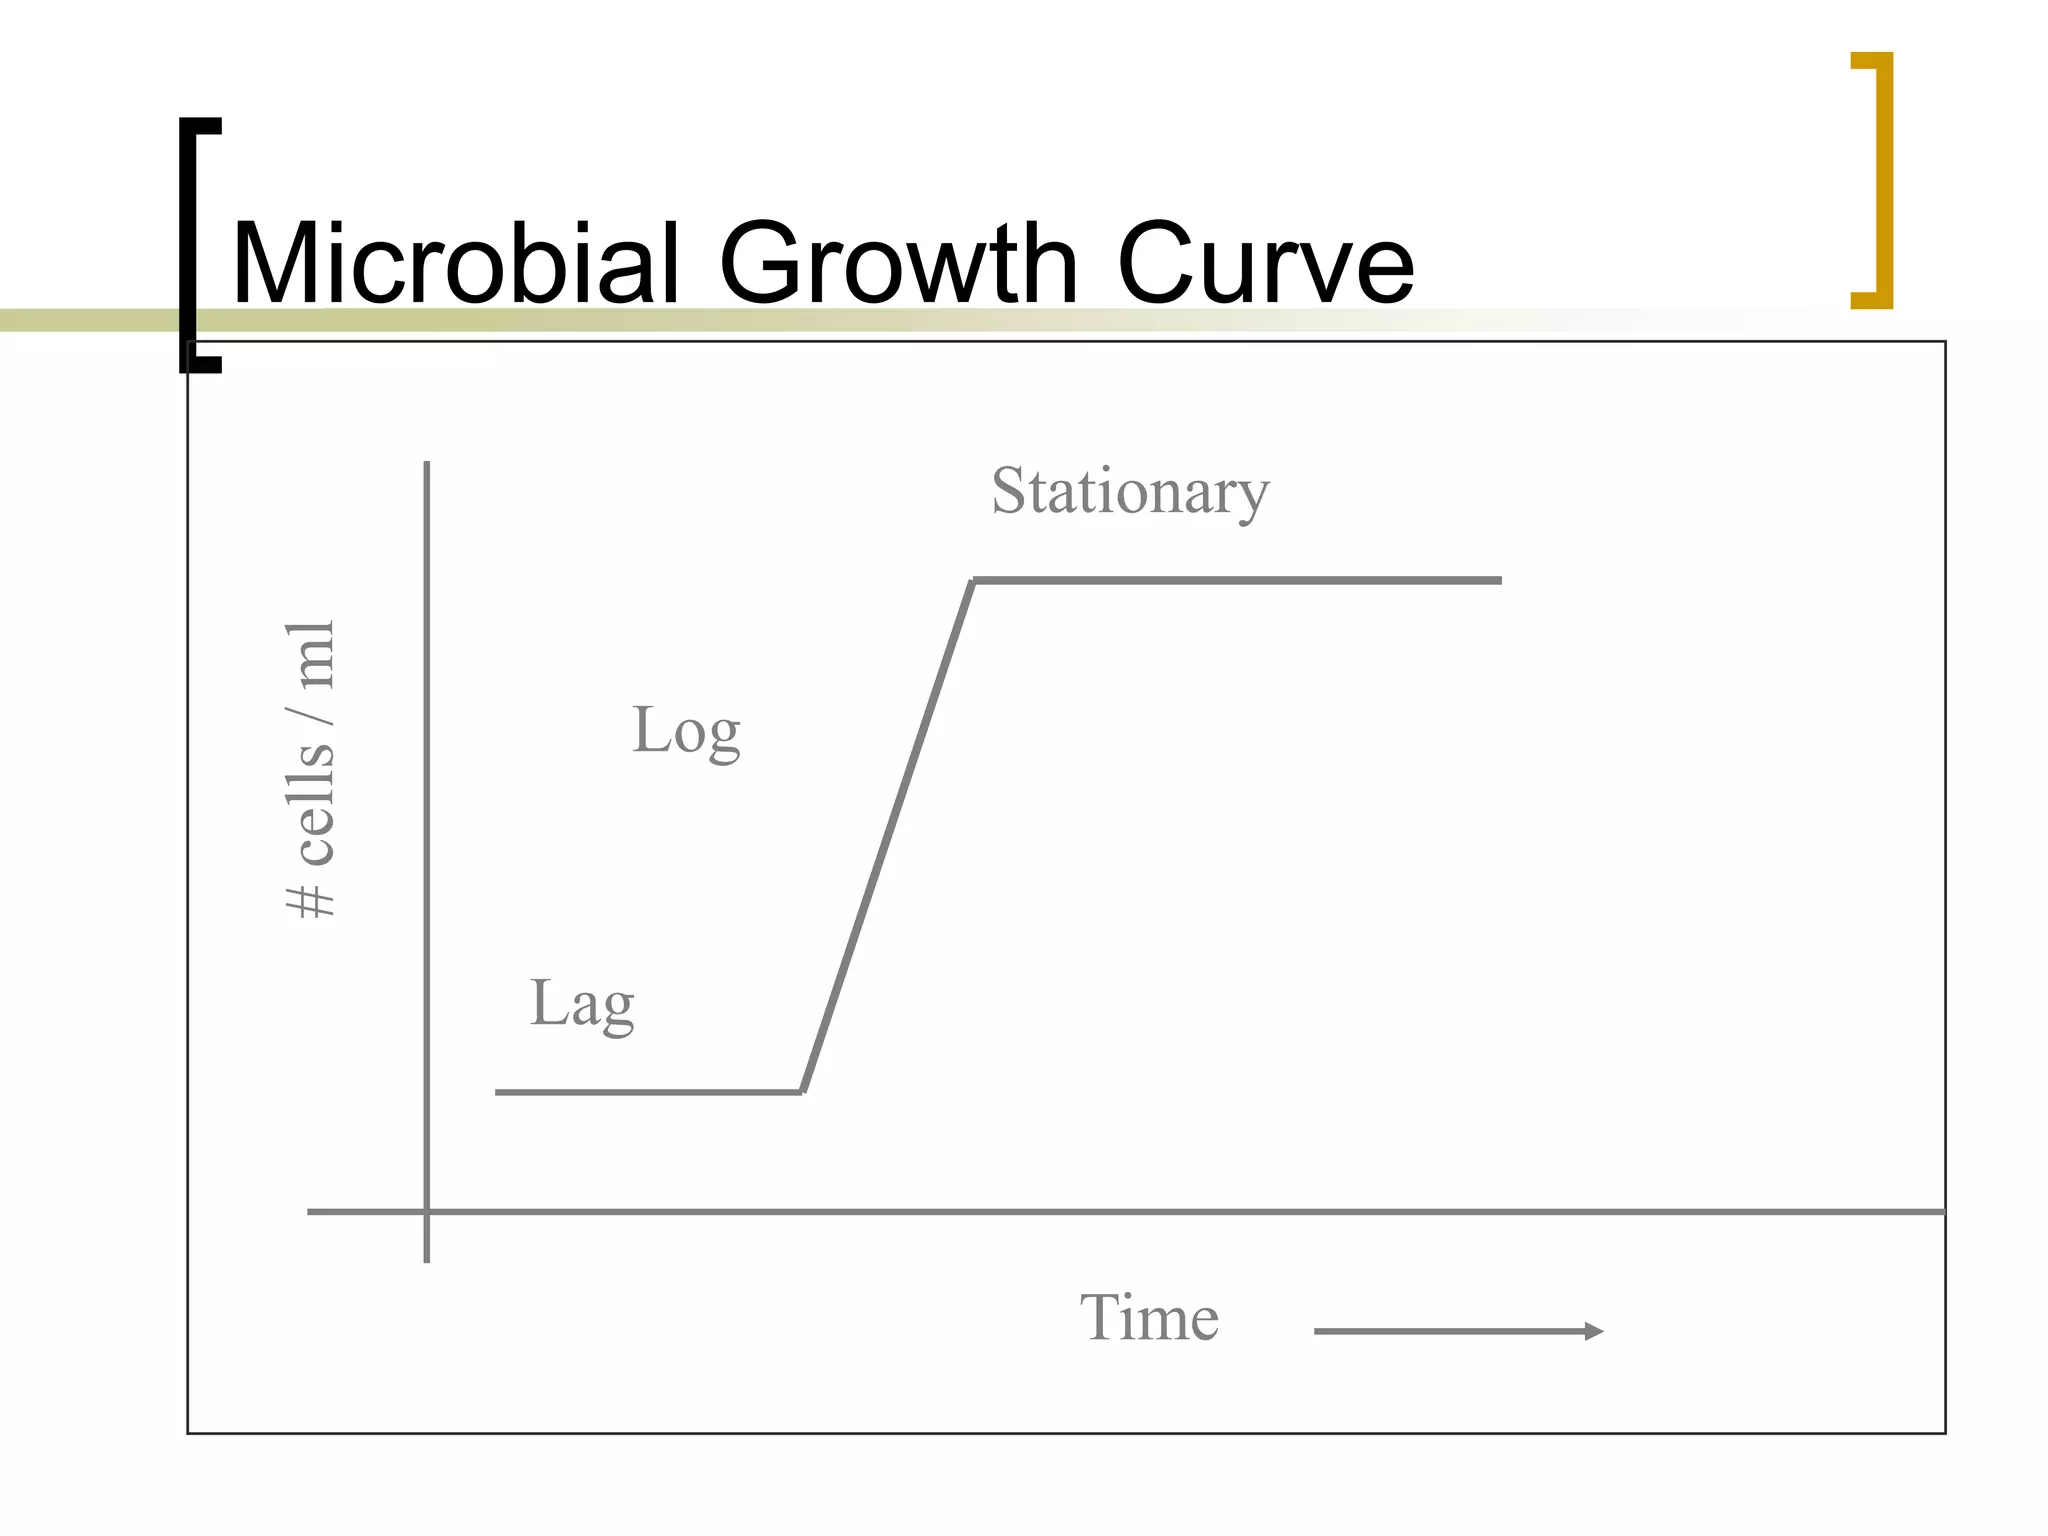
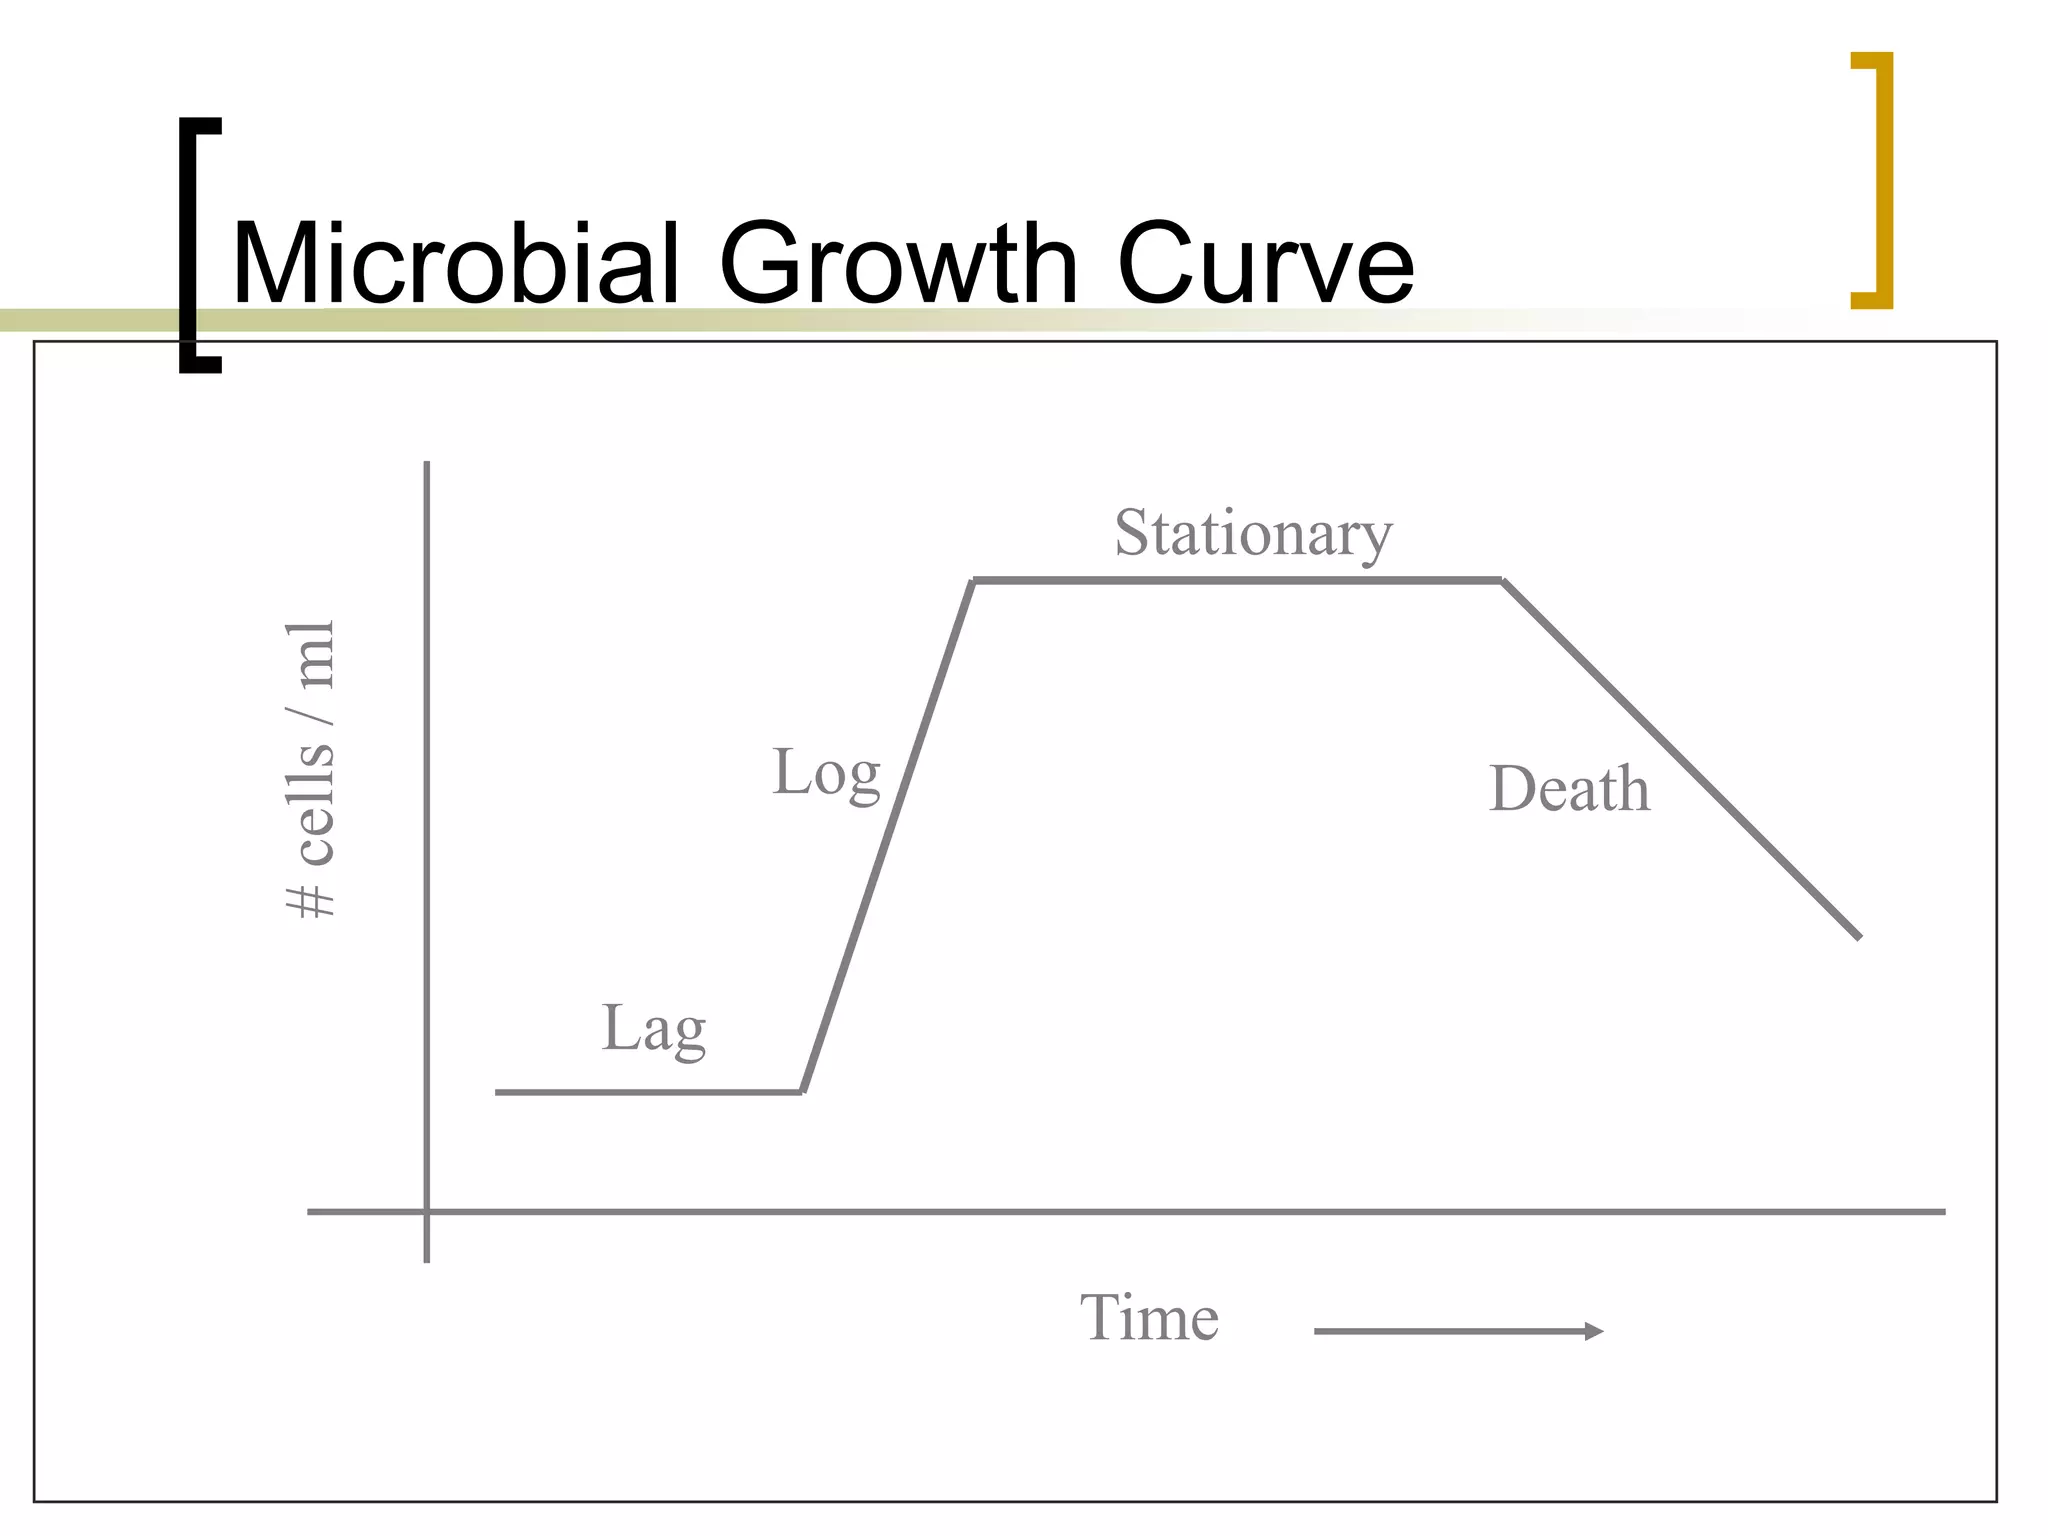
Bacterial Growth
 An Increase in Population Number
 Not an Increase in Cell Size
Bacterial Growth Curve(LLSD)
 When the log of viable cells are plotted against time on a
graph paper, it gives a typical curve called as….
 All microorganisms undergo similar growth patterns.
 Each growth Curve has 4 Phases
 1 Lag Phase
 occurs immediately after inoculation
 The period between inoculation & beginning of
multiplication
 cells do not grow; cells per volume do not increase
 L-MSPC.
Microbial Growth Curve
Time
#
cells
/
ml
Lag
Microbial Growth Curve
Time
#
cells
/
ml
Lag
Log
Microbial Growth Curve
 2.) Log/Growth/Exponential Phase
 During this phase the microbe is growing at
the maximum rate possible.
 Cells per volume increases dramatically
 Most research is performed on cells during
log phase.
Microbial Growth Curve
Time
#
cells
/
ml
Lag
Log
Stationary
Microbial Growth Curve
 3.) Stationary Phase
 Growth levels off.
 Cells per volume does not increase or
decrease
 Growth Rate = Death Rate
 Due to
 Depletion of Nutrients
 Increase in Waste Products
Microbial Growth Curve
Time
#
cells
/
ml
Lag
Log
Stationary
Death
Microbial Growth Curve
 4.) Death Phase(Logarithmic death phase)
 Death Rate exceeds Growth Rate
 Cells per volume decreases
 Due to:
 Very low concentrations of Nutrients
 Very high concentrations of Waste Products
Terms
 Growth Rate
 Number of doublings (cell divisions) per
hour
 Doubling Time (Generation Time)
 Length of time required for a cell to divide
during log growth
 Doubling Time = 1/Growth Rate

BACTERIAL GROWTH CURVE.ppt