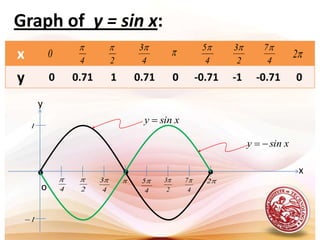
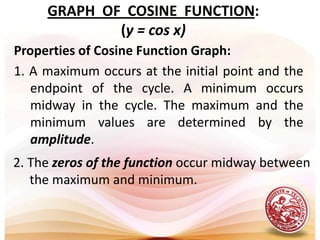
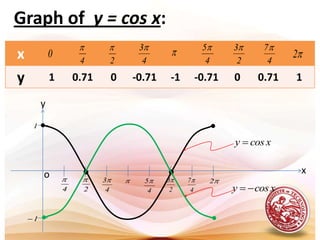
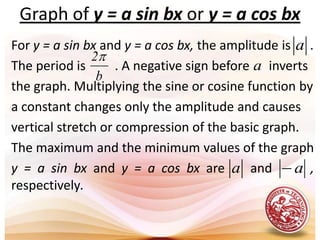
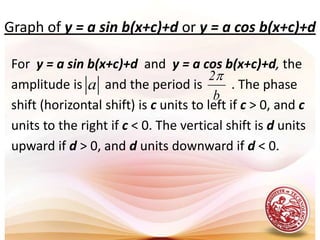
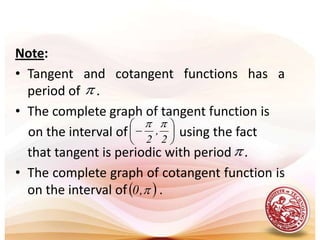
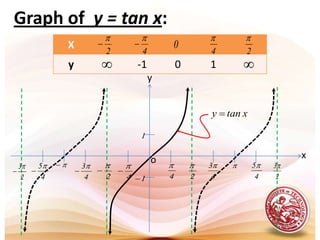
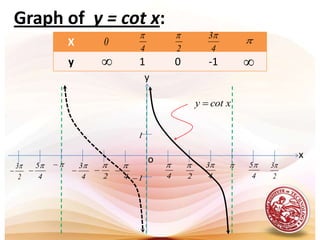
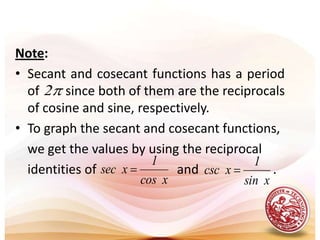
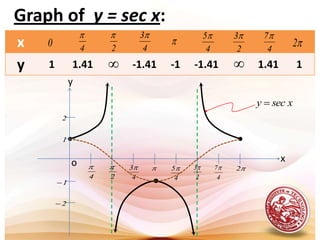
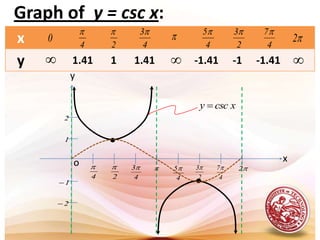
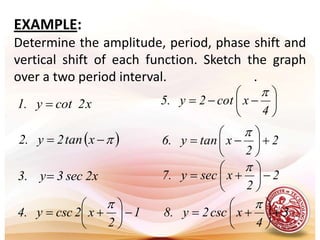
The document summarizes the key properties and graphs of six trigonometric functions: sine, cosine, tangent, cotangent, secant, and cosecant. For each function, it discusses amplitude, period, zeros or asymptotes, and shows an example graph over one period. It also covers transformations of trig functions that change amplitude, period, phase and vertical shifts.
Materi kuliah tentang Aplikasi Integral. Cari lebih banyak mata kuliah Semester 1 di: http://muhammadhabibielecture.blogspot.com/2014/12/kuliah-semester-1-thp-ftp-ub.html
Discusses trigonometric functions, graphing, and defining using the Unit Circle. Explains how to convert from radians to degrees, and vice versa. Describes how to calculate arc lengths in given circles.
We cover the inverses to the trigonometric functions sine, cosine, tangent, cotangent, secant, cosecant, and their derivatives. The remarkable fact is that although these functions and their inverses are transcendental (complicated) functions, the derivatives are algebraic functions. Also, we meet my all-time favorite function: arctan.
This is a simple PowerPoint on the properties of Sine and Cosine functions. It was created for a student teaching lesson that I had in the past. Feel free to use and modify! :-)
The data is present below the pictures so as to edit it as per your needs. I wanted to use good fonts and this was the only way i could do it as the fonts would not be available on your computer.
Generating a custom Ruby SDK for your web service or Rails API using Smithyg2nightmarescribd
Have you ever wanted a Ruby client API to communicate with your web service? Smithy is a protocol-agnostic language for defining services and SDKs. Smithy Ruby is an implementation of Smithy that generates a Ruby SDK using a Smithy model. In this talk, we will explore Smithy and Smithy Ruby to learn how to generate custom feature-rich SDKs that can communicate with any web service, such as a Rails JSON API.
UiPath Test Automation using UiPath Test Suite series, part 4DianaGray10
Welcome to UiPath Test Automation using UiPath Test Suite series part 4. In this session, we will cover Test Manager overview along with SAP heatmap.
The UiPath Test Manager overview with SAP heatmap webinar offers a concise yet comprehensive exploration of the role of a Test Manager within SAP environments, coupled with the utilization of heatmaps for effective testing strategies.
Participants will gain insights into the responsibilities, challenges, and best practices associated with test management in SAP projects. Additionally, the webinar delves into the significance of heatmaps as a visual aid for identifying testing priorities, areas of risk, and resource allocation within SAP landscapes. Through this session, attendees can expect to enhance their understanding of test management principles while learning practical approaches to optimize testing processes in SAP environments using heatmap visualization techniques
What will you get from this session?
1. Insights into SAP testing best practices
2. Heatmap utilization for testing
3. Optimization of testing processes
4. Demo
Topics covered:
Execution from the test manager
Orchestrator execution result
Defect reporting
SAP heatmap example with demo
Speaker:
Deepak Rai, Automation Practice Lead, Boundaryless Group and UiPath MVP
GraphRAG is All You need? LLM & Knowledge GraphGuy Korland
Guy Korland, CEO and Co-founder of FalkorDB, will review two articles on the integration of language models with knowledge graphs.
1. Unifying Large Language Models and Knowledge Graphs: A Roadmap.
https://arxiv.org/abs/2306.08302
2. Microsoft Research's GraphRAG paper and a review paper on various uses of knowledge graphs:
https://www.microsoft.com/en-us/research/blog/graphrag-unlocking-llm-discovery-on-narrative-private-data/
Neuro-symbolic is not enough, we need neuro-*semantic*Frank van Harmelen
Neuro-symbolic (NeSy) AI is on the rise. However, simply machine learning on just any symbolic structure is not sufficient to really harvest the gains of NeSy. These will only be gained when the symbolic structures have an actual semantics. I give an operational definition of semantics as “predictable inference”.
All of this illustrated with link prediction over knowledge graphs, but the argument is general.
DevOps and Testing slides at DASA ConnectKari Kakkonen
My and Rik Marselis slides at 30.5.2024 DASA Connect conference. We discuss about what is testing, then what is agile testing and finally what is Testing in DevOps. Finally we had lovely workshop with the participants trying to find out different ways to think about quality and testing in different parts of the DevOps infinity loop.
State of ICS and IoT Cyber Threat Landscape Report 2024 previewPrayukth K V
The IoT and OT threat landscape report has been prepared by the Threat Research Team at Sectrio using data from Sectrio, cyber threat intelligence farming facilities spread across over 85 cities around the world. In addition, Sectrio also runs AI-based advanced threat and payload engagement facilities that serve as sinks to attract and engage sophisticated threat actors, and newer malware including new variants and latent threats that are at an earlier stage of development.
The latest edition of the OT/ICS and IoT security Threat Landscape Report 2024 also covers:
State of global ICS asset and network exposure
Sectoral targets and attacks as well as the cost of ransom
Global APT activity, AI usage, actor and tactic profiles, and implications
Rise in volumes of AI-powered cyberattacks
Major cyber events in 2024
Malware and malicious payload trends
Cyberattack types and targets
Vulnerability exploit attempts on CVEs
Attacks on counties – USA
Expansion of bot farms – how, where, and why
In-depth analysis of the cyber threat landscape across North America, South America, Europe, APAC, and the Middle East
Why are attacks on smart factories rising?
Cyber risk predictions
Axis of attacks – Europe
Systemic attacks in the Middle East
Download the full report from here:
https://sectrio.com/resources/ot-threat-landscape-reports/sectrio-releases-ot-ics-and-iot-security-threat-landscape-report-2024/
Slack (or Teams) Automation for Bonterra Impact Management (fka Social Soluti...Jeffrey Haguewood
Sidekick Solutions uses Bonterra Impact Management (fka Social Solutions Apricot) and automation solutions to integrate data for business workflows.
We believe integration and automation are essential to user experience and the promise of efficient work through technology. Automation is the critical ingredient to realizing that full vision. We develop integration products and services for Bonterra Case Management software to support the deployment of automations for a variety of use cases.
This video focuses on the notifications, alerts, and approval requests using Slack for Bonterra Impact Management. The solutions covered in this webinar can also be deployed for Microsoft Teams.
Interested in deploying notification automations for Bonterra Impact Management? Contact us at sales@sidekicksolutionsllc.com to discuss next steps.
Accelerate your Kubernetes clusters with Varnish CachingThijs Feryn
A presentation about the usage and availability of Varnish on Kubernetes. This talk explores the capabilities of Varnish caching and shows how to use the Varnish Helm chart to deploy it to Kubernetes.
This presentation was delivered at K8SUG Singapore. See https://feryn.eu/presentations/accelerate-your-kubernetes-clusters-with-varnish-caching-k8sug-singapore-28-2024 for more details.
Smart TV Buyer Insights Survey 2024 by 91mobiles.pdf91mobiles
91mobiles recently conducted a Smart TV Buyer Insights Survey in which we asked over 3,000 respondents about the TV they own, aspects they look at on a new TV, and their TV buying preferences.
Encryption in Microsoft 365 - ExpertsLive Netherlands 2024Albert Hoitingh
In this session I delve into the encryption technology used in Microsoft 365 and Microsoft Purview. Including the concepts of Customer Key and Double Key Encryption.
Builder.ai Founder Sachin Dev Duggal's Strategic Approach to Create an Innova...Ramesh Iyer
In today's fast-changing business world, Companies that adapt and embrace new ideas often need help to keep up with the competition. However, fostering a culture of innovation takes much work. It takes vision, leadership and willingness to take risks in the right proportion. Sachin Dev Duggal, co-founder of Builder.ai, has perfected the art of this balance, creating a company culture where creativity and growth are nurtured at each stage.
The Art of the Pitch: WordPress Relationships and SalesLaura Byrne
Clients don’t know what they don’t know. What web solutions are right for them? How does WordPress come into the picture? How do you make sure you understand scope and timeline? What do you do if sometime changes?
All these questions and more will be explored as we talk about matching clients’ needs with what your agency offers without pulling teeth or pulling your hair out. Practical tips, and strategies for successful relationship building that leads to closing the deal.
2. GRAPH OF SINE FUNCTION: (y = sin x) Properties of Sine Function Graph: 1. The graph crosses the x-axis at the initial point, endpoint and midpoint of a cycle. These points are called the zeros of the function. 2. A maximum occurs midway between the first two zeros in the cycle, and a minimum occurs between the last two zeros. The maximum and the minimum values are determined by the amplitude.
3.
4. The graph of the function through one period is called cycle. The period of sine function is .
5.
6. GRAPH OF COSINE FUNCTION: (y = cos x) Properties of Cosine Function Graph: 1. A maximum occurs at the initial point and the endpoint of the cycle. A minimum occurs midway in the cycle. The maximum and the minimum values are determined by the amplitude. 2. The zeros of the function occur midway between the maximum and minimum.
7.
8.
9. Graph of y = a sin bxory = a cosbx For y = a sin bxand y = a cosbx, the amplitude is . The period is . A negative sign before inverts the graph. Multiplying the sine or cosine function by a constant changes only the amplitude and causes vertical stretch or compression of the basic graph. The maximum and the minimum values of the graph y = a sin bxand y = a cosbxareand , respectively.
10. Graph of y = a sin b(x+c)+d ory = a cos b(x+c)+d For y = a sin b(x+c)+d and y = a cos b(x+c)+d, the amplitude is and the period is . The phase shift (horizontal shift) is cunits to left if c > 0, and c units to the right if c < 0. The vertical shift is d units upward if d > 0, and d units downward if d < 0.
11. EXAMPLE: Determine the amplitude, period, phase shift and vertical shift of each function. Sketch the graph over the interval .
12. GRAPH OF TANGENT AND COTANGENT FUNCTIONS: The tangent function is discontinuous, since its graph has breaks. Asymptotes occur at these breaks. The amplitude is not defined because tanx increases or decreases without bound as x approaches the asymptotes. Since the tangent and cotangent functions are reciprocal functions, the value of cot xis undefined when tan x = 0, and it is zero when tan x is undefined.
16. GRAPH OF SECANT AND COSECANT FUNCTIONS: The graph of secant and cosecant functions are discontinuous and has asymptotes since secant and cosecant functions are not defined when the values of cosine and sine are equal to zero, respectively. The amplitude is not defined because the graph increases or decreases without bound as x approaches the asymptotes.
17.
18. To graph the secant and cosecant functions, we get the values by using the reciprocal identities of and .