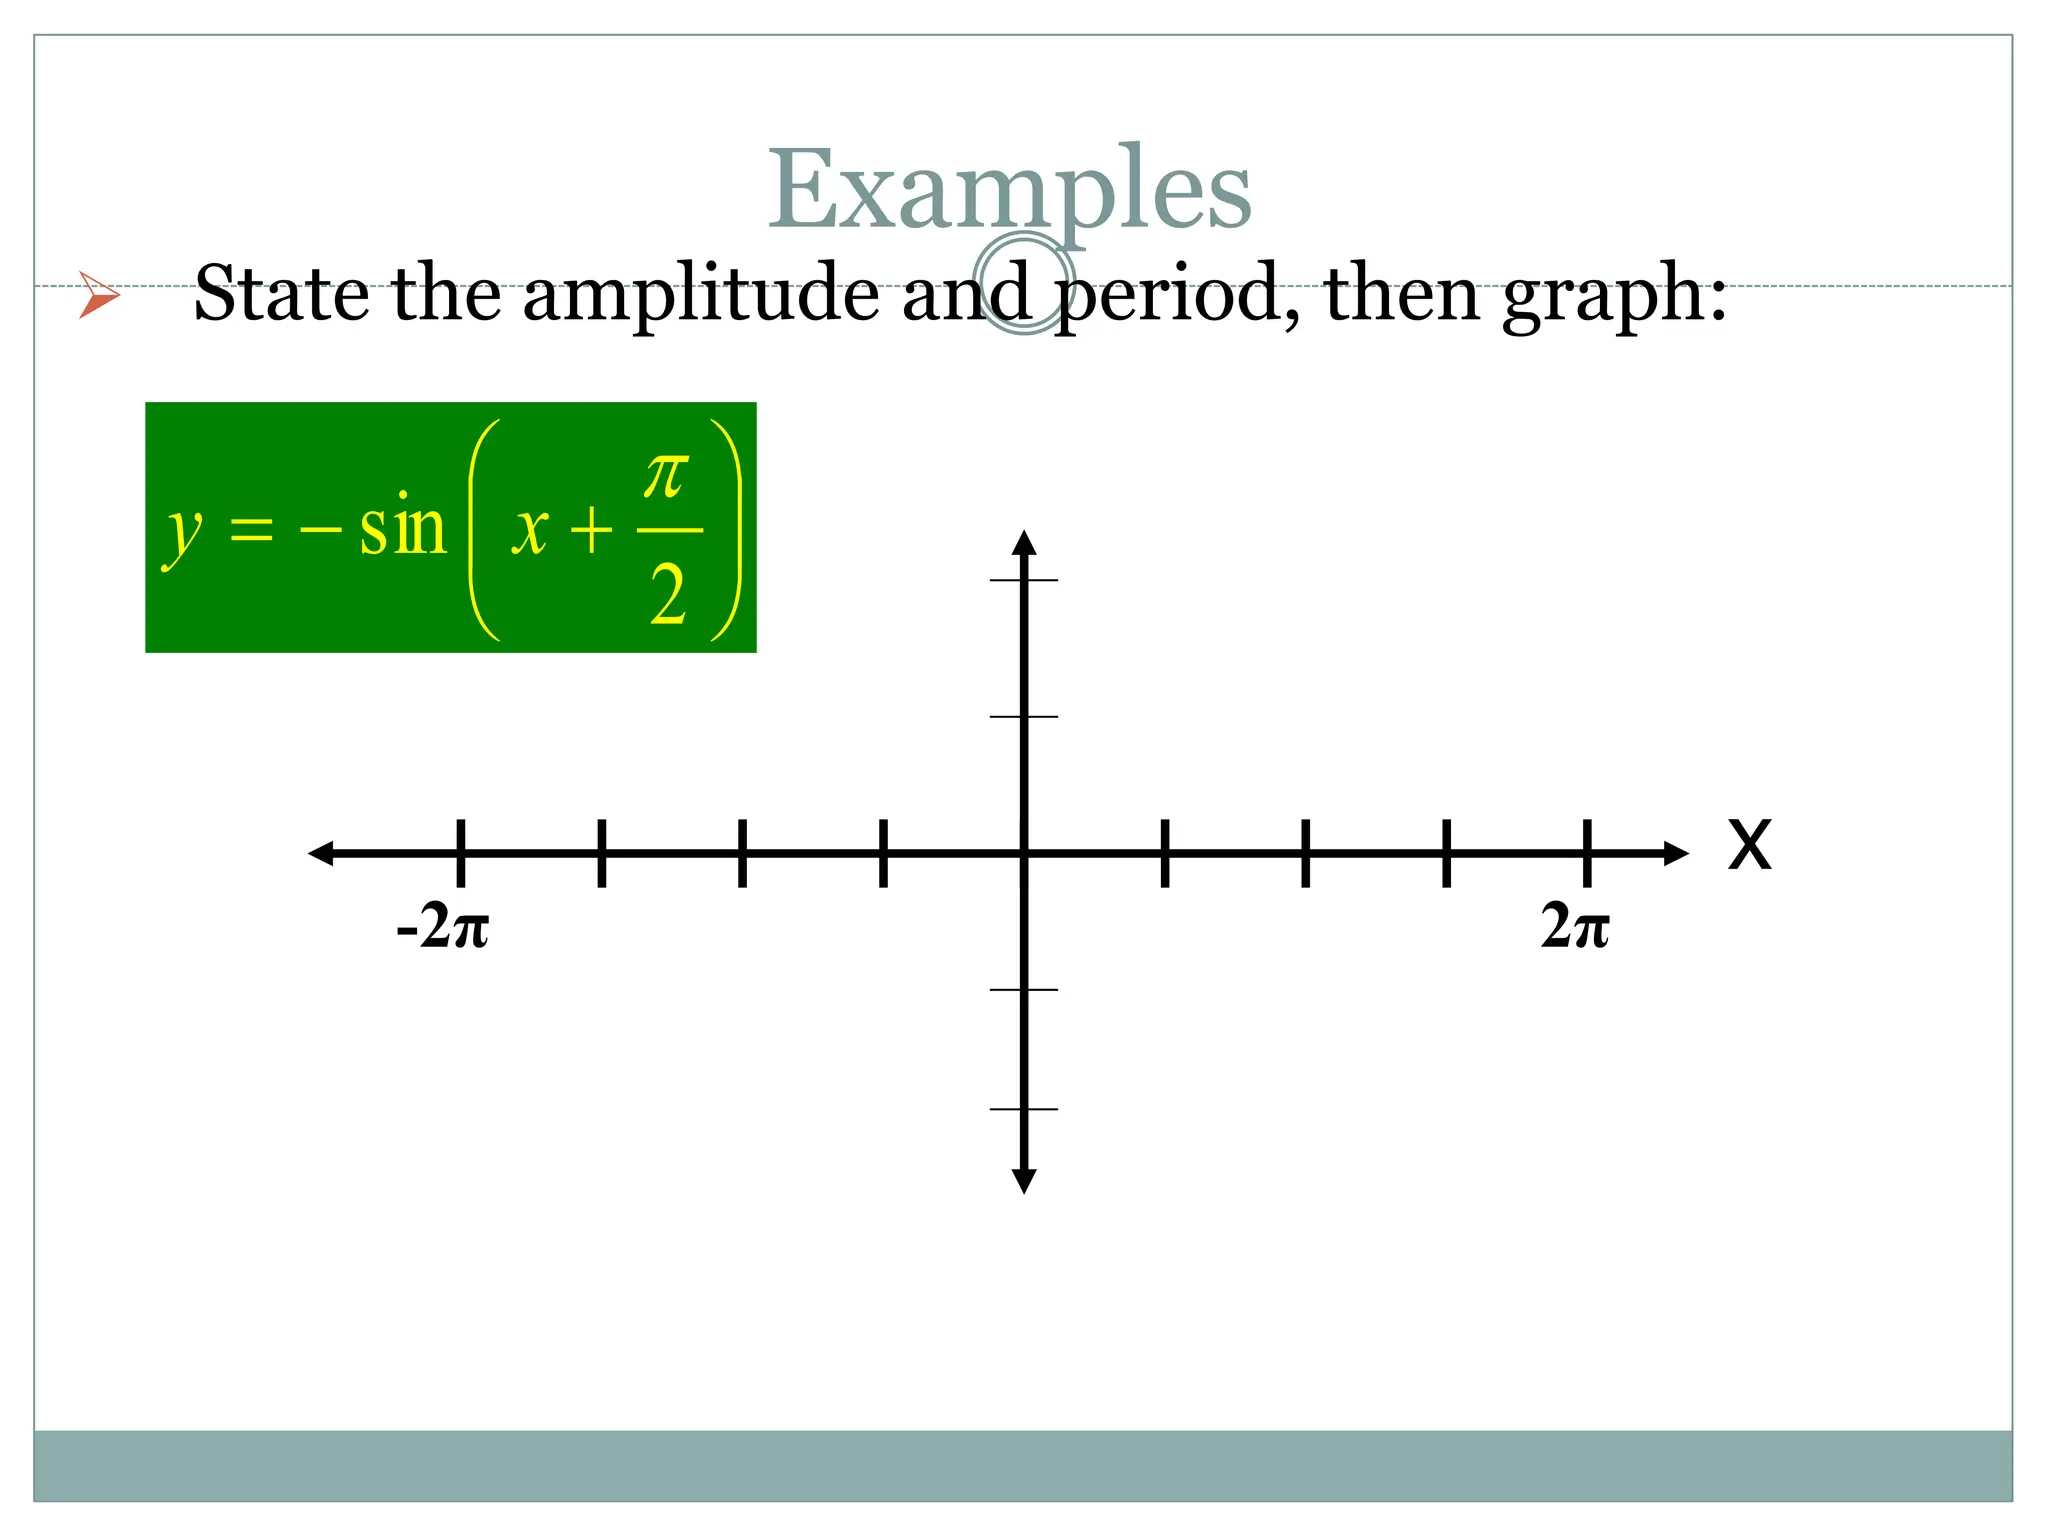
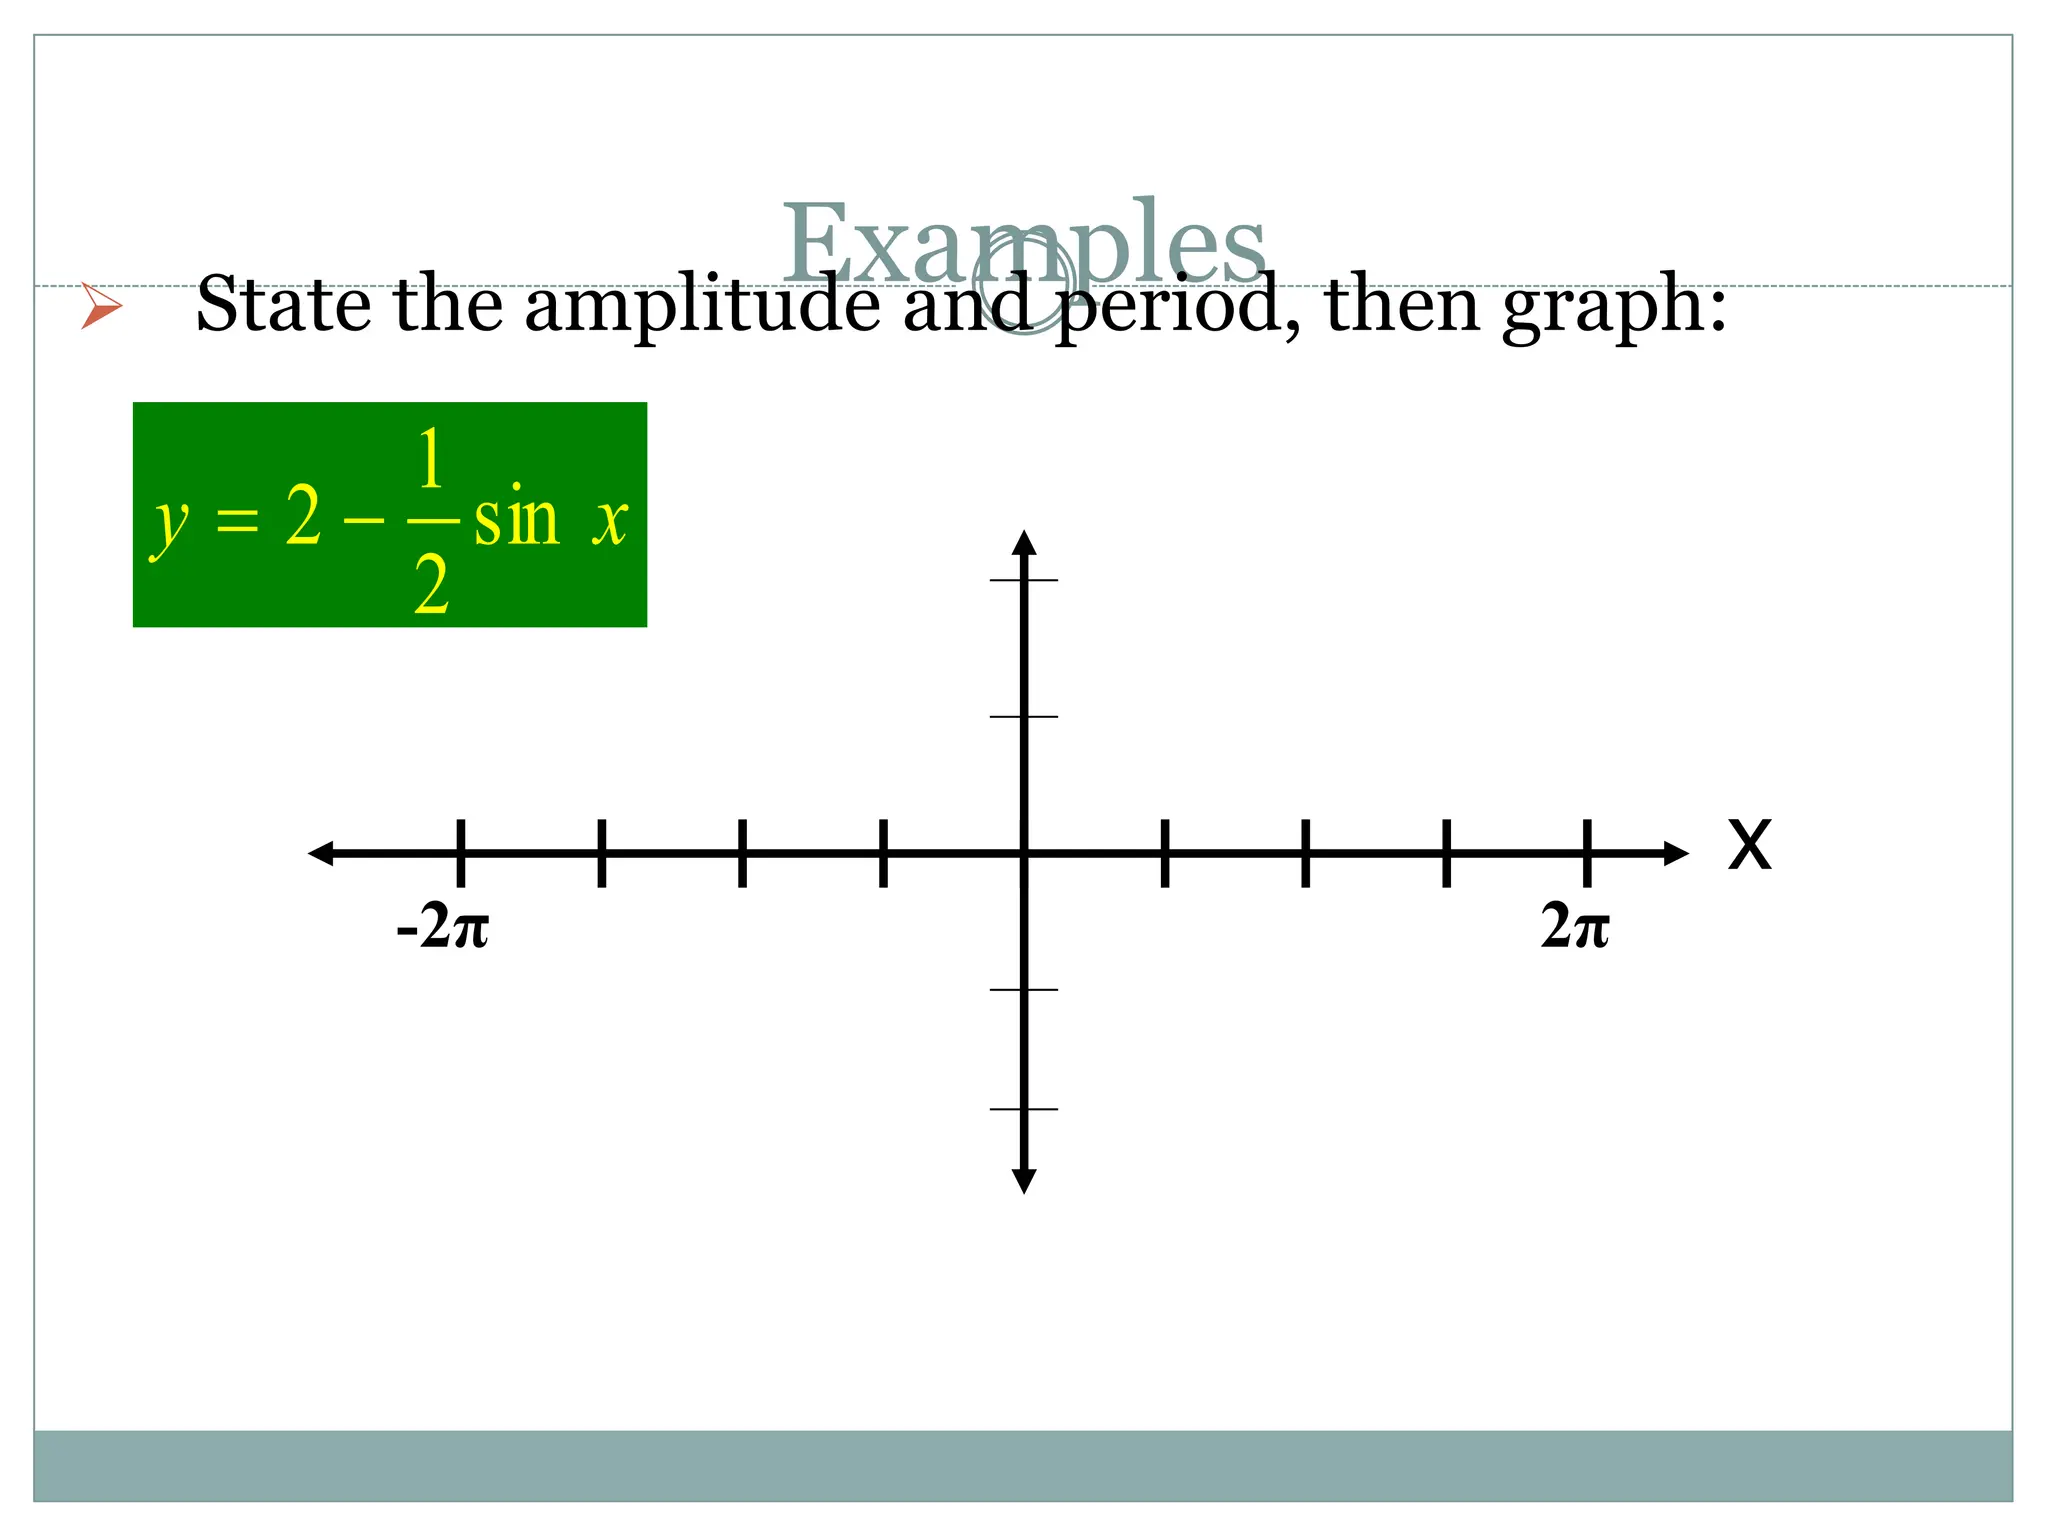
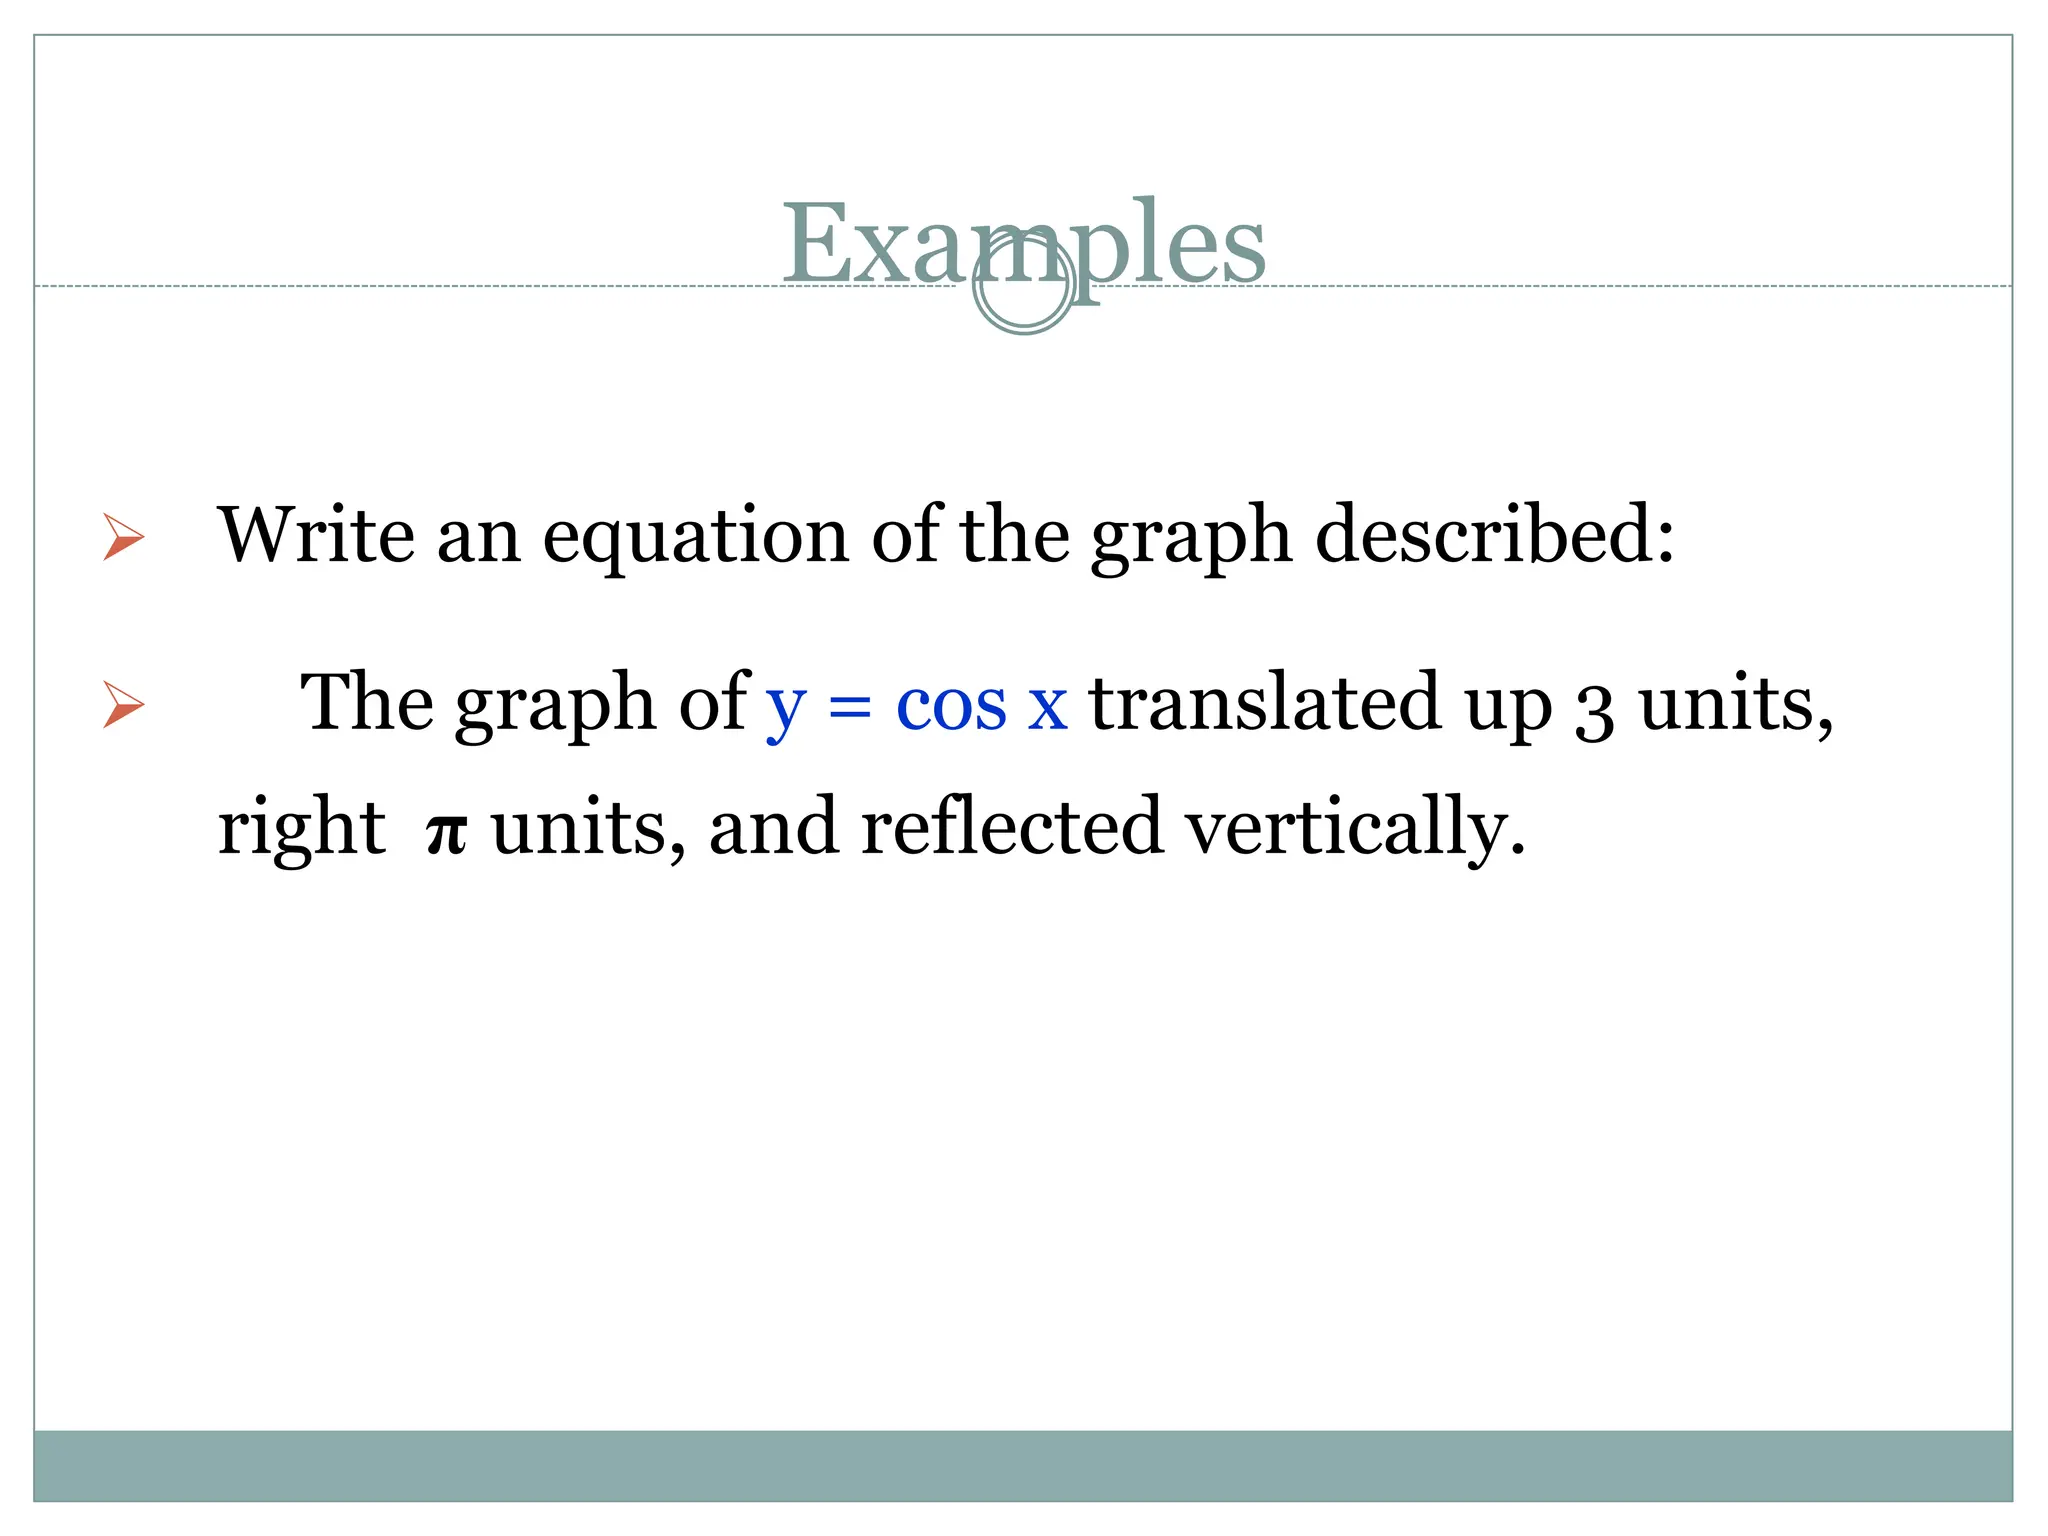
1. The document discusses trigonometric functions including sine, cosine, tangent, and cotangent. It defines their domains, ranges, and periodic behavior.
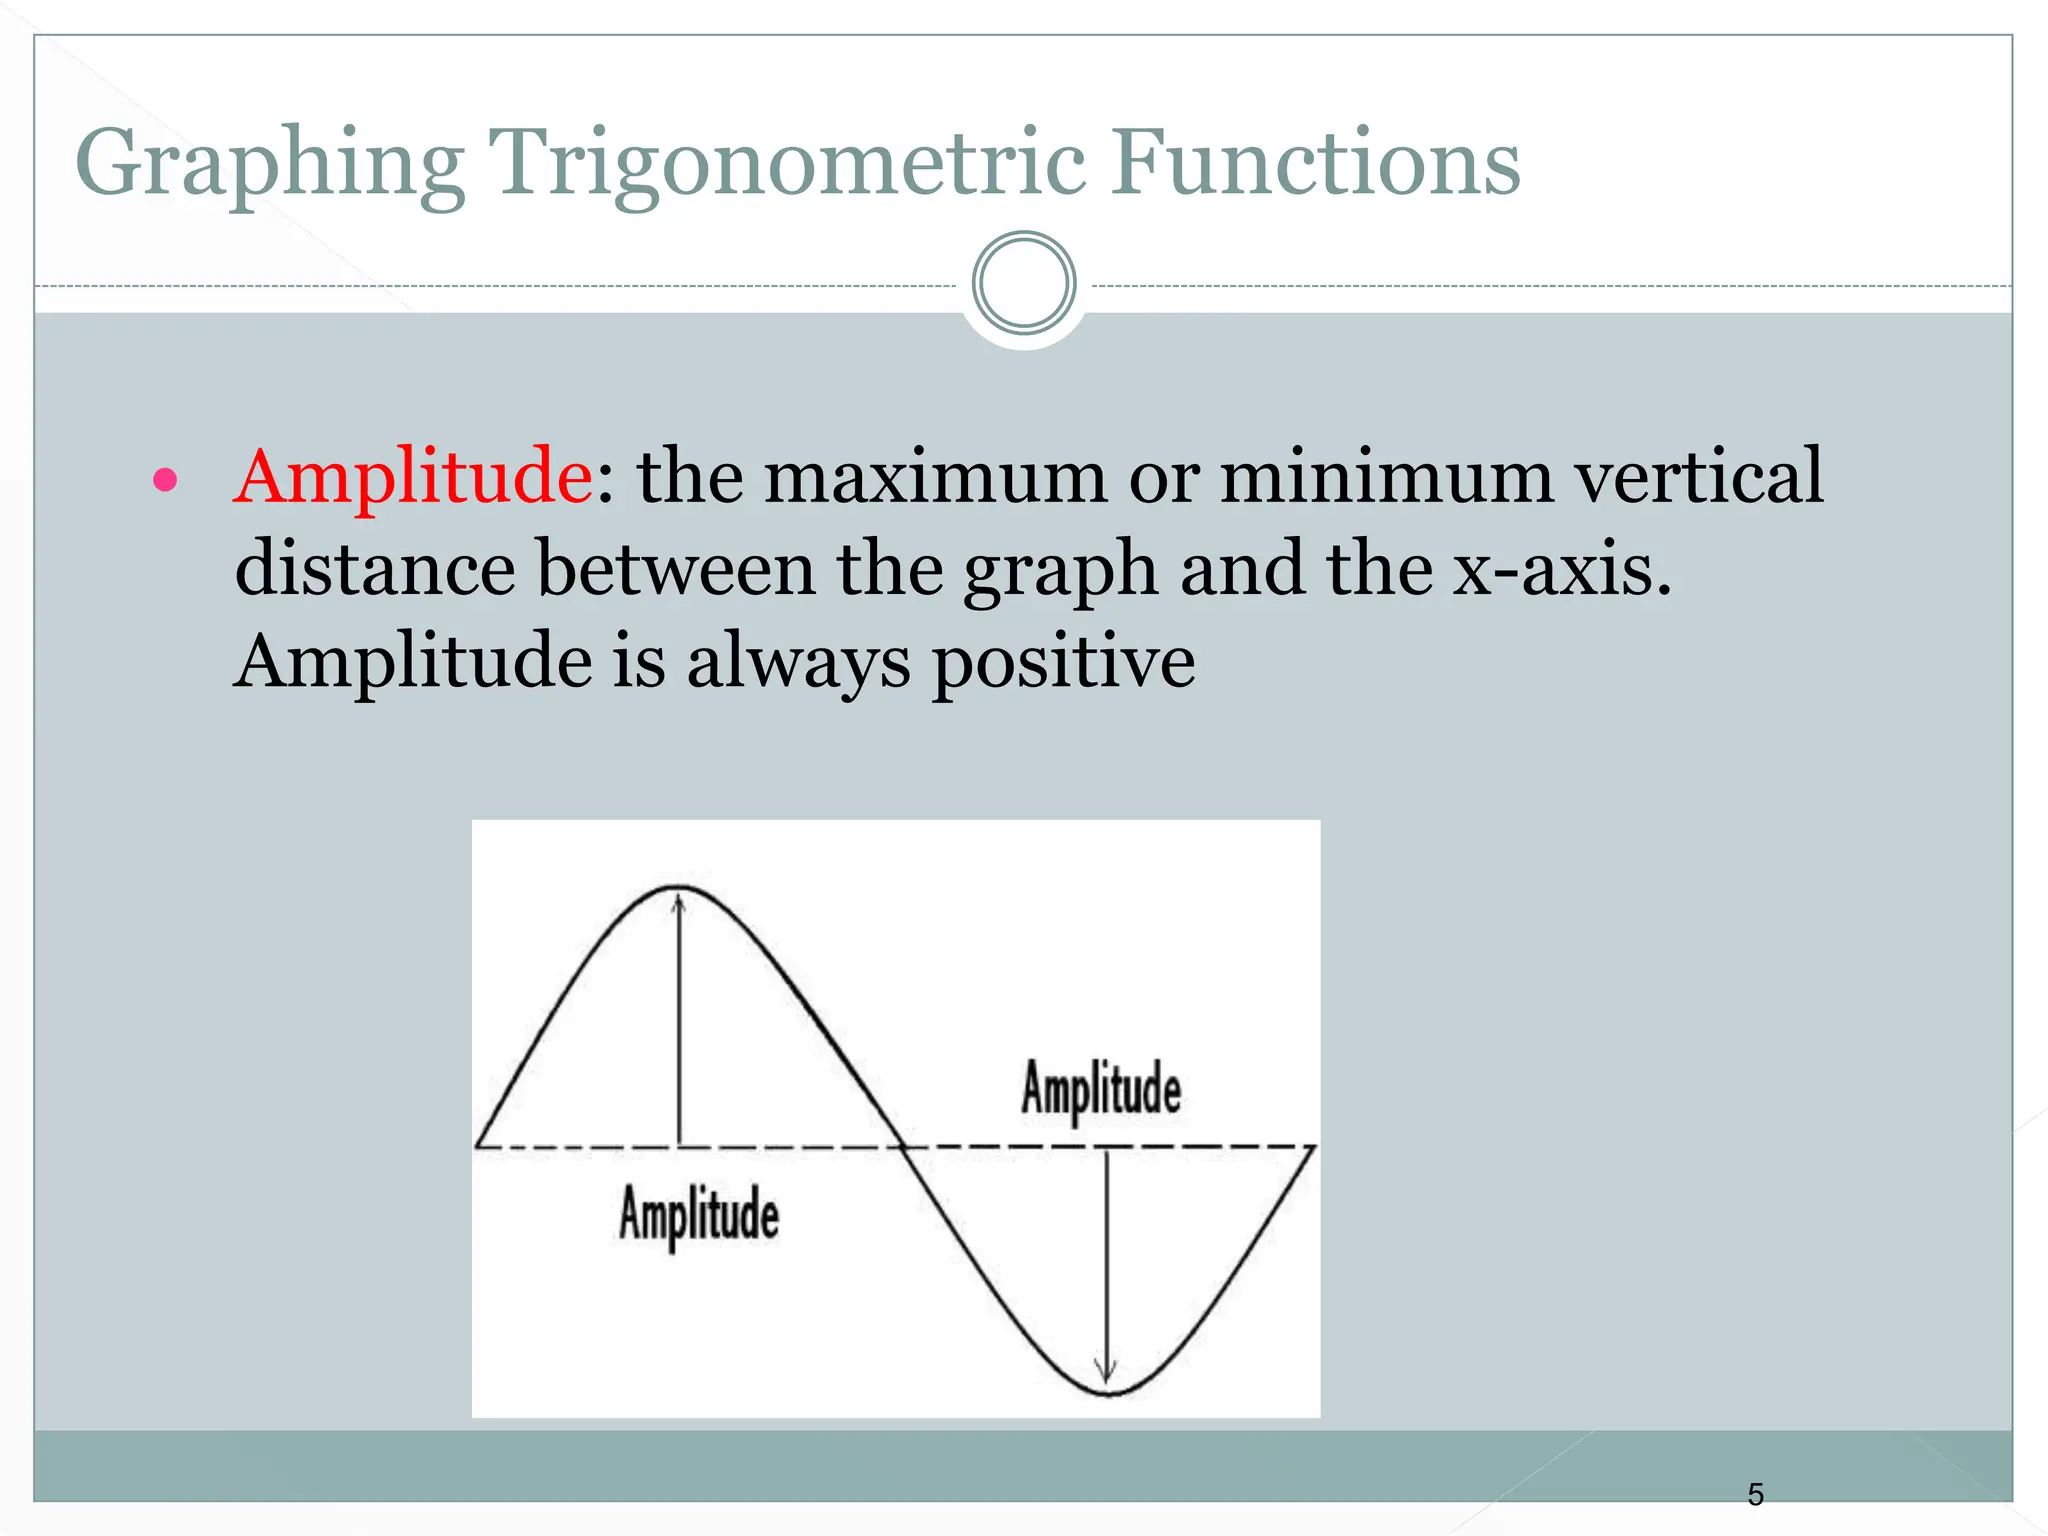
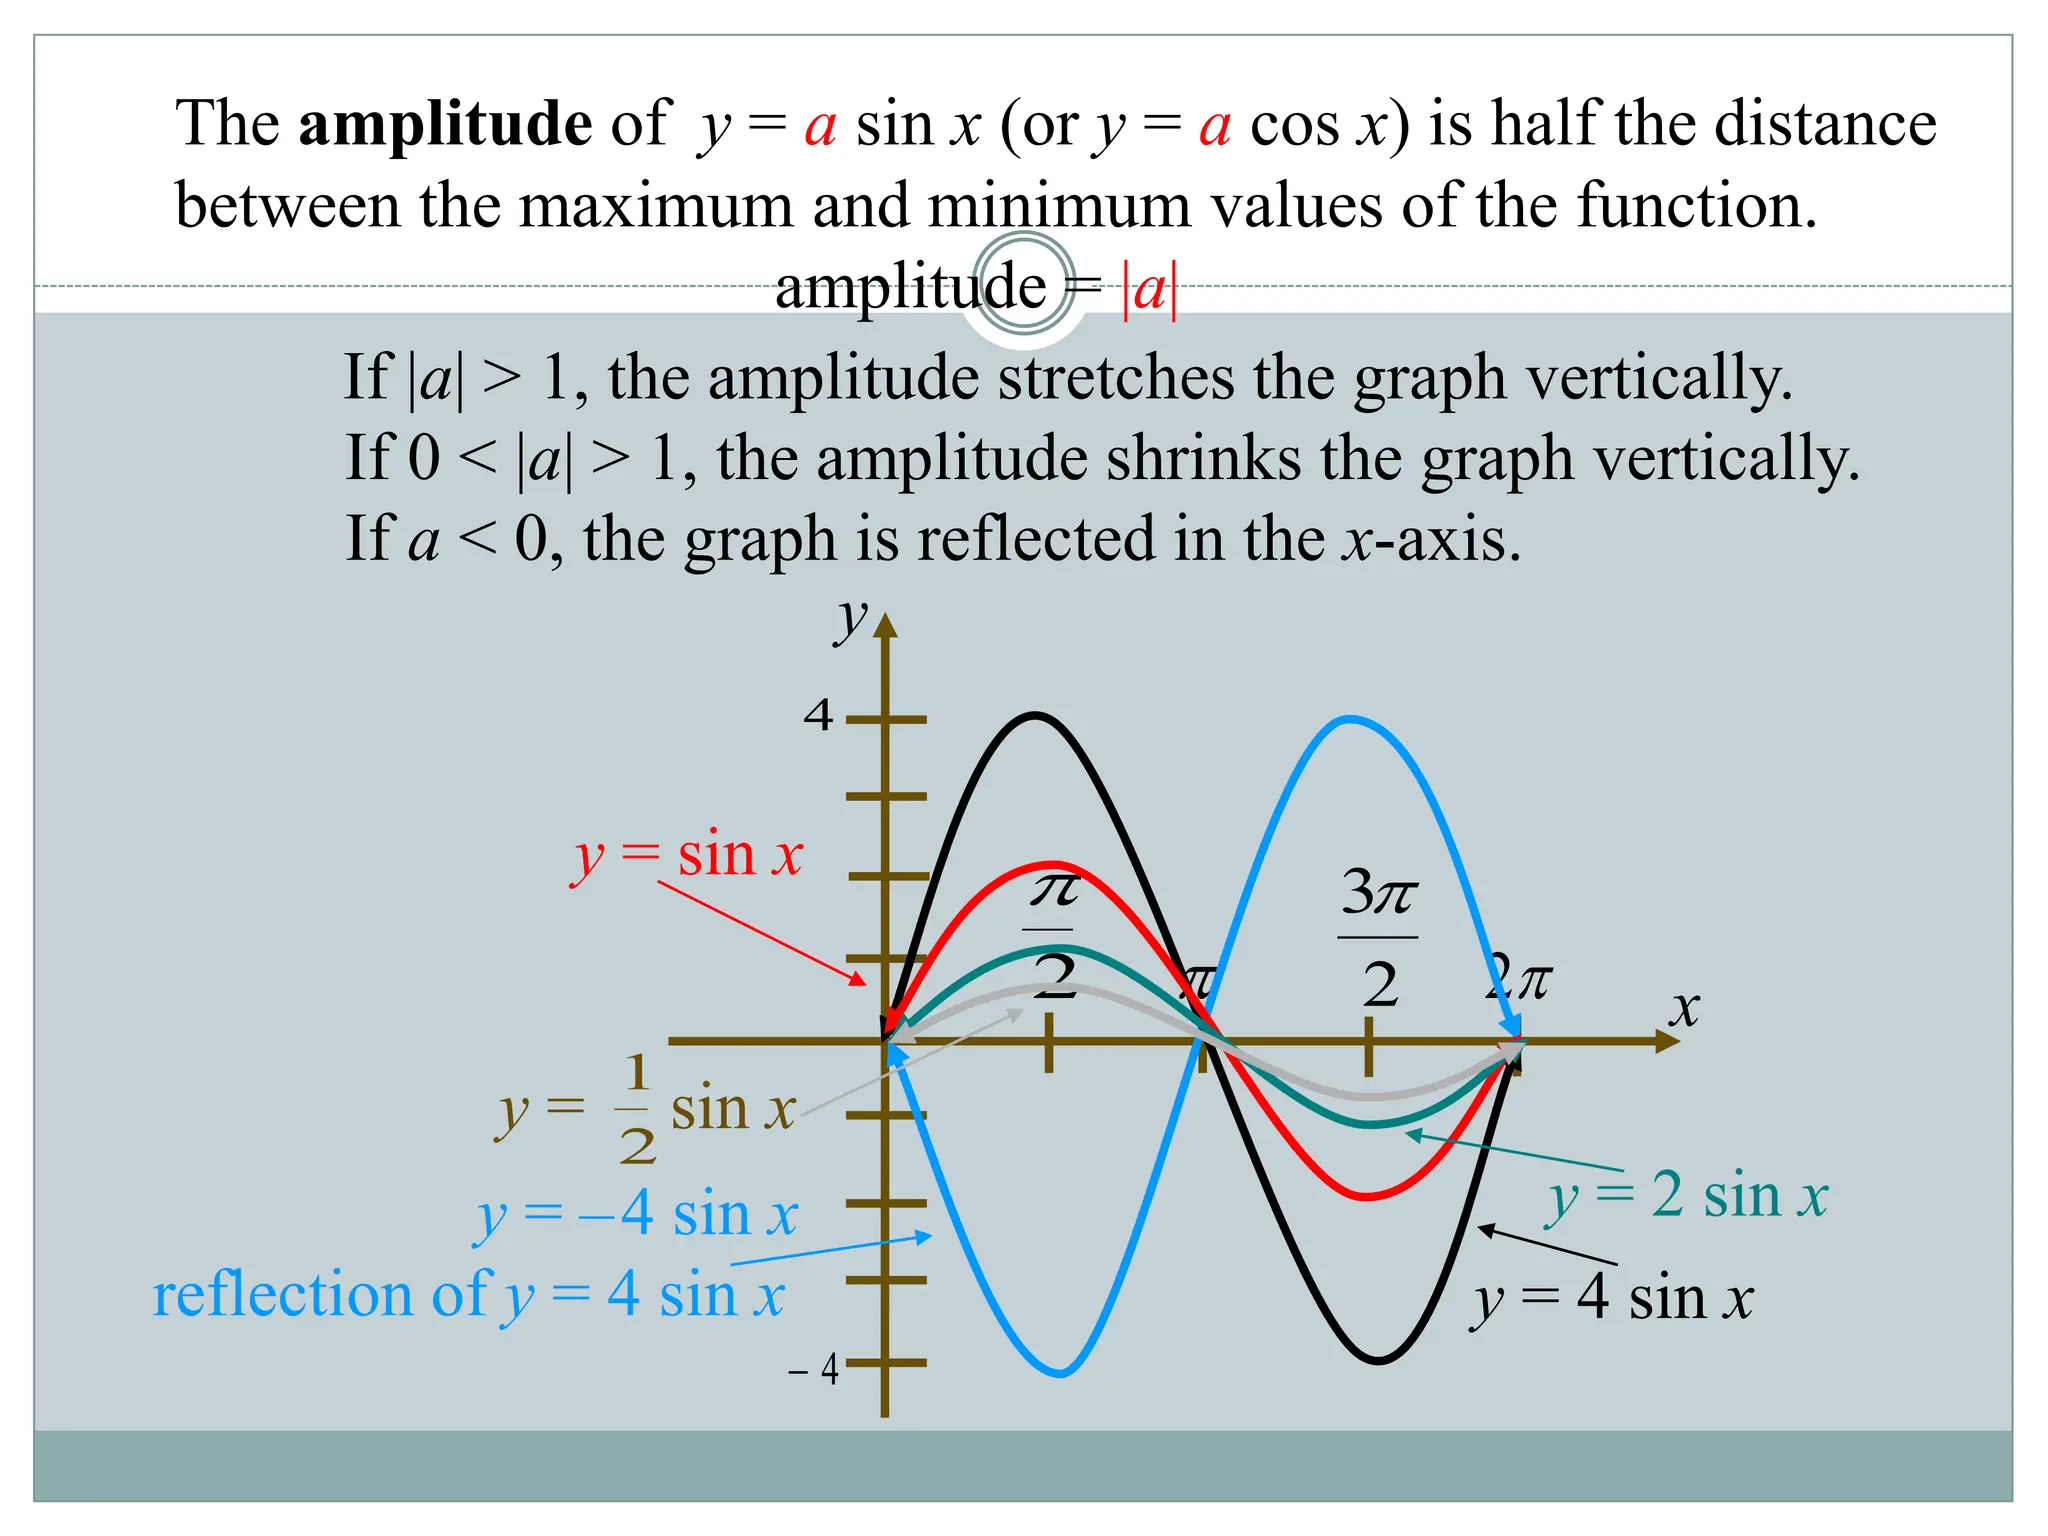
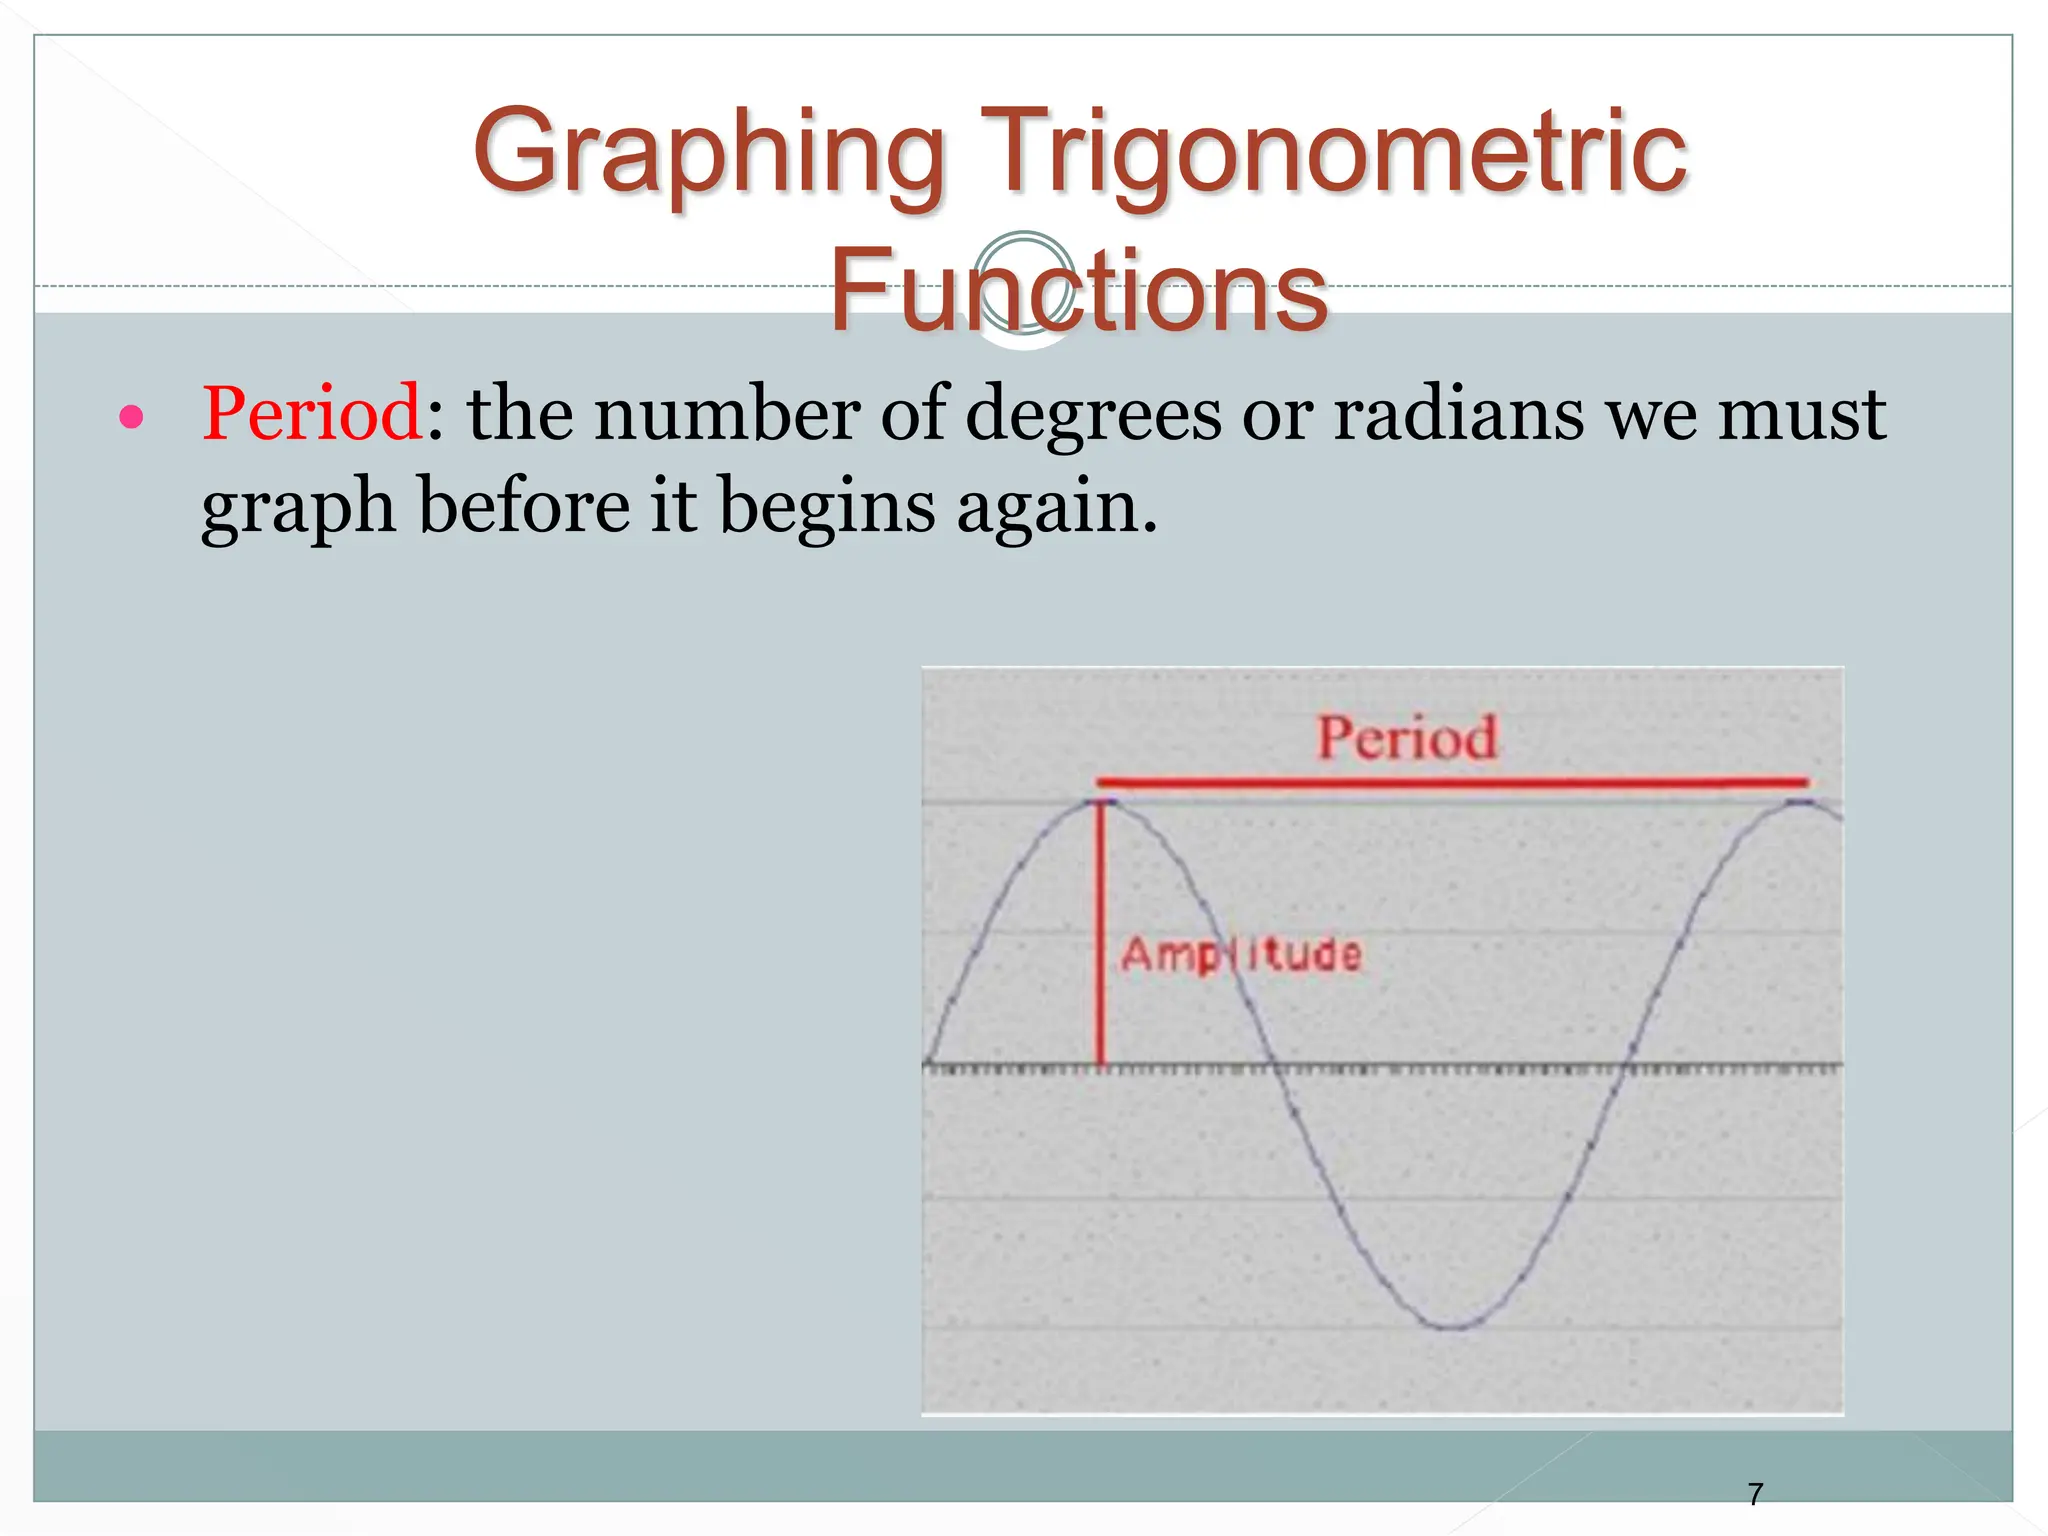
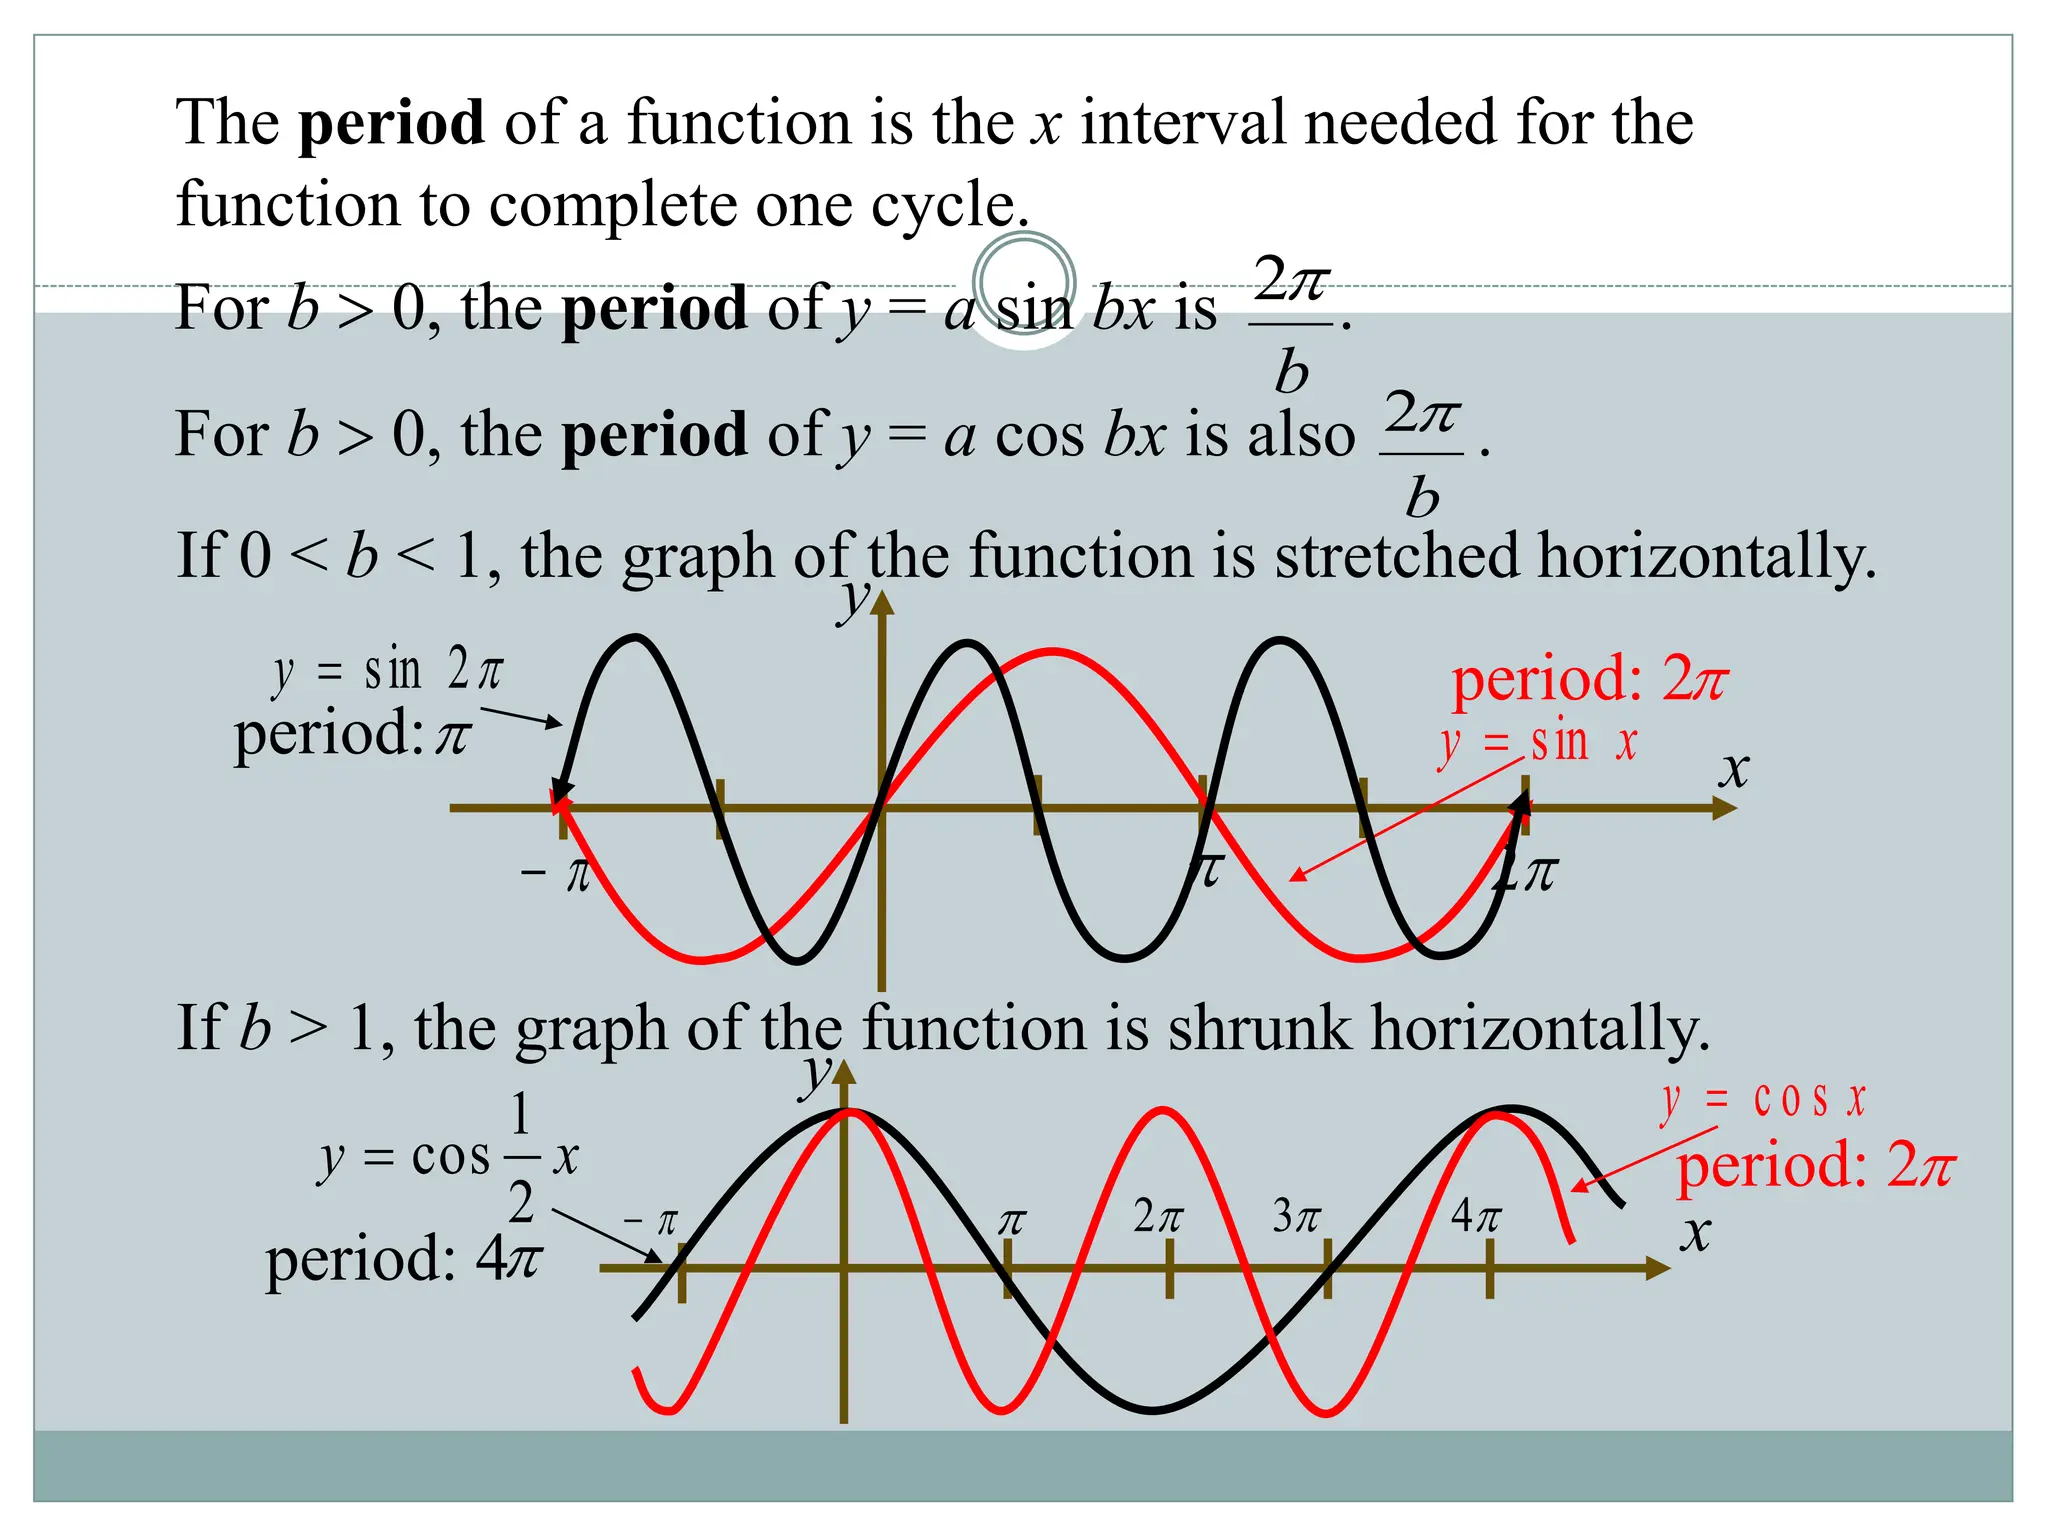
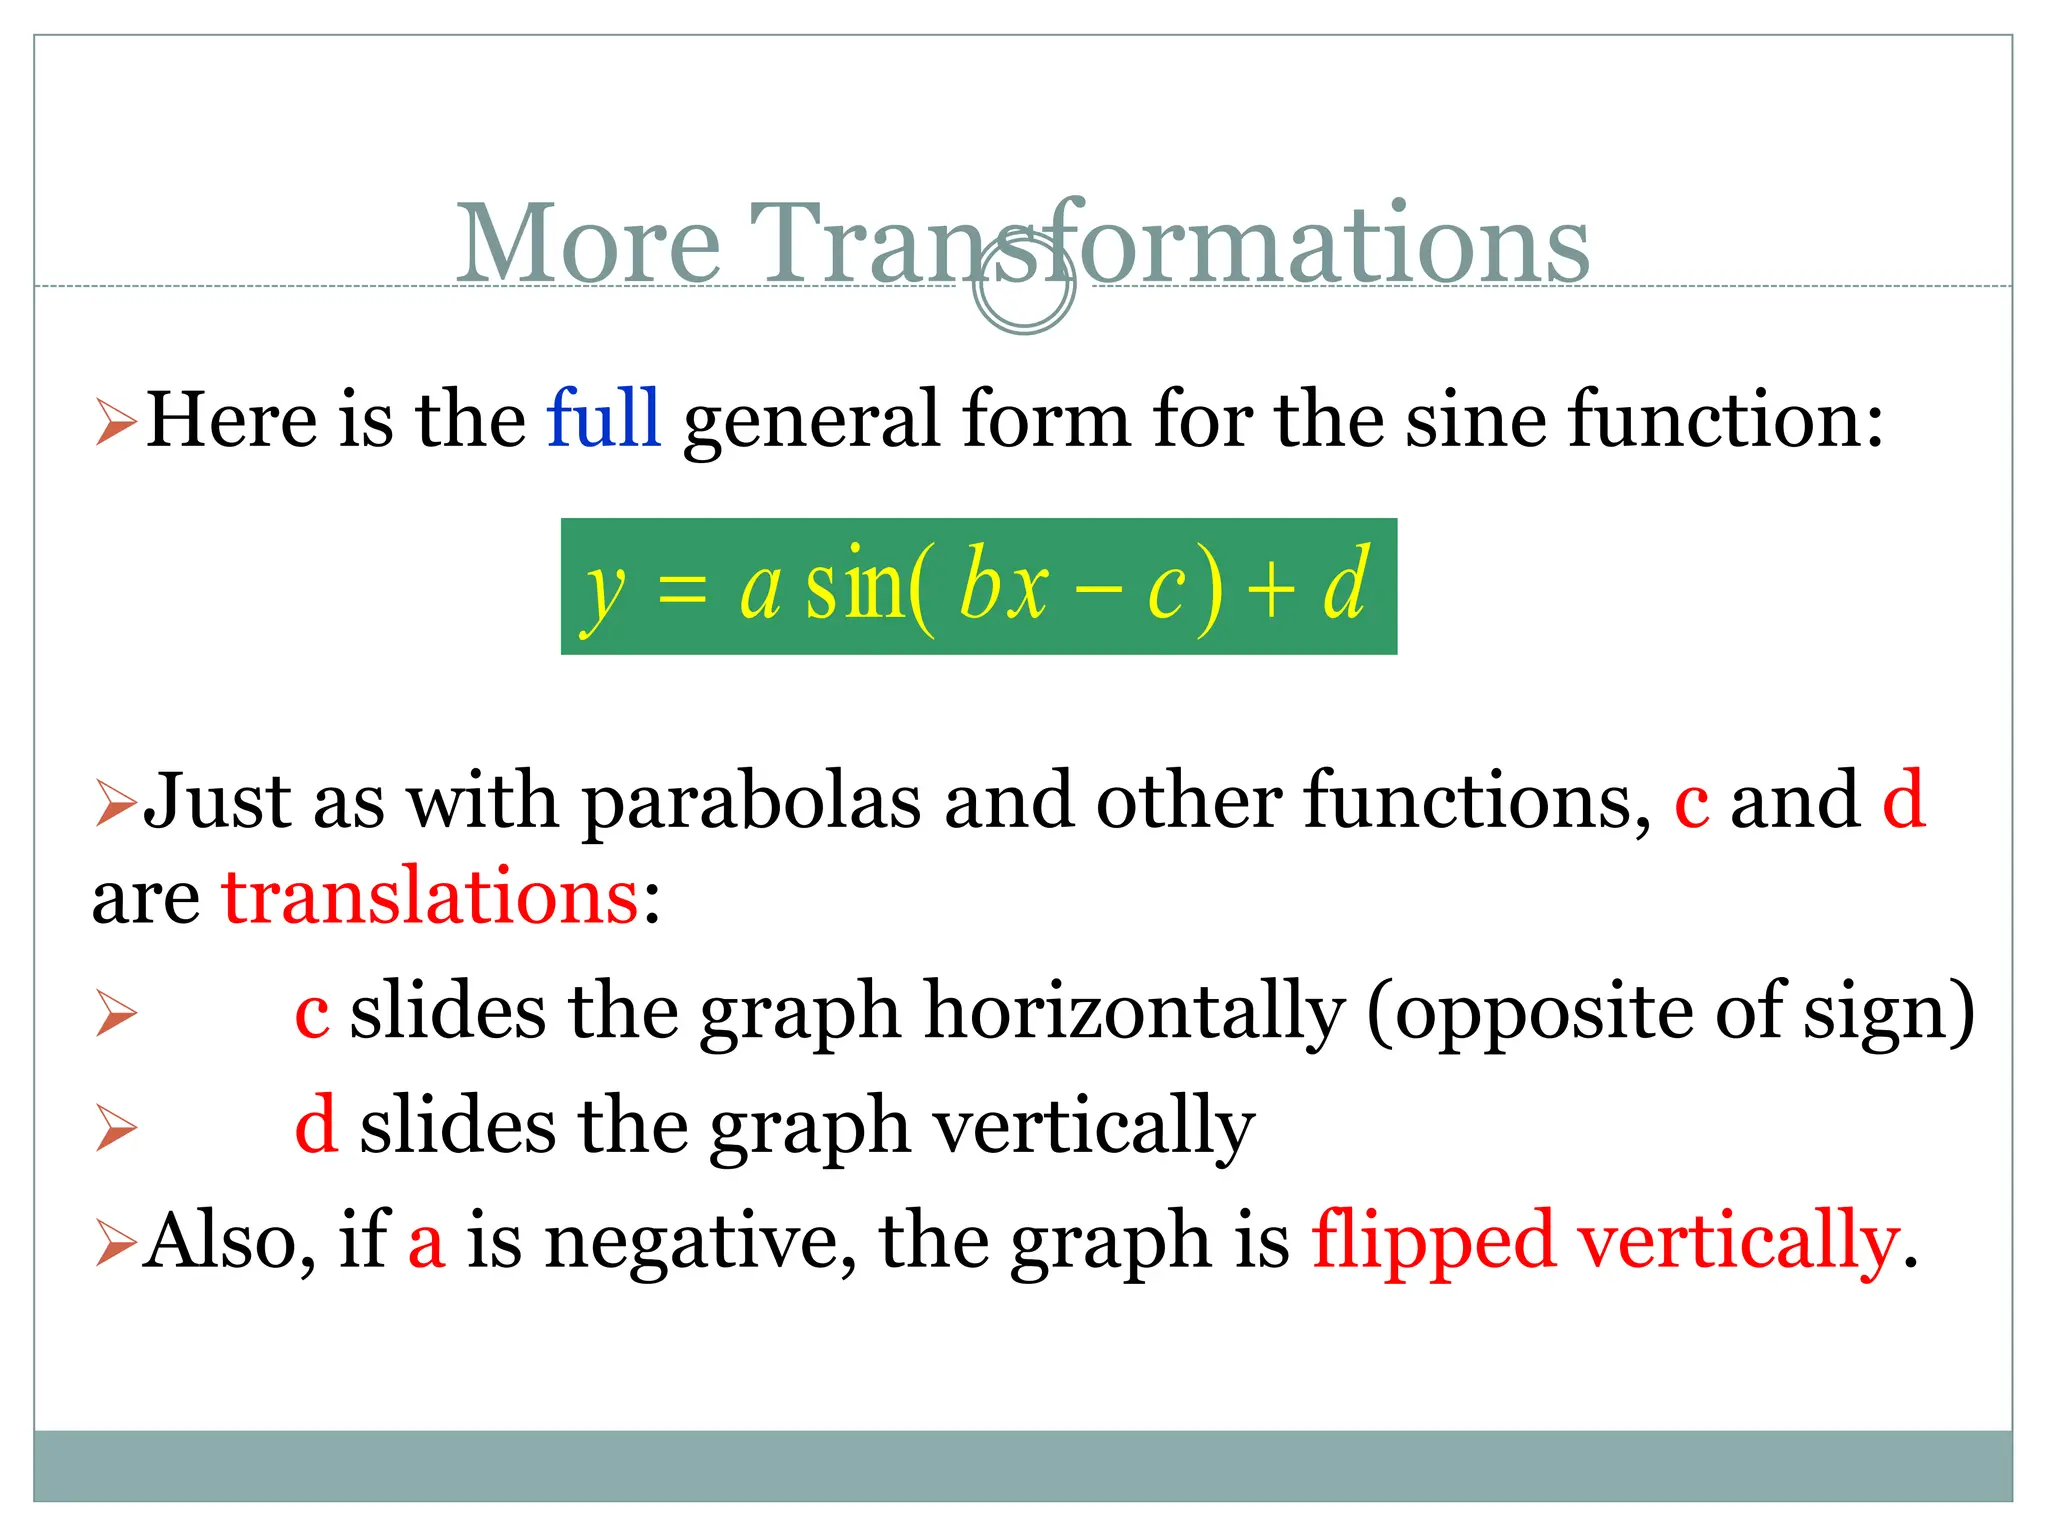
2. Key aspects covered include the definitions of radians, amplitude and period as they relate to graphing trig functions. Properties like symmetry, maximum and minimum values are also addressed.
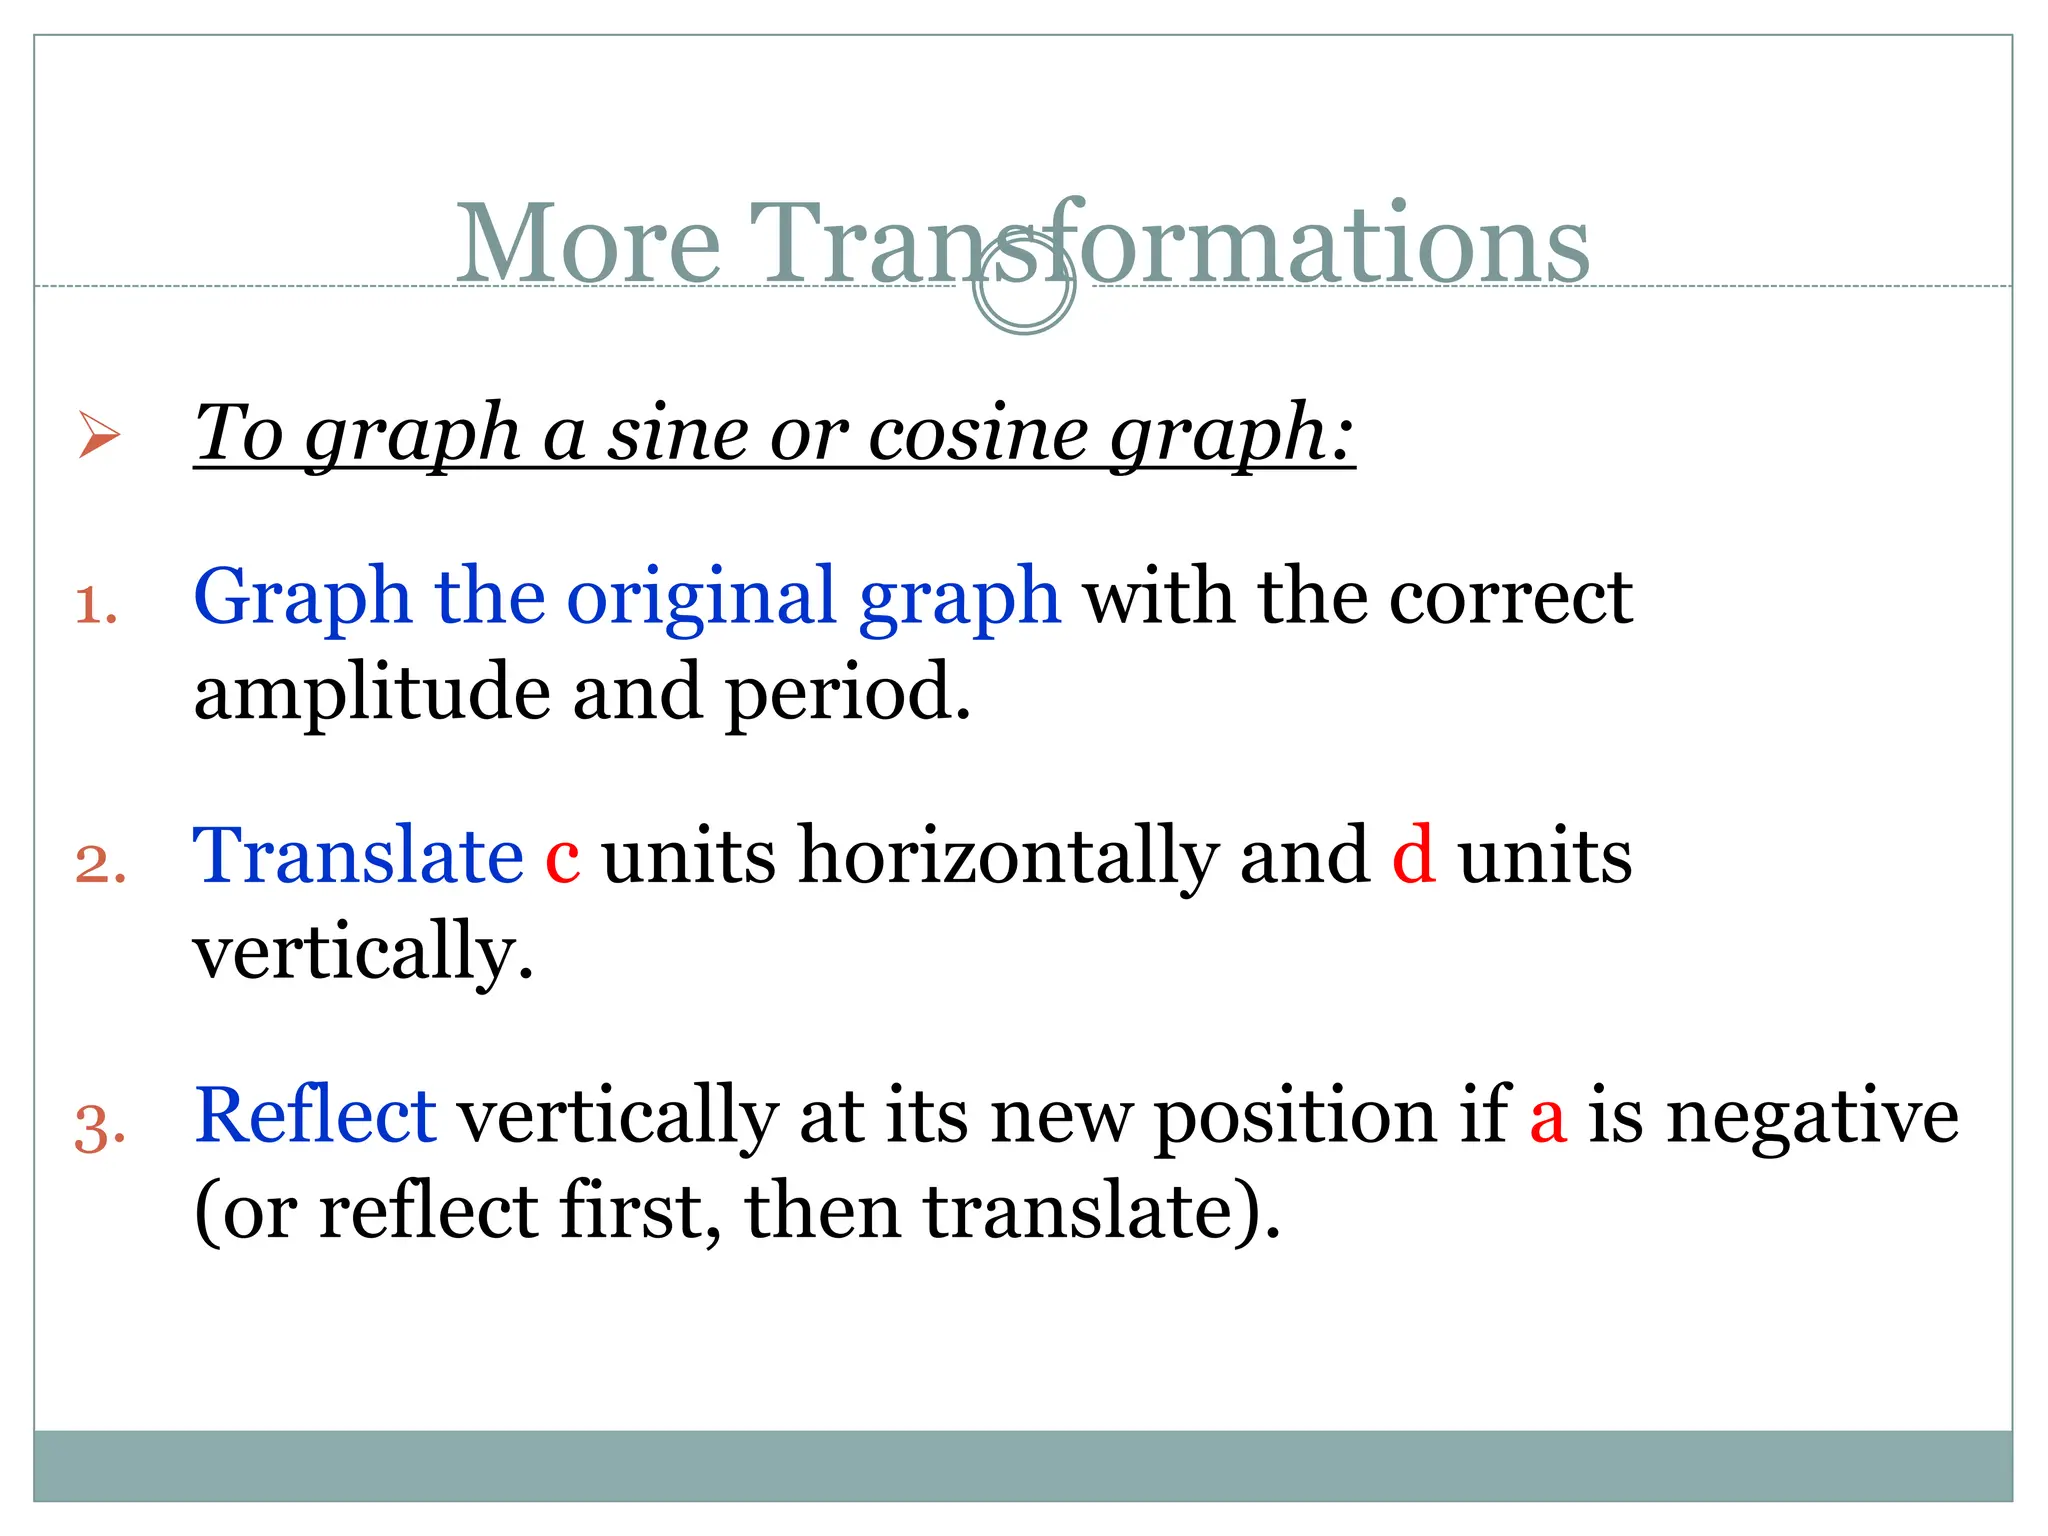
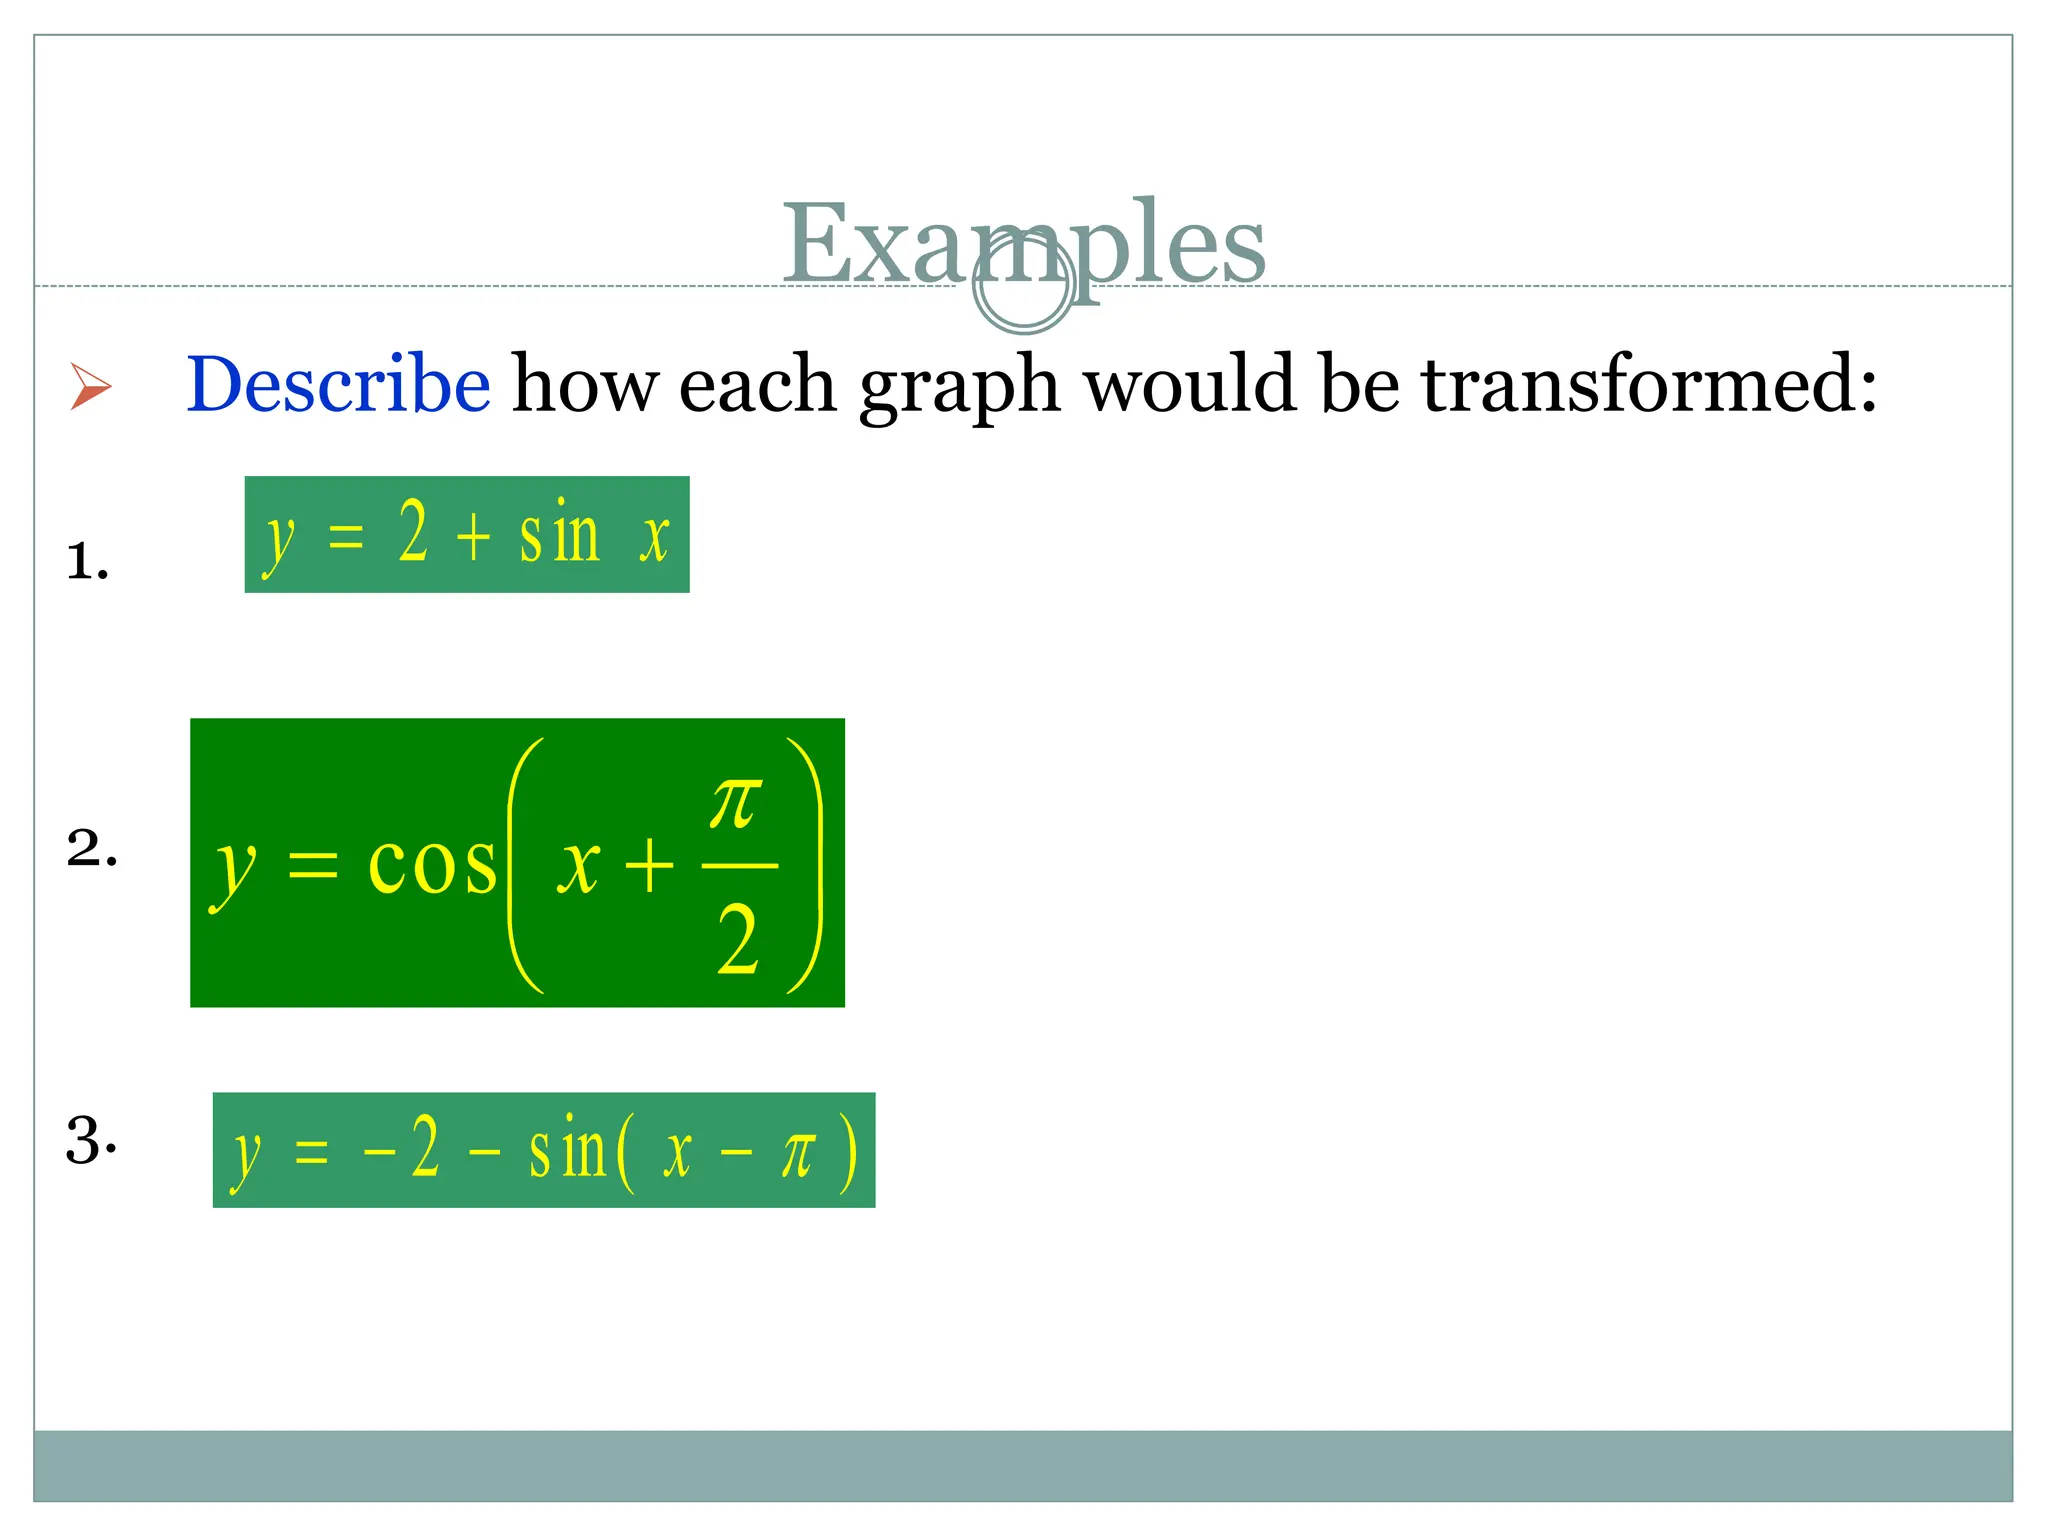
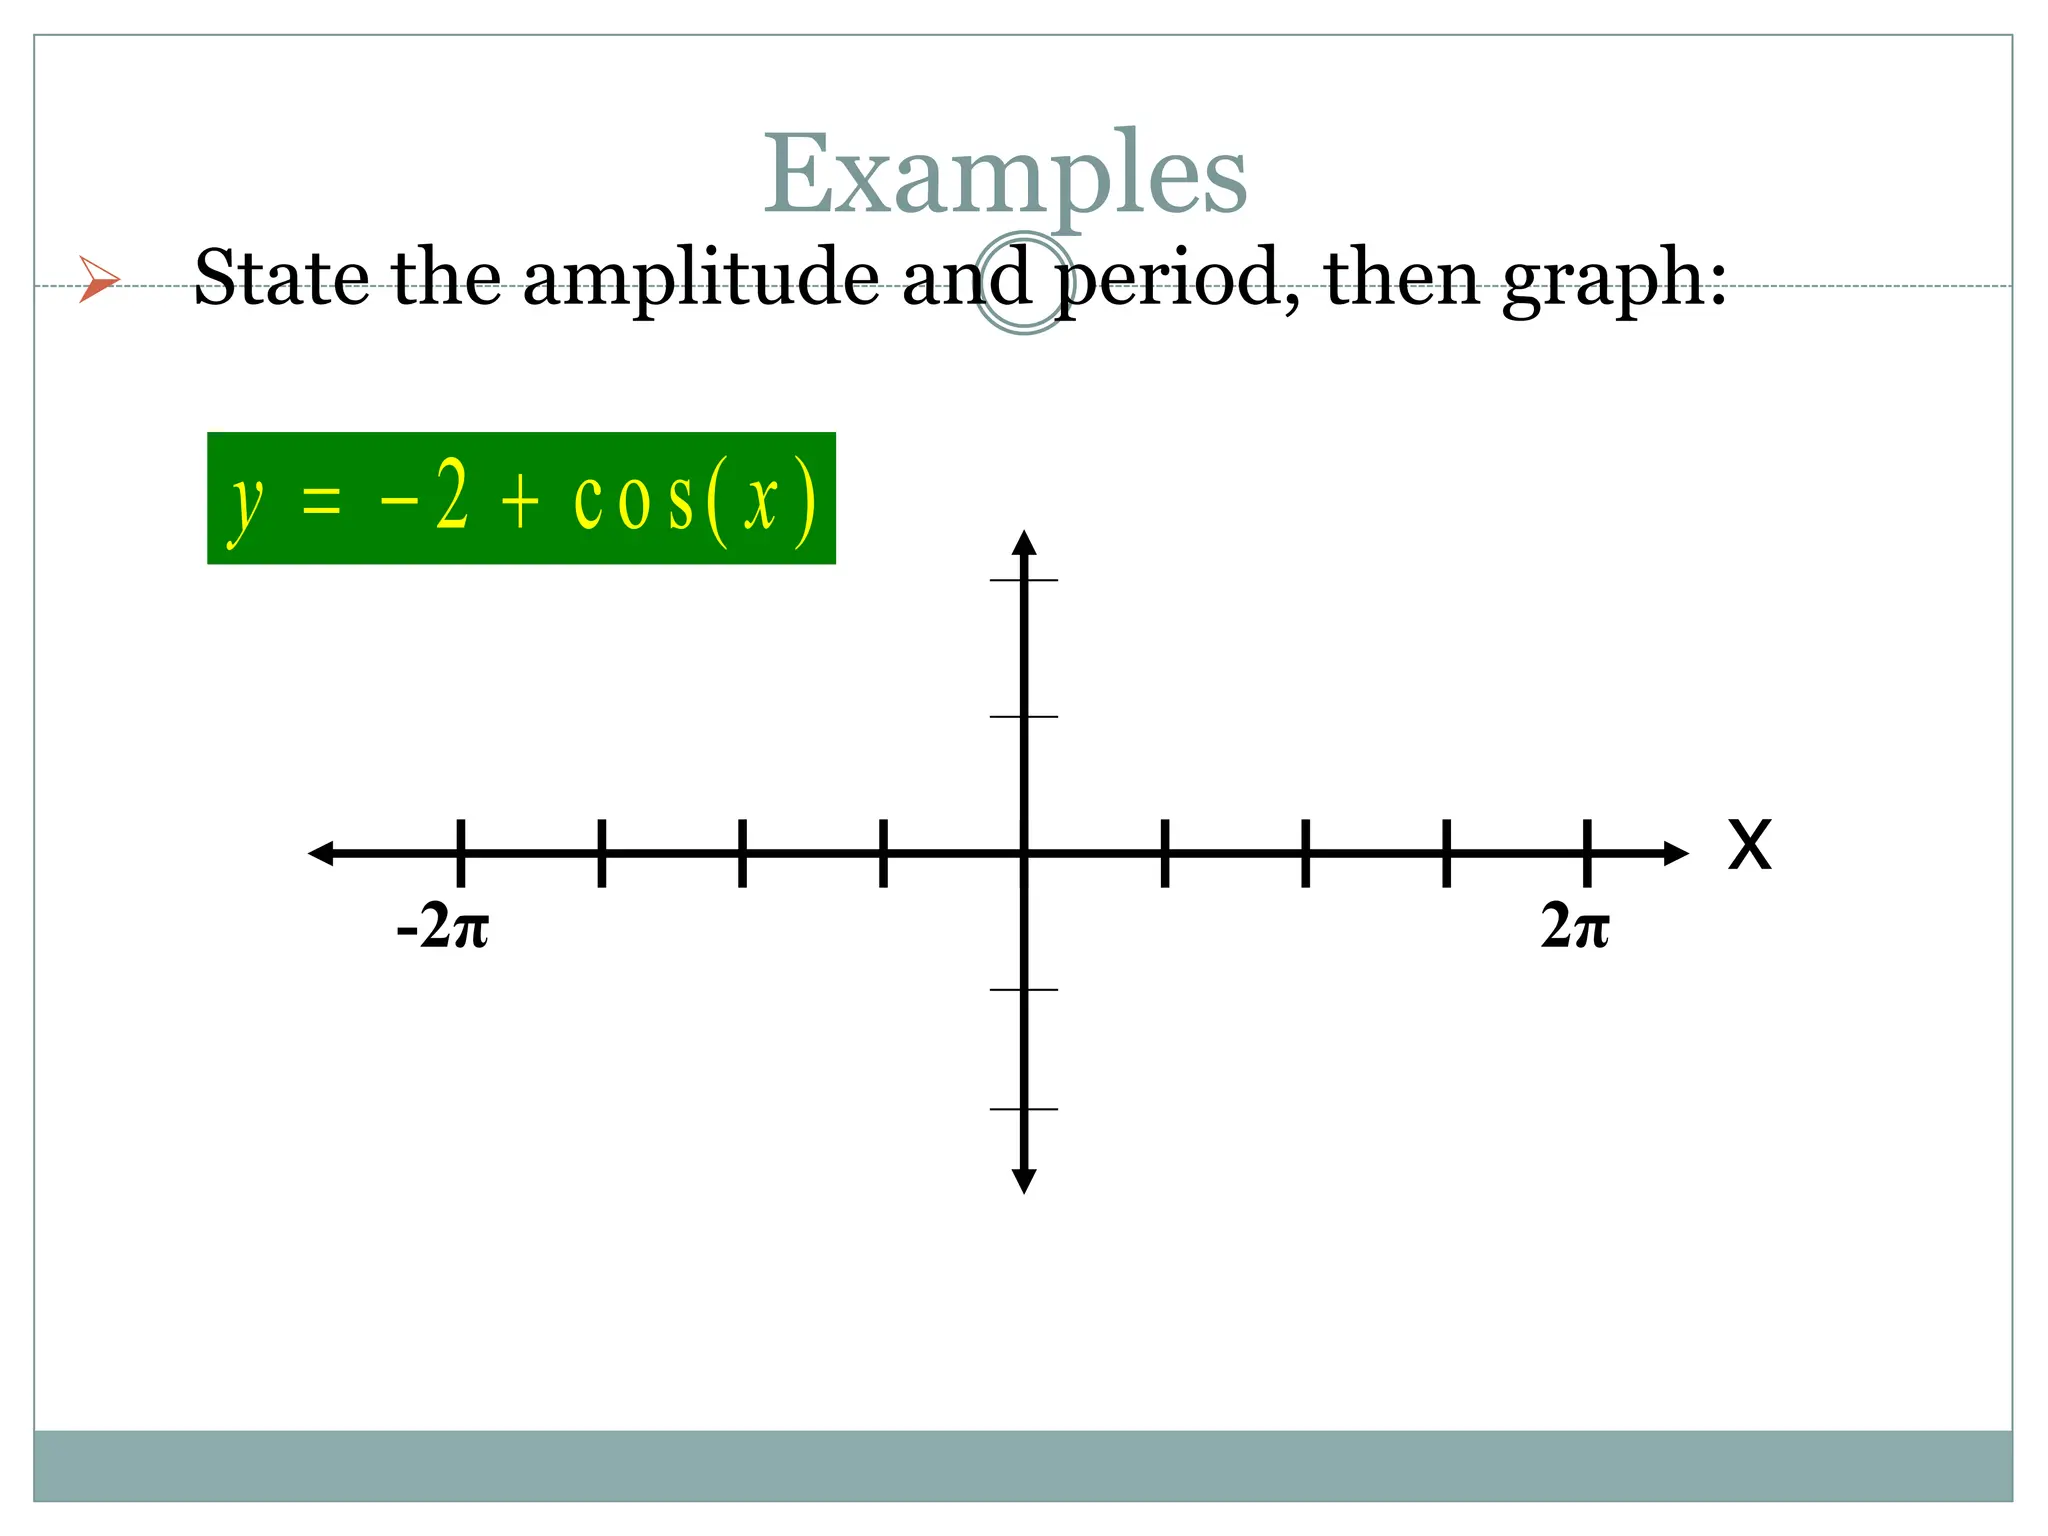
3. Examples are provided of graphing trig functions based on their period and any vertical asymptotes. Conversions between trig function notations are also demonstrated.
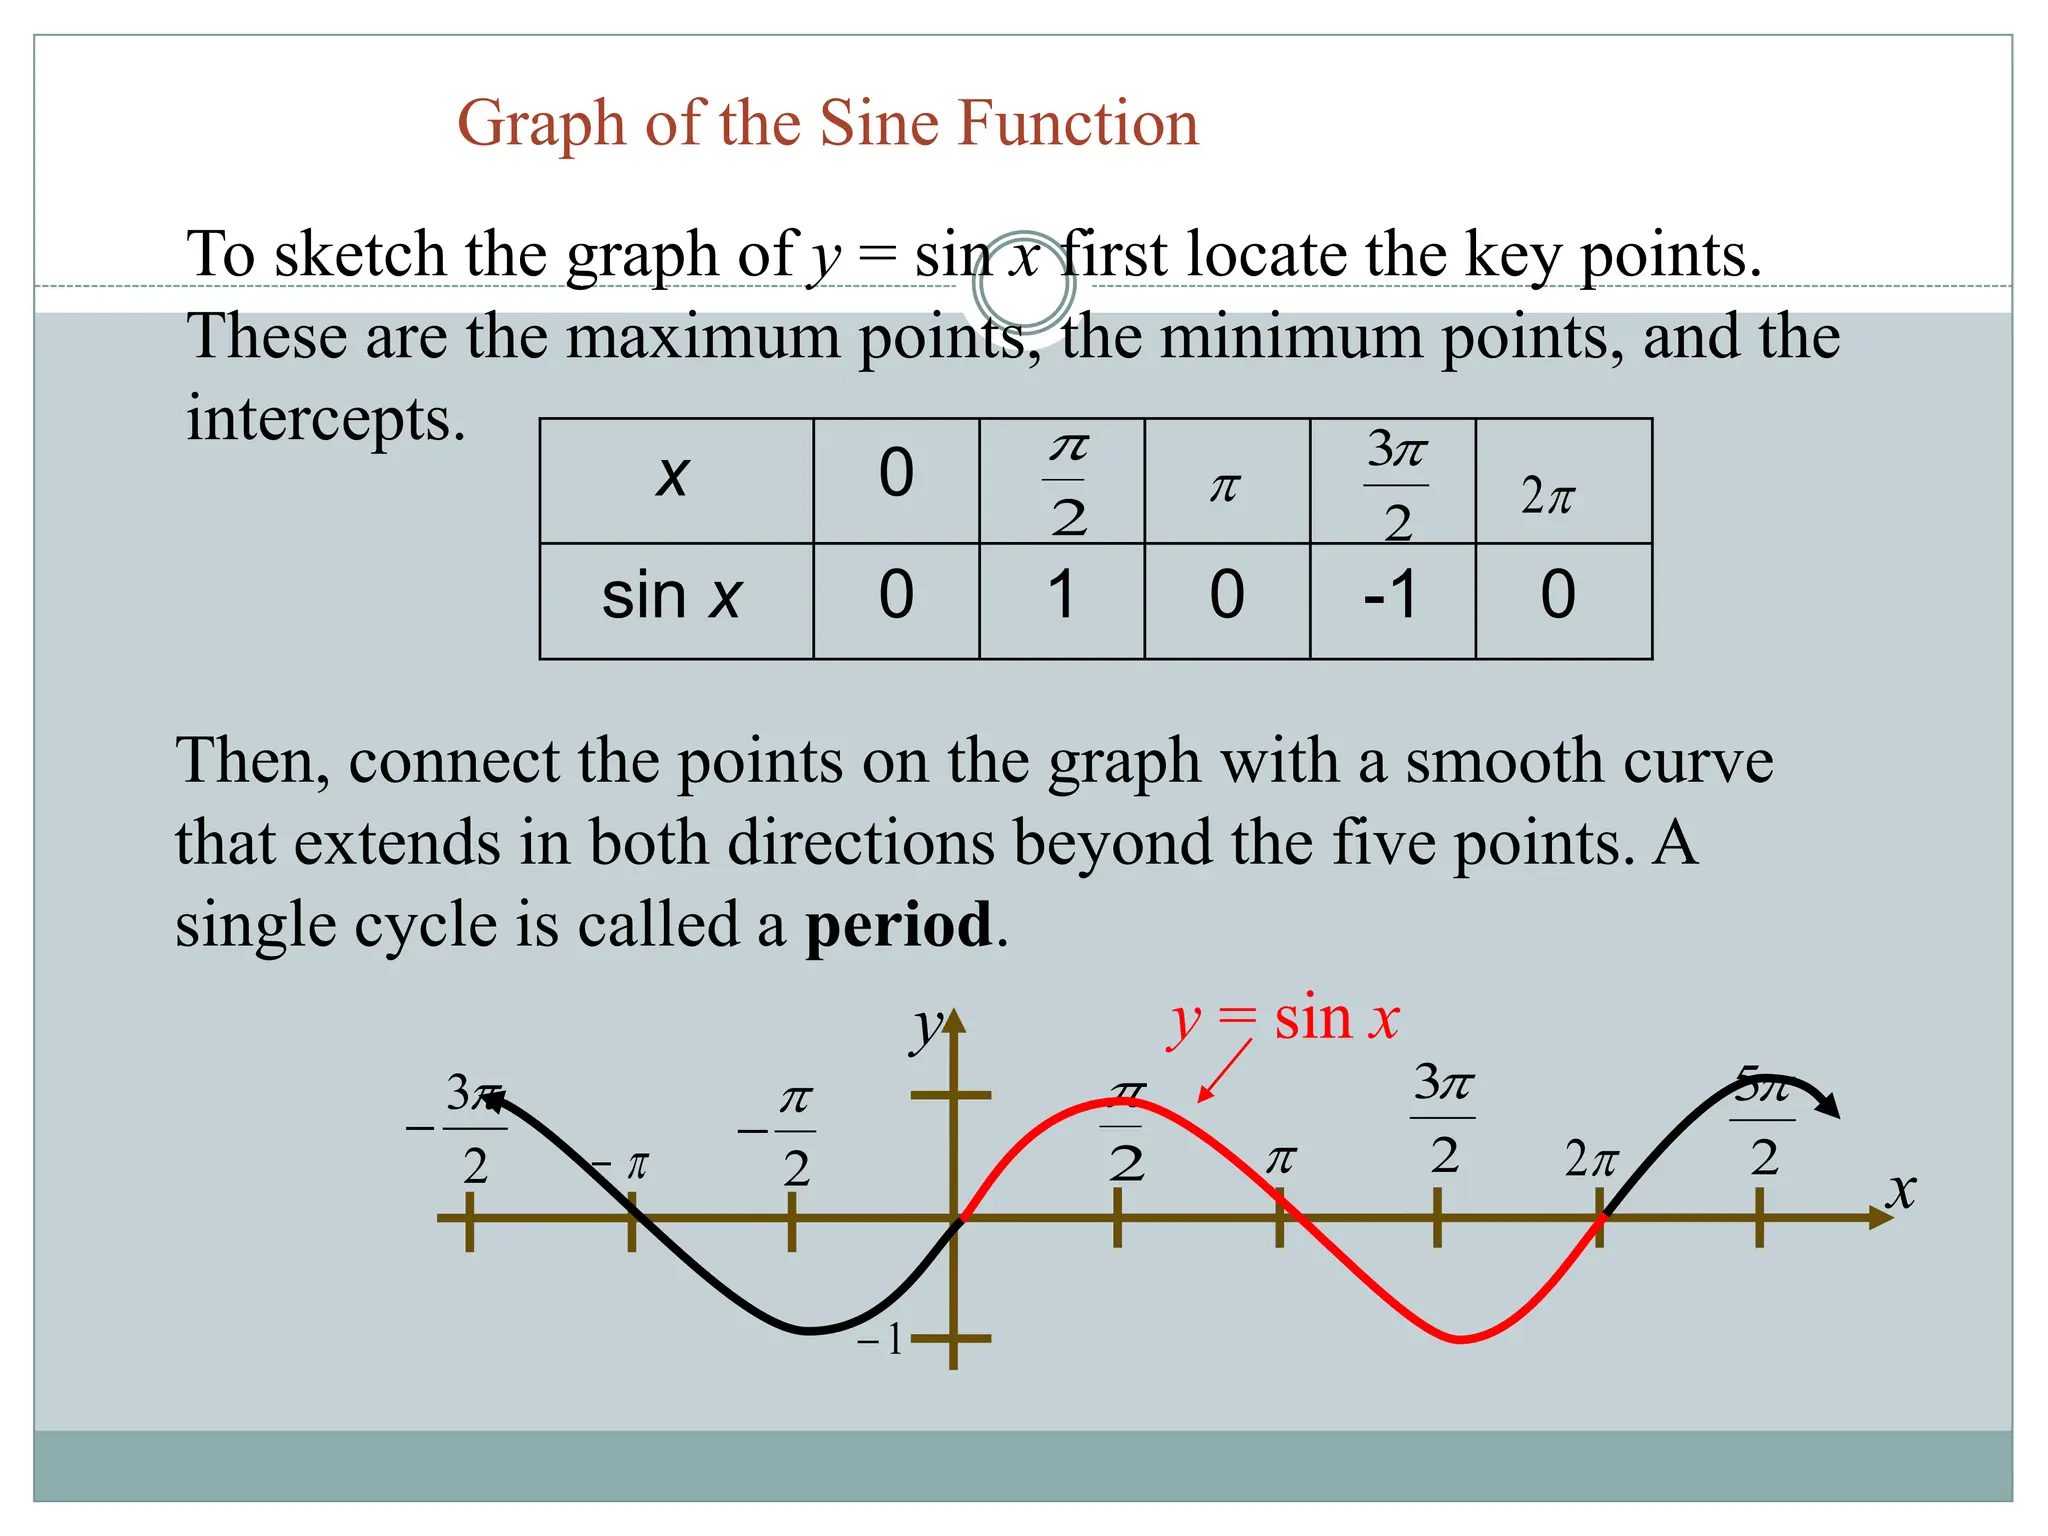
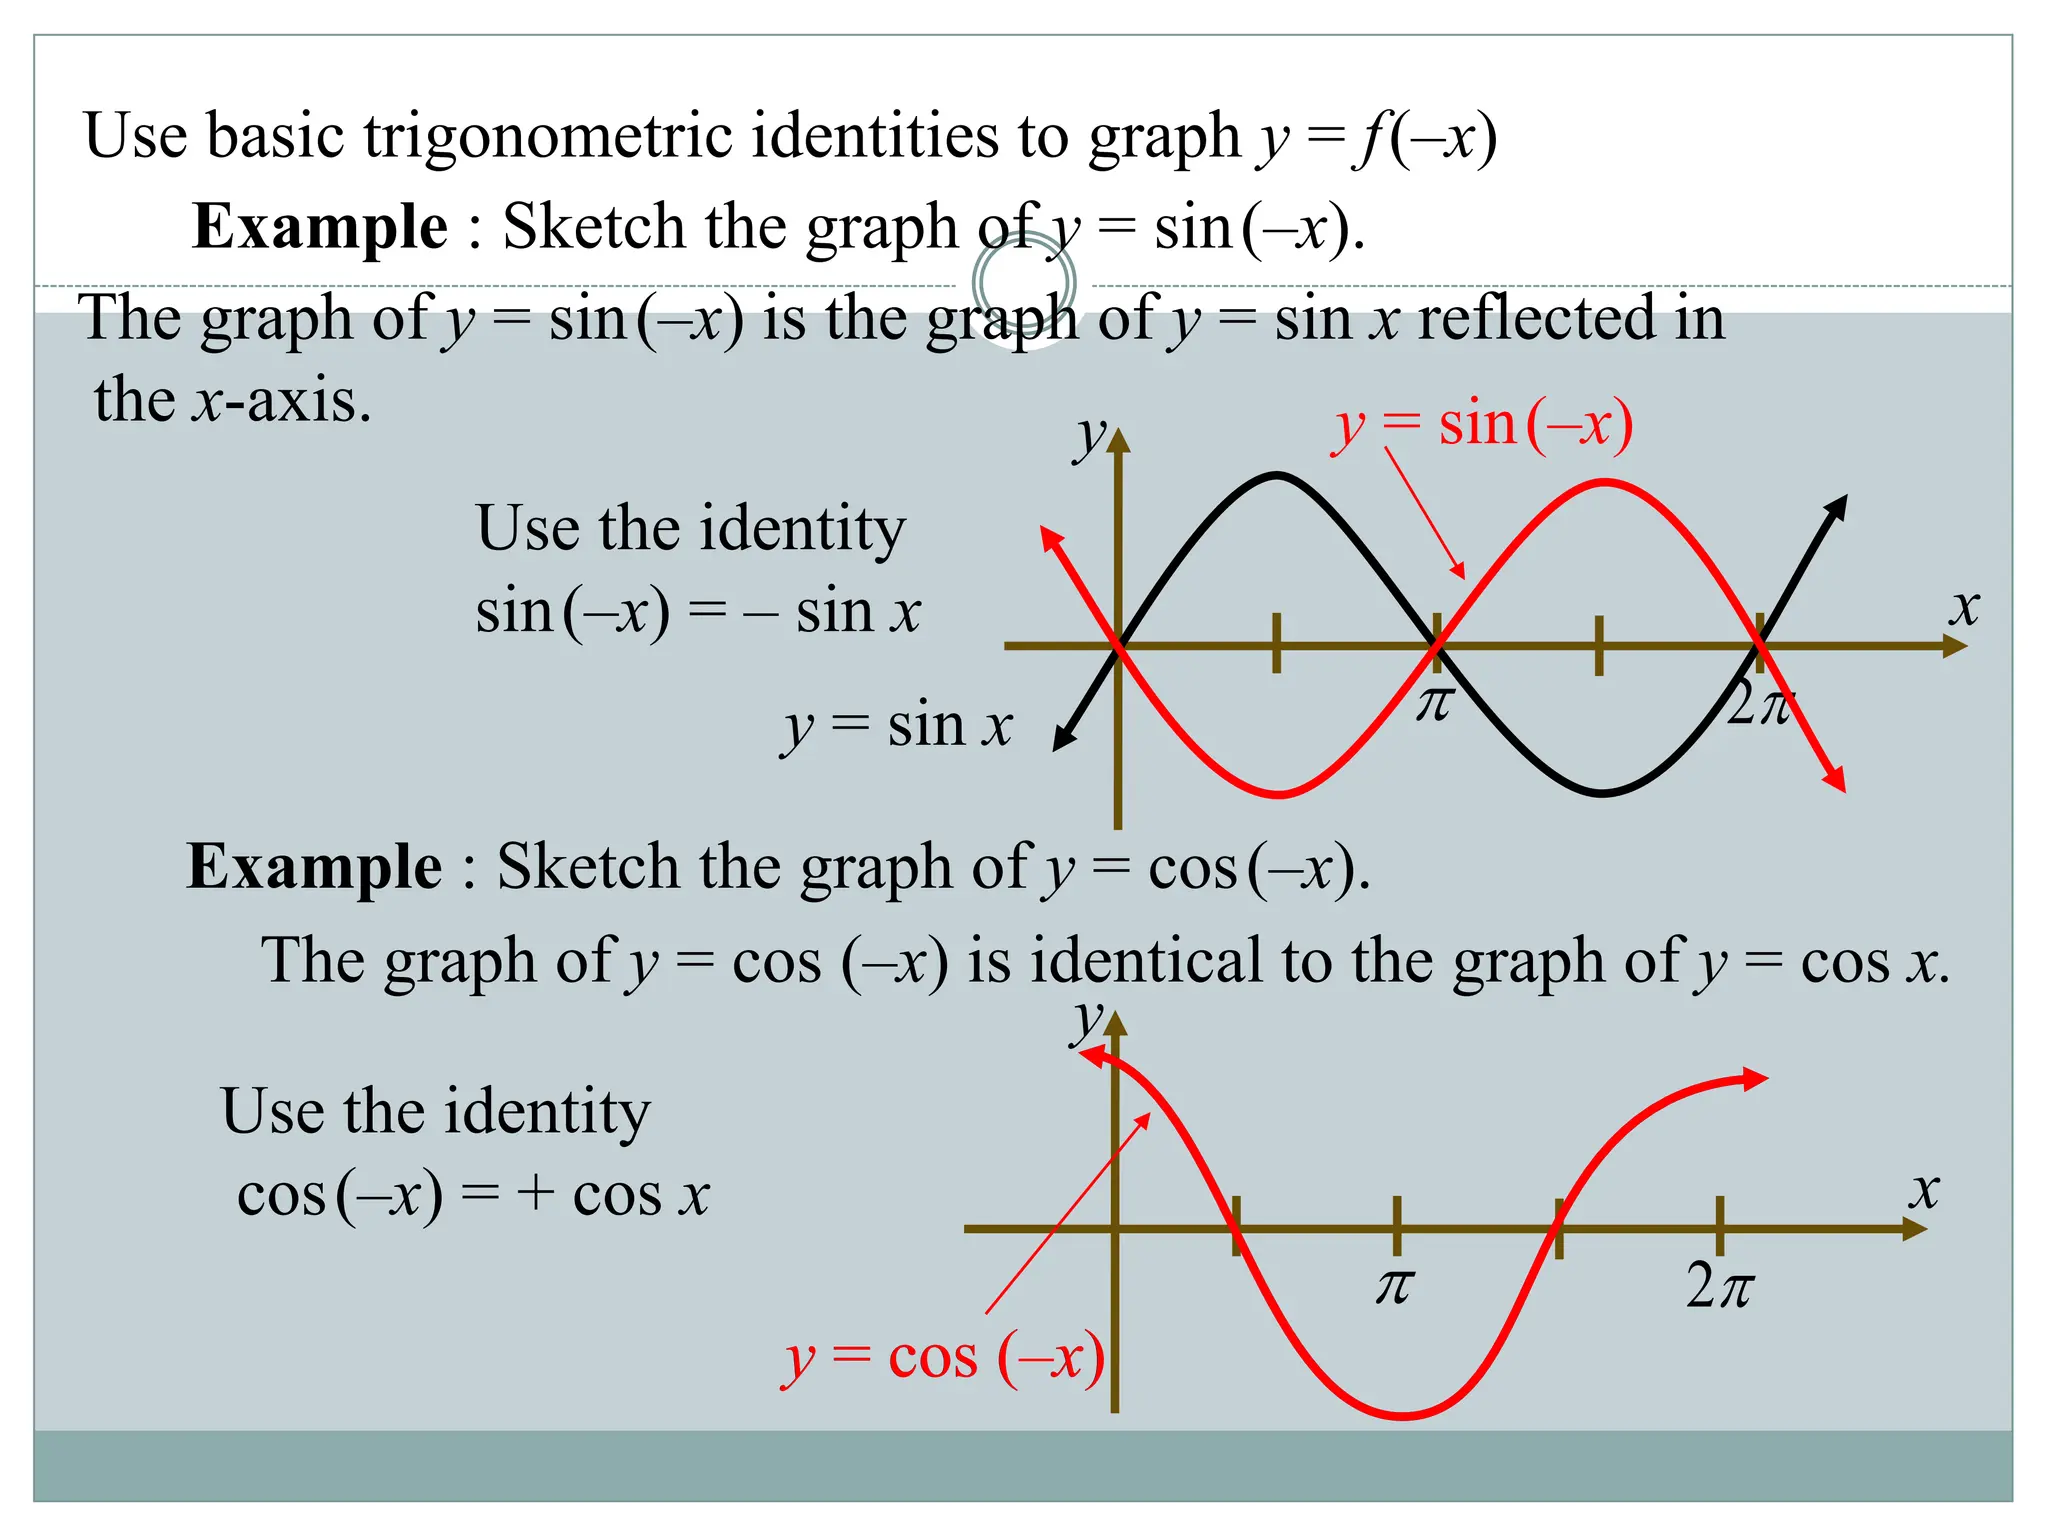
![Sine is a periodic function: p = 2π
,
Domain
One period
2π
0 3π
2π
π
−2π −π
−3π
sin θ
θ
sin θ: Domain (angle measures): all real numbers, (−∞, ∞)
Range (ratio of sides): −1 to 1, inclusive [−1, 1]
sin θ is an odd function; it is symmetric wrt the origin.
sin(−θ) = −sin(θ)](https://image.slidesharecdn.com/graphingtrigfunctions-240311121659-2ae4413a/75/Graphing-Trig-Functions-Tangent-and-Cotangent-ppt-9-2048.jpg)
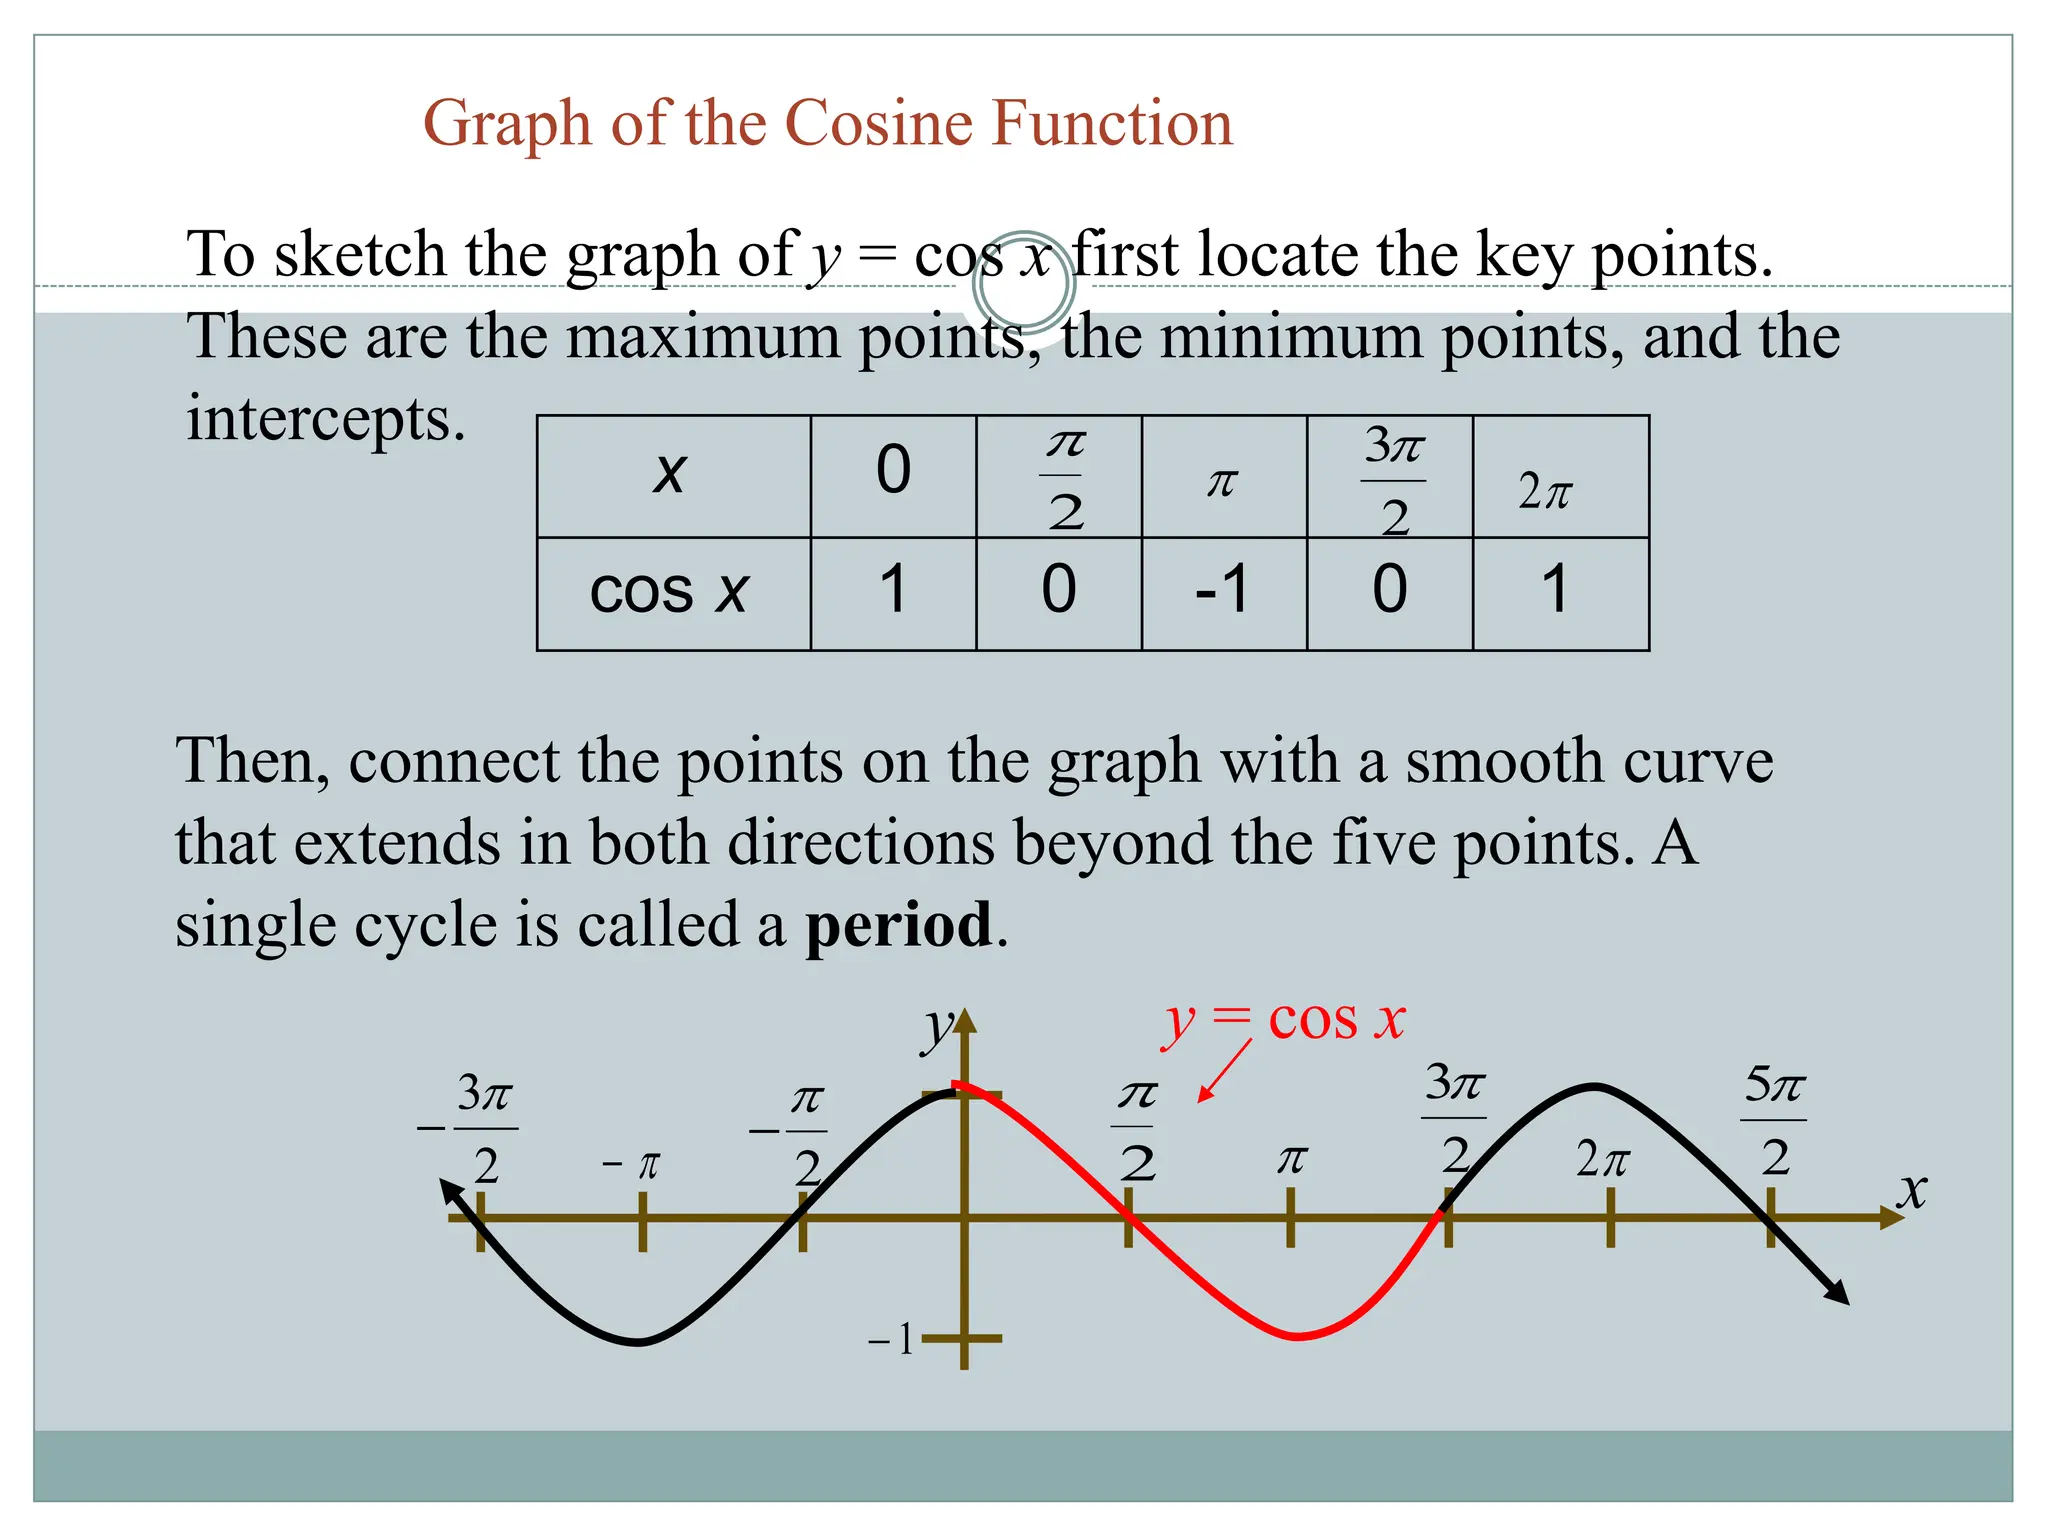
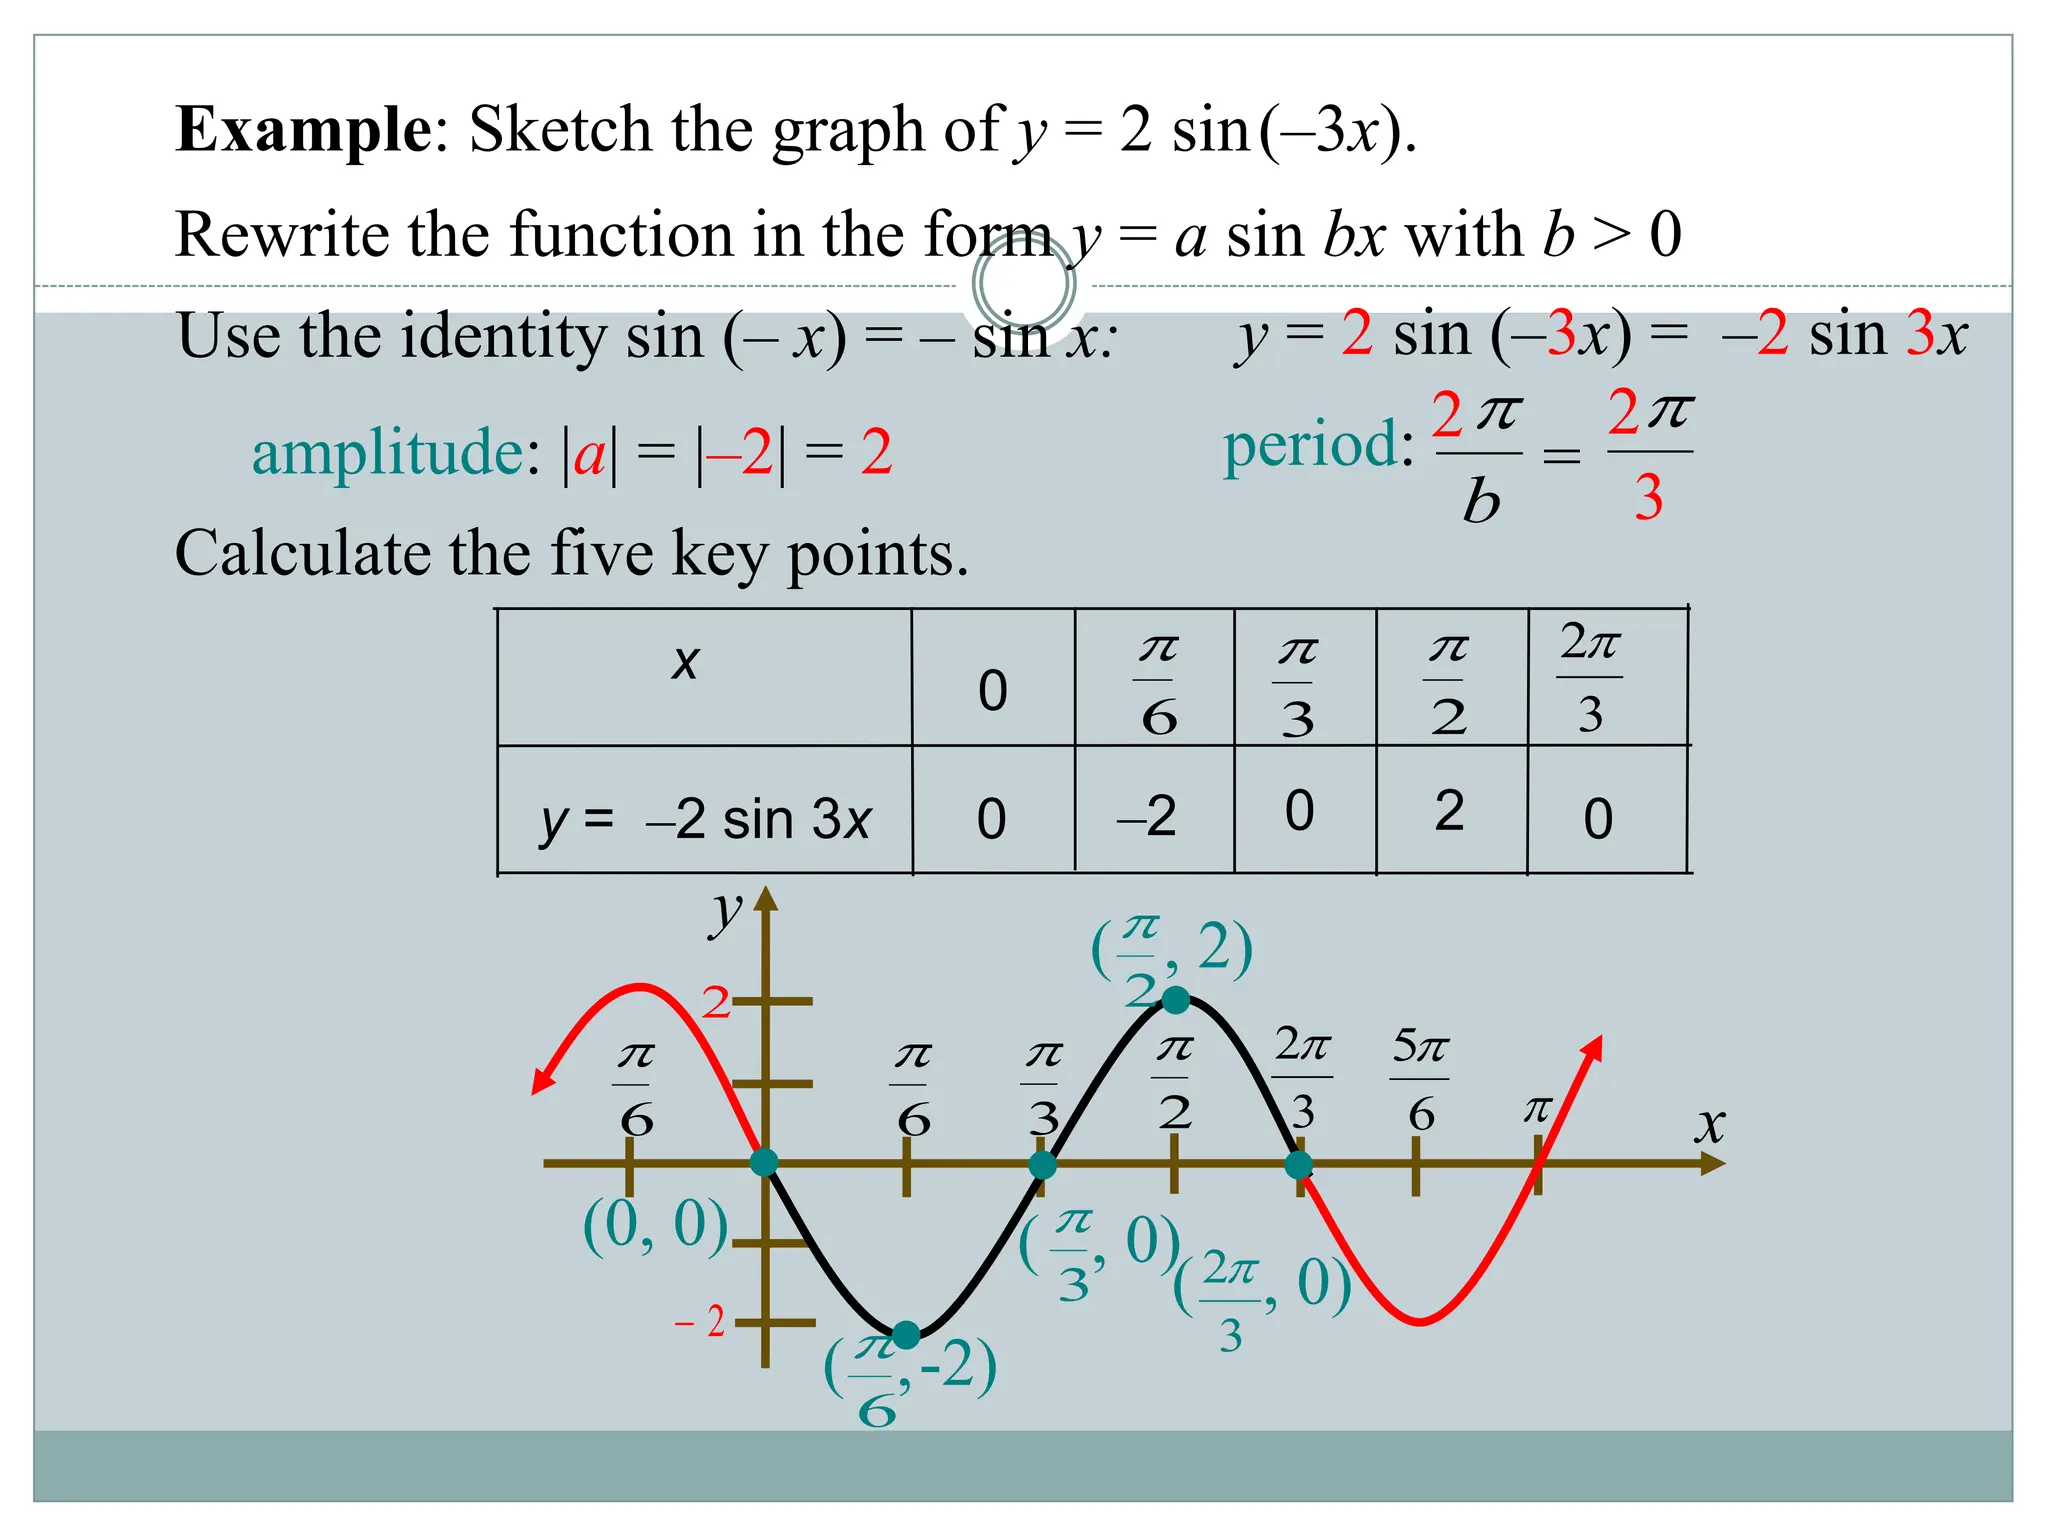
![Cosine is a periodic function: p = 2π
One period
2π
π 3π
−2π 2π
−π
−3π 0
θ
cos θ
cos θ: Domain (angle measures): all real numbers, (−∞, ∞)
Range (ratio of sides): −1 to 1, inclusive [−1, 1]
cos θ is an even function; it is symmetric wrt the y-axis.
cos(−θ) = cos(θ)
,
Domain
](https://image.slidesharecdn.com/graphingtrigfunctions-240311121659-2ae4413a/75/Graphing-Trig-Functions-Tangent-and-Cotangent-ppt-12-2048.jpg)
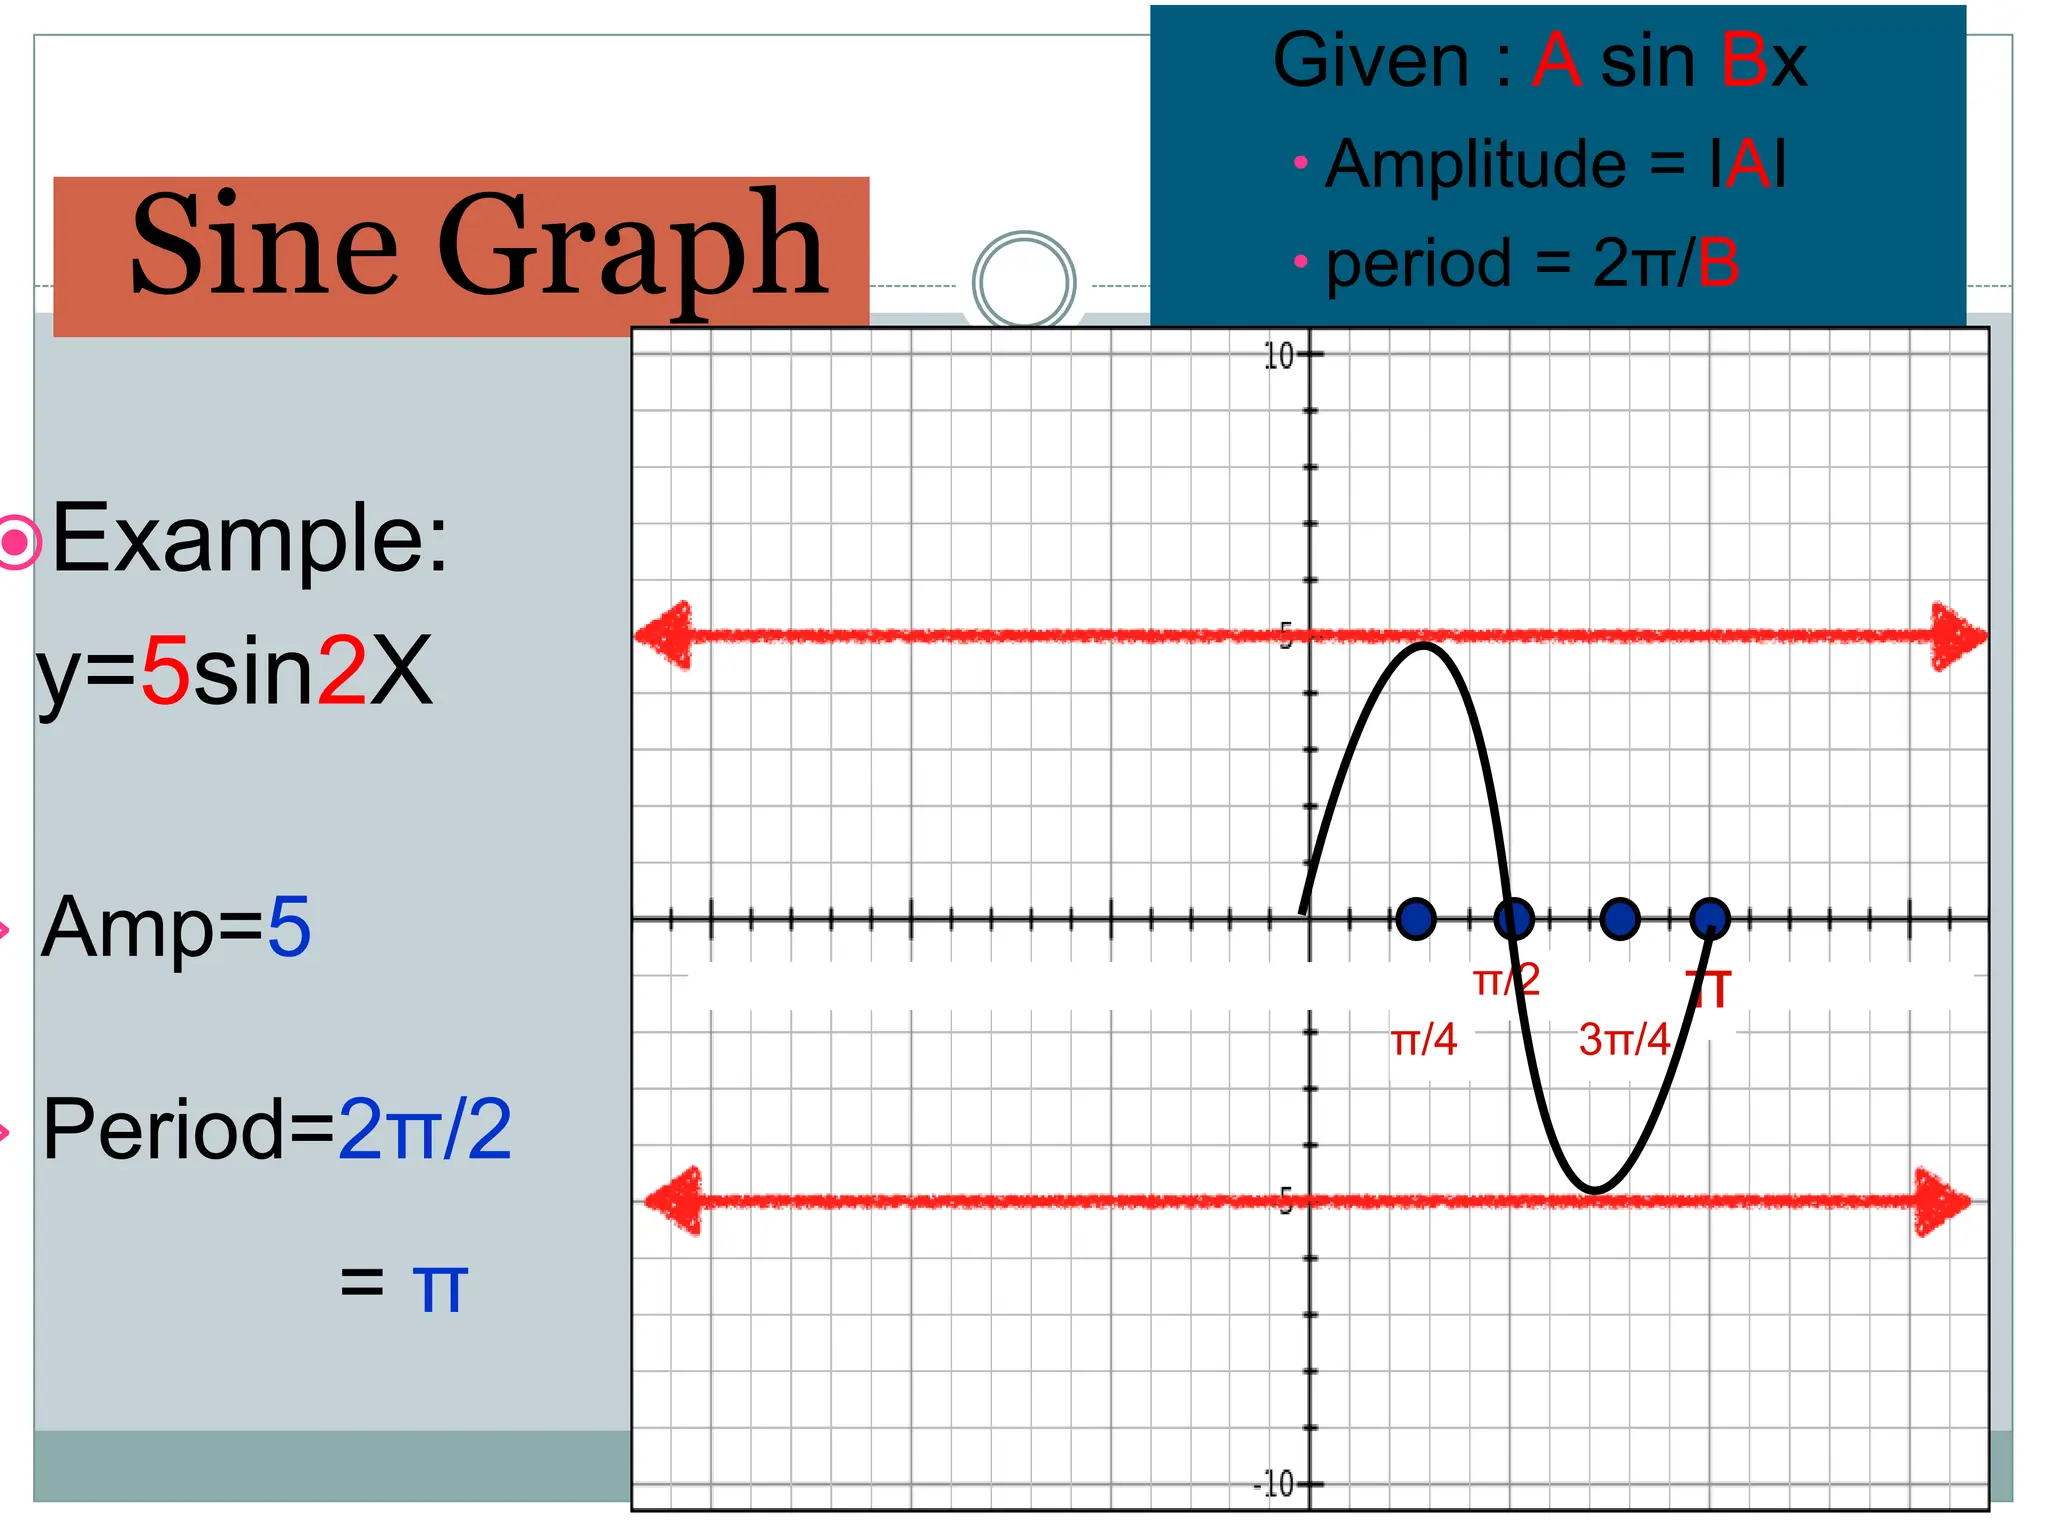
![y
1
2
3
2
x
3
2
4
Example: Sketch the graph of y = 3 cos x on the interval [–, 4].
Partition the interval [0, 2] into four equal parts. Find the five key
points; graph one cycle; then repeat the cycle over the interval.
max
x-int
min
x-int
max
3
0
-3
0
3
y = 3 cos x
2
0
x 2
2
3
(0, 3)
2
3
( , 0)
( , 0)
2
2
( , 3)
( , –3)](https://image.slidesharecdn.com/graphingtrigfunctions-240311121659-2ae4413a/75/Graphing-Trig-Functions-Tangent-and-Cotangent-ppt-15-2048.jpg)
![Cosecant is the reciprocal of sine
sin θ: Domain: (−∞, ∞)
Range: [−1, 1]
csc θ: Domain: θ ≠ πn
(where sin θ = 0)
Range: |csc θ| ≥ 1
or (−∞, −1] U [1, ∞]
sin θ and csc θ
are odd
(symm wrt origin)
One period: 2π
π 2π 3π
0
−π
−2π
−3π
Vertical asymptotes
where sin θ = 0
θ
csc θ
sin θ](https://image.slidesharecdn.com/graphingtrigfunctions-240311121659-2ae4413a/75/Graphing-Trig-Functions-Tangent-and-Cotangent-ppt-25-2048.jpg)
![
2
3
x
2
2
2
2
5
y
4
4
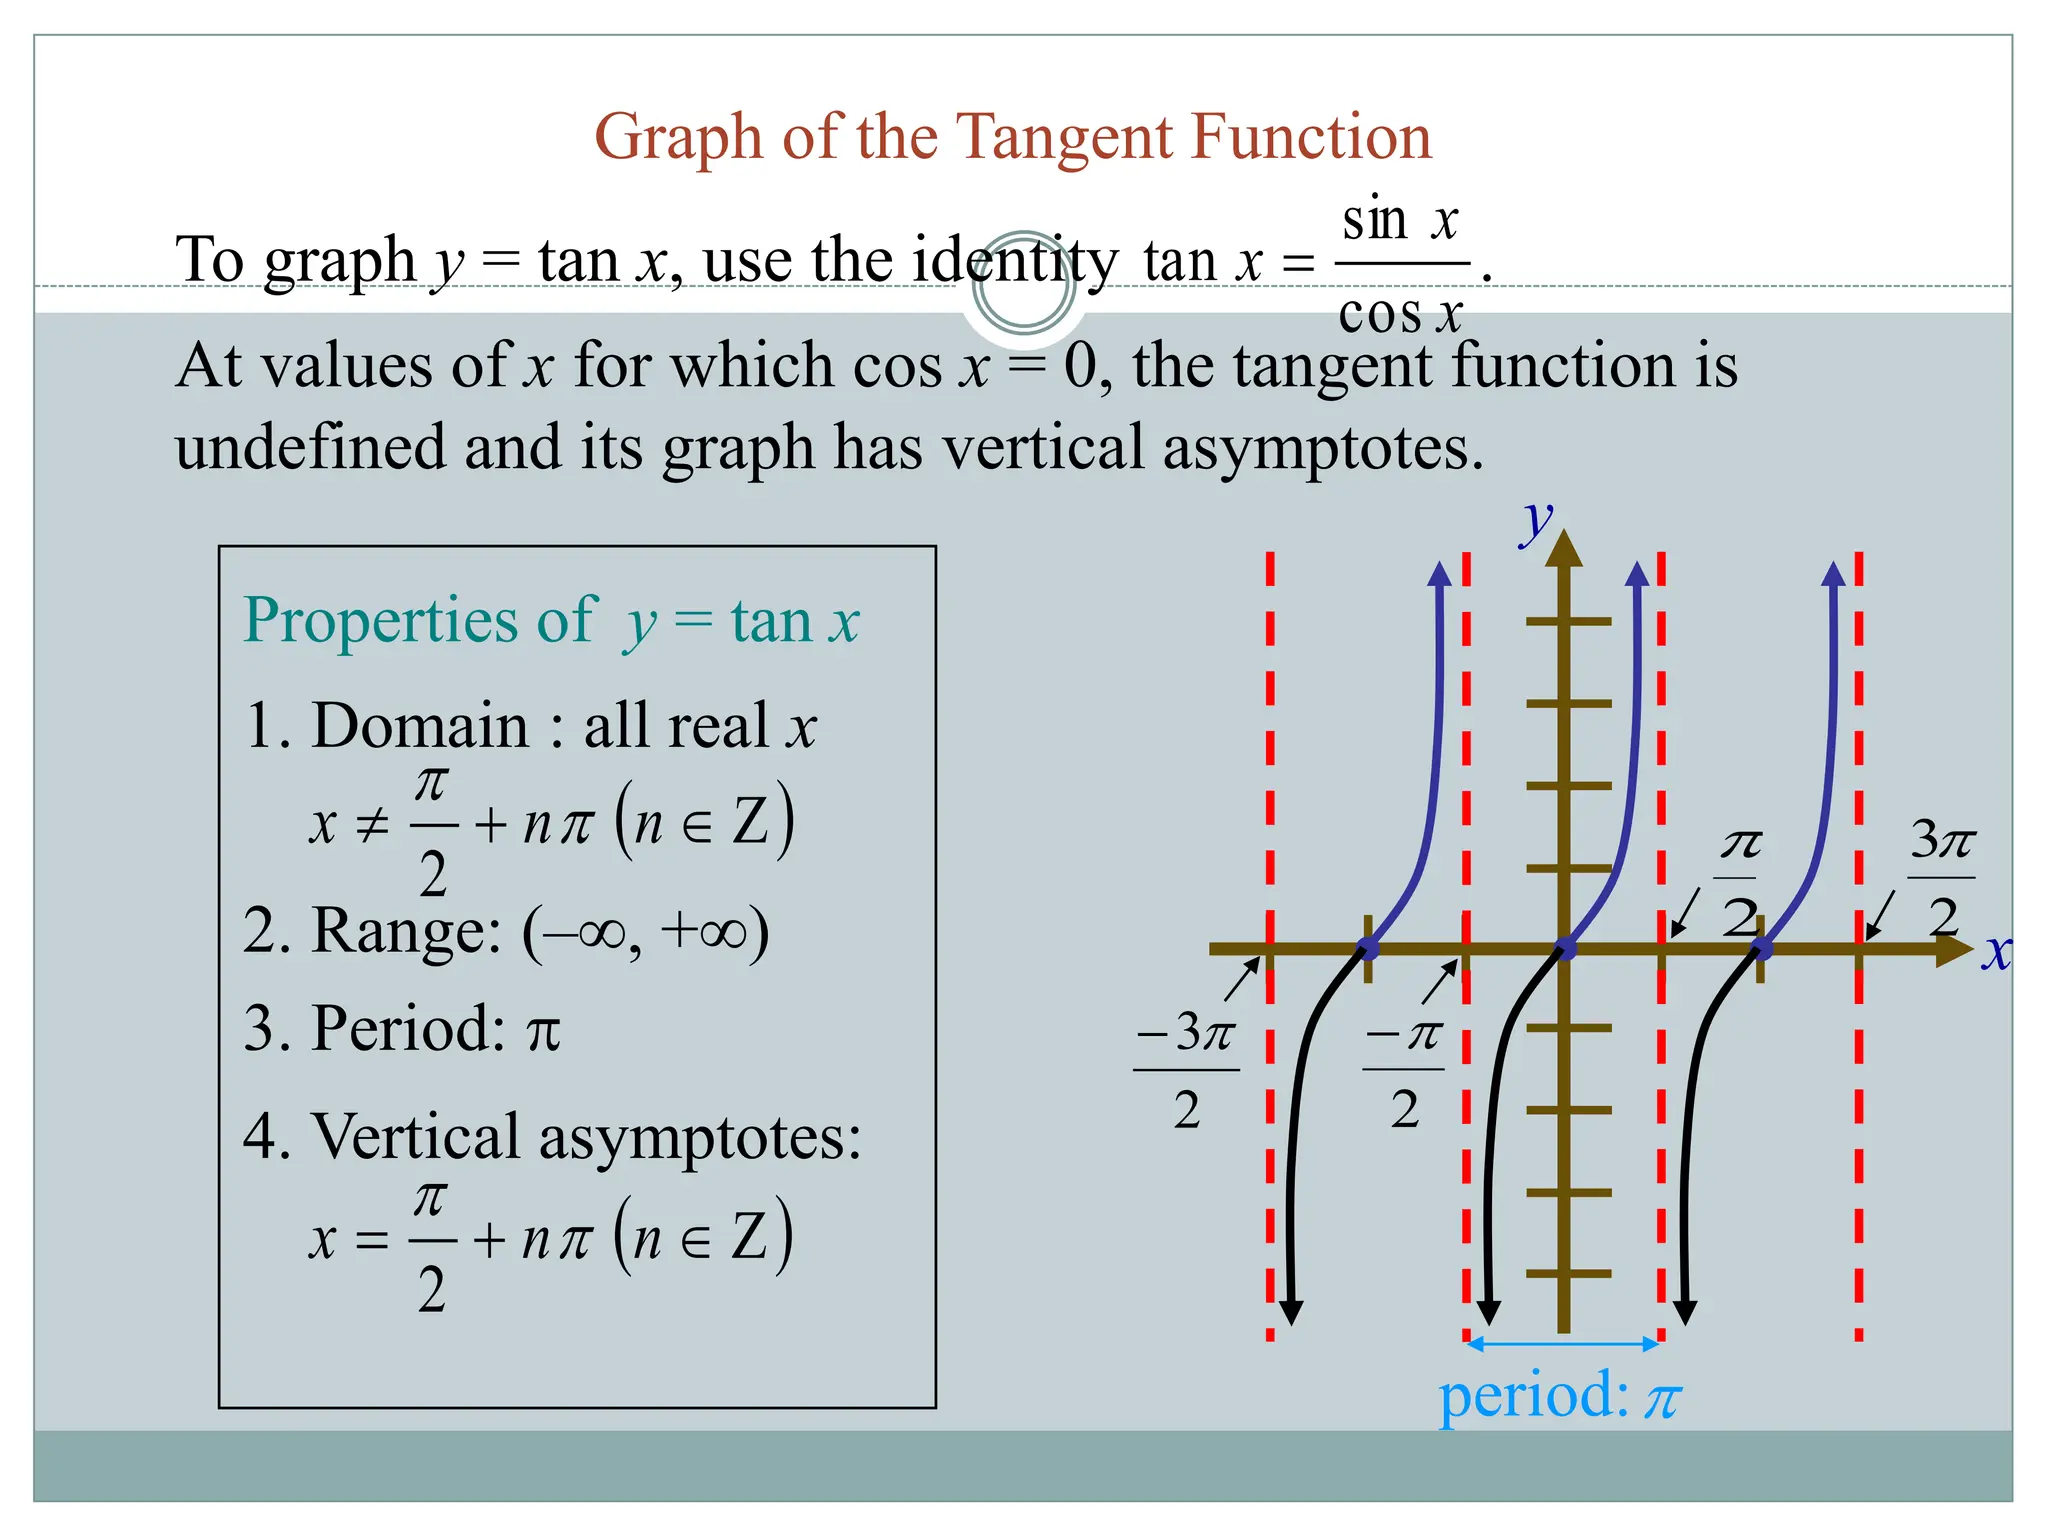
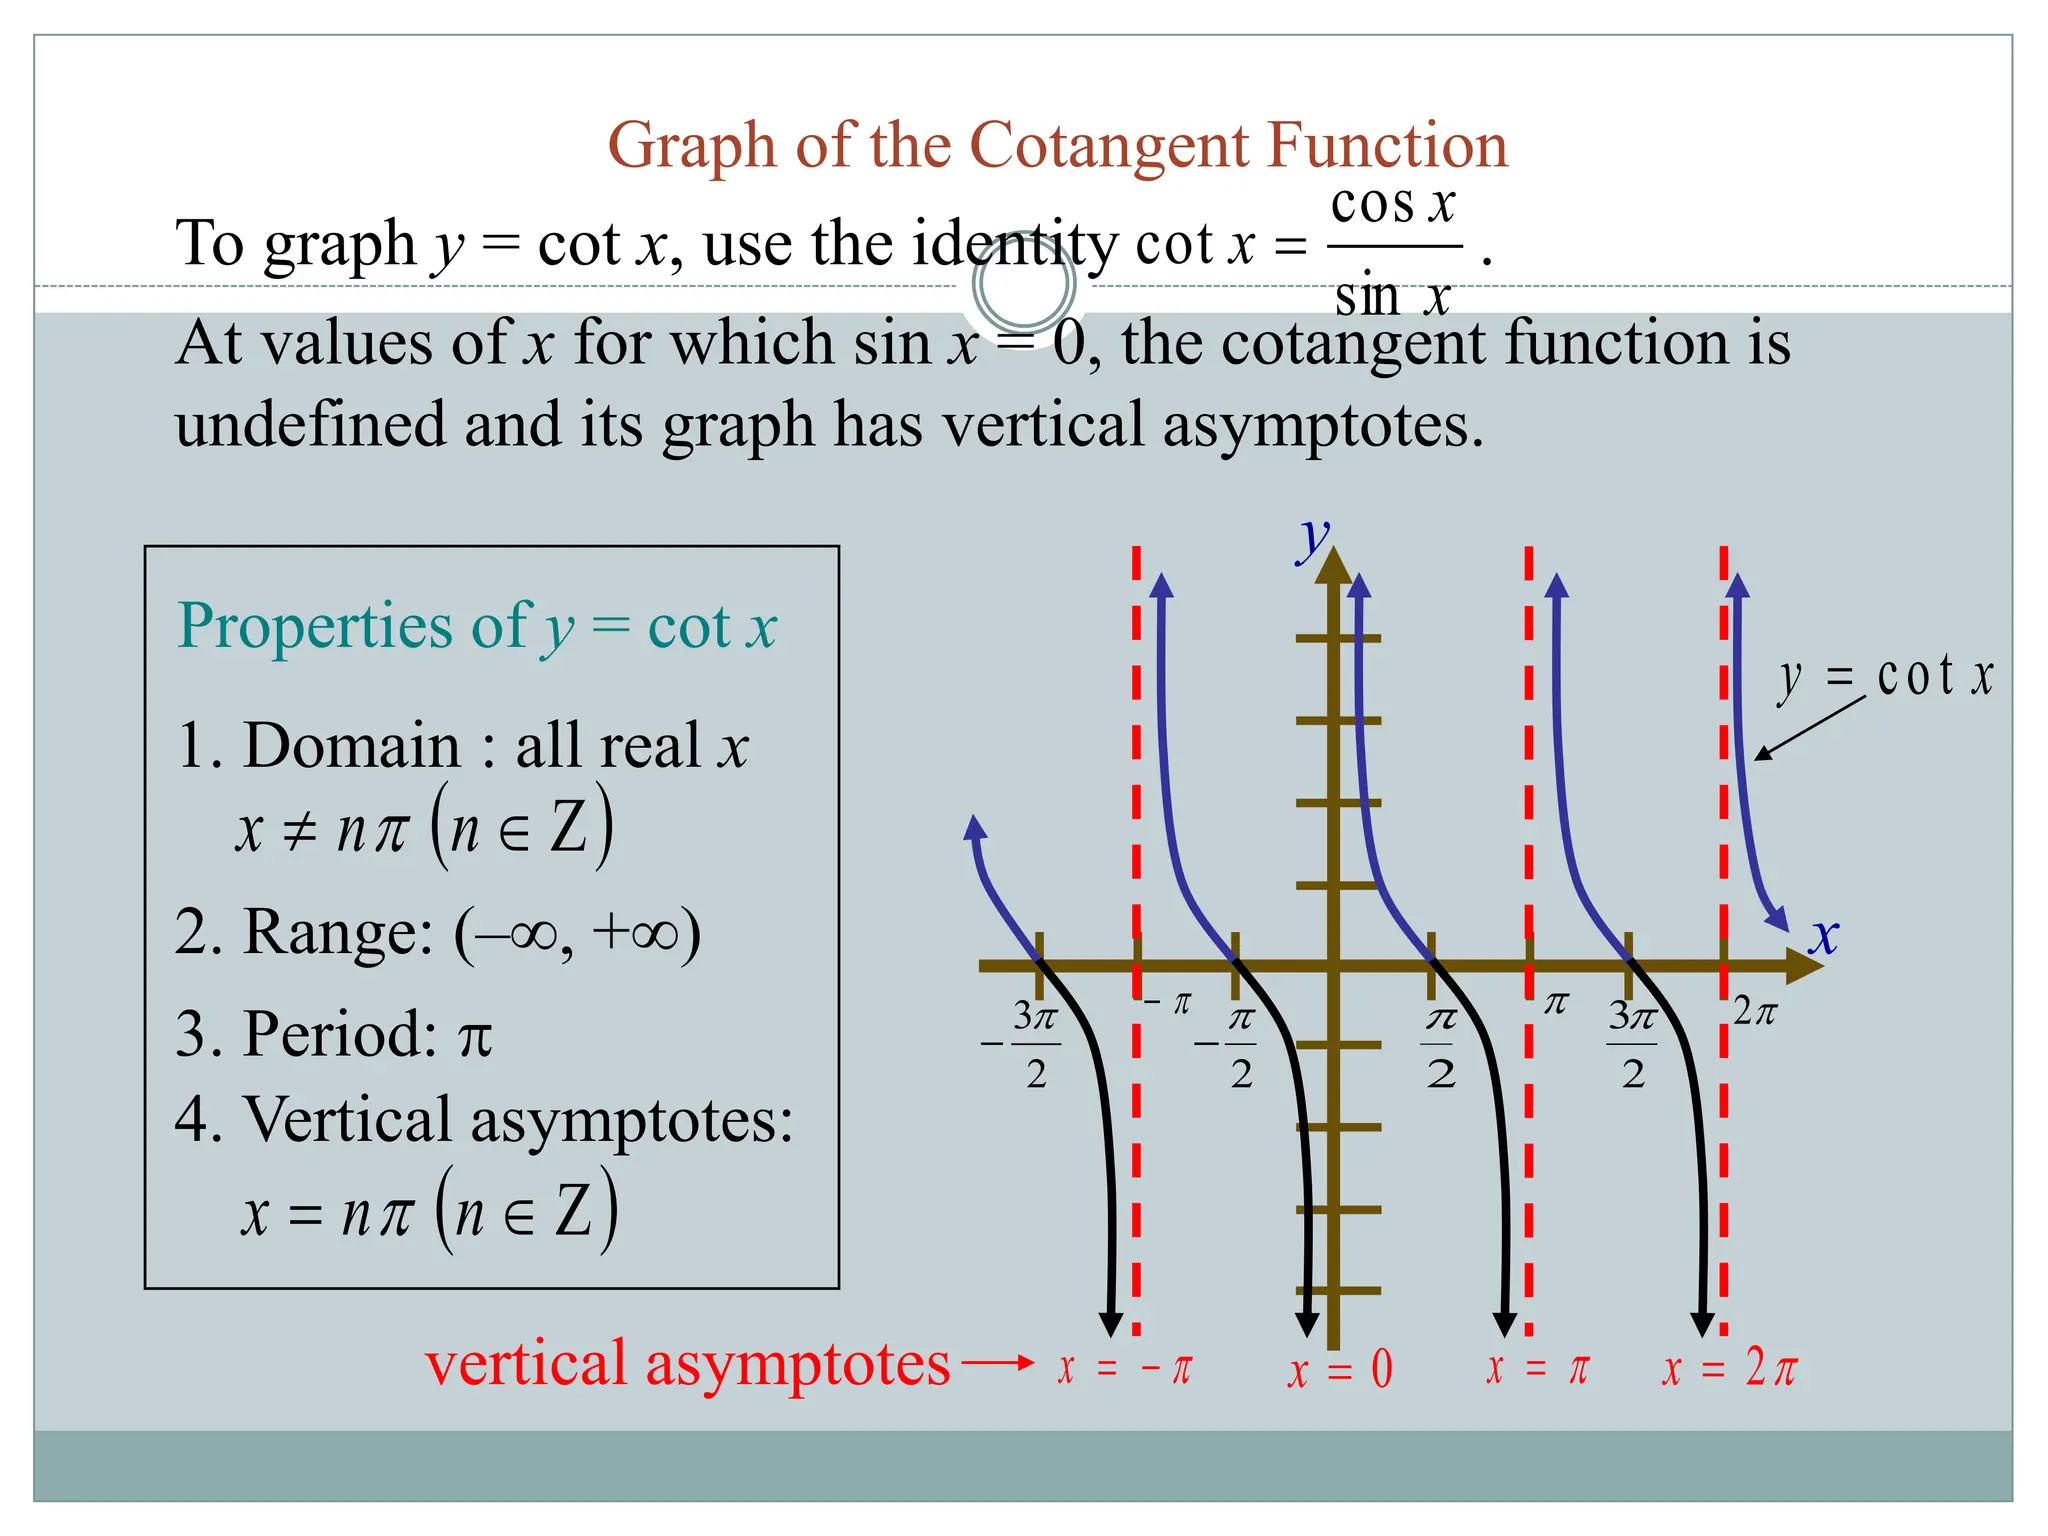
Graph of the Cosecant Function
2. range: (–,–1] [1, +)
3. period:
where sine is zero.
4. vertical asymptotes:
n
n
x
1. domain : all real x
n
n
x
sin
1
csc
x
x
To graph y = csc x, use the identity .
Properties of y = csc x
x
y c sc
x
y sin
At values of x for which sin x = 0, the cosecant function
is undefined and its graph has vertical asymptotes.](https://image.slidesharecdn.com/graphingtrigfunctions-240311121659-2ae4413a/75/Graphing-Trig-Functions-Tangent-and-Cotangent-ppt-26-2048.jpg)
![Secant is the reciprocal of cosine
cos θ: Domain: (−∞, ∞)
Range: [−1, 1]
One period: 2π
π 3π
−2π 2π
−π
−3π 0
θ
sec θ
cos θ
Vertical asymptotes
where cos θ = 0
sec θ: Domain: θ ≠ π/2 + πn
(where cos θ = 0)
Range: |sec θ | ≥ 1
or (−∞, −1] U [1, ∞]
cos θ and sec θ
are even
(symm wrt y-axis)](https://image.slidesharecdn.com/graphingtrigfunctions-240311121659-2ae4413a/75/Graphing-Trig-Functions-Tangent-and-Cotangent-ppt-27-2048.jpg)
![2
3
y
x
2
2
2
3
2
5
4
4
x
y c o s
Graph of the Secant Function
2. range: (–,–1] [1, +)
3. period: 2
4. vertical asymptotes:
n
n
x
2
1. domain : all real x
)
(
2
n
n
x
cos
1
sec
x
x
The graph y = sec x, use the identity .
Properties of y = sec x
x
y se c
At values of x for which cos x = 0, the secant function is undefined
and its graph has vertical asymptotes.](https://image.slidesharecdn.com/graphingtrigfunctions-240311121659-2ae4413a/75/Graphing-Trig-Functions-Tangent-and-Cotangent-ppt-28-2048.jpg)
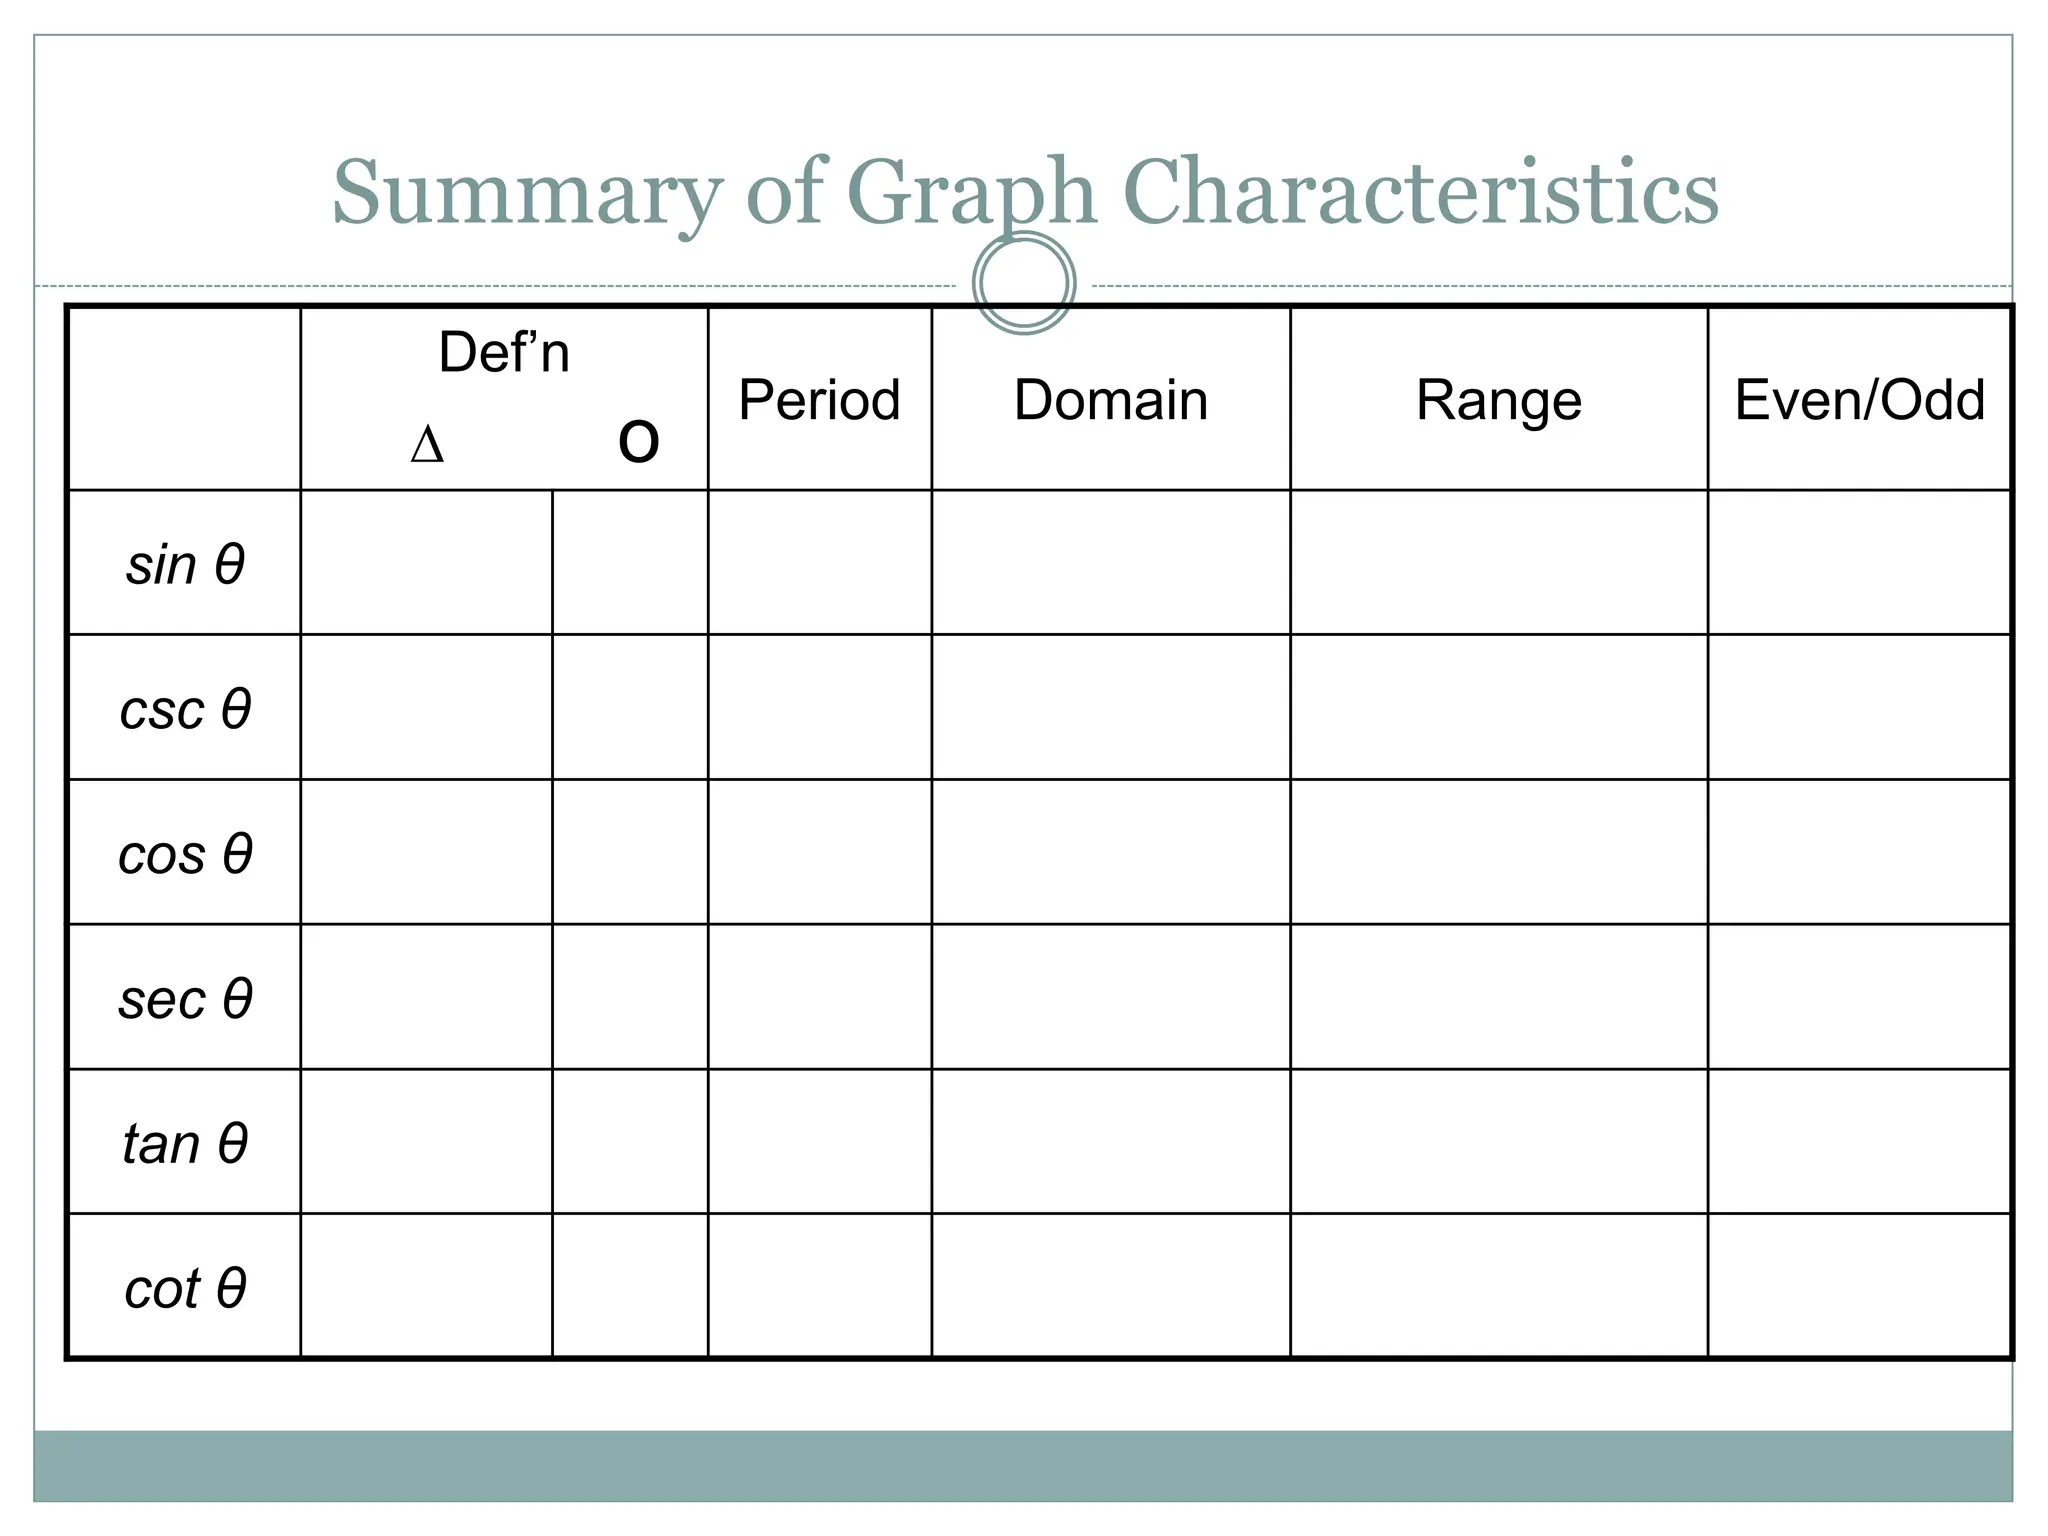
![Summary of Graph Characteristics
Def’n
∆ о
Period Domain Range Even/Odd
sin θ
opp
hyp
y
r 2π (−∞, ∞)
−1 ≤ x ≤ 1 or
[−1, 1]
odd
csc θ
1
.sinθ
r
.y 2π θ ≠ πn
|csc θ| ≥ 1 or
(−∞, −1] U [1, ∞)
odd
cos θ
adj
hyp
x
r 2π (−∞, ∞)
All Reals or
(−∞, ∞)
even
sec θ
1 .
cosθ
r
y 2π θ ≠ π2 +πn
|sec θ| ≥ 1 or
(−∞, −1] U [1, ∞)
even
tan θ
sinθ
cosθ
y
x π θ ≠ π2 +πn
All Reals or
(−∞, ∞)
odd
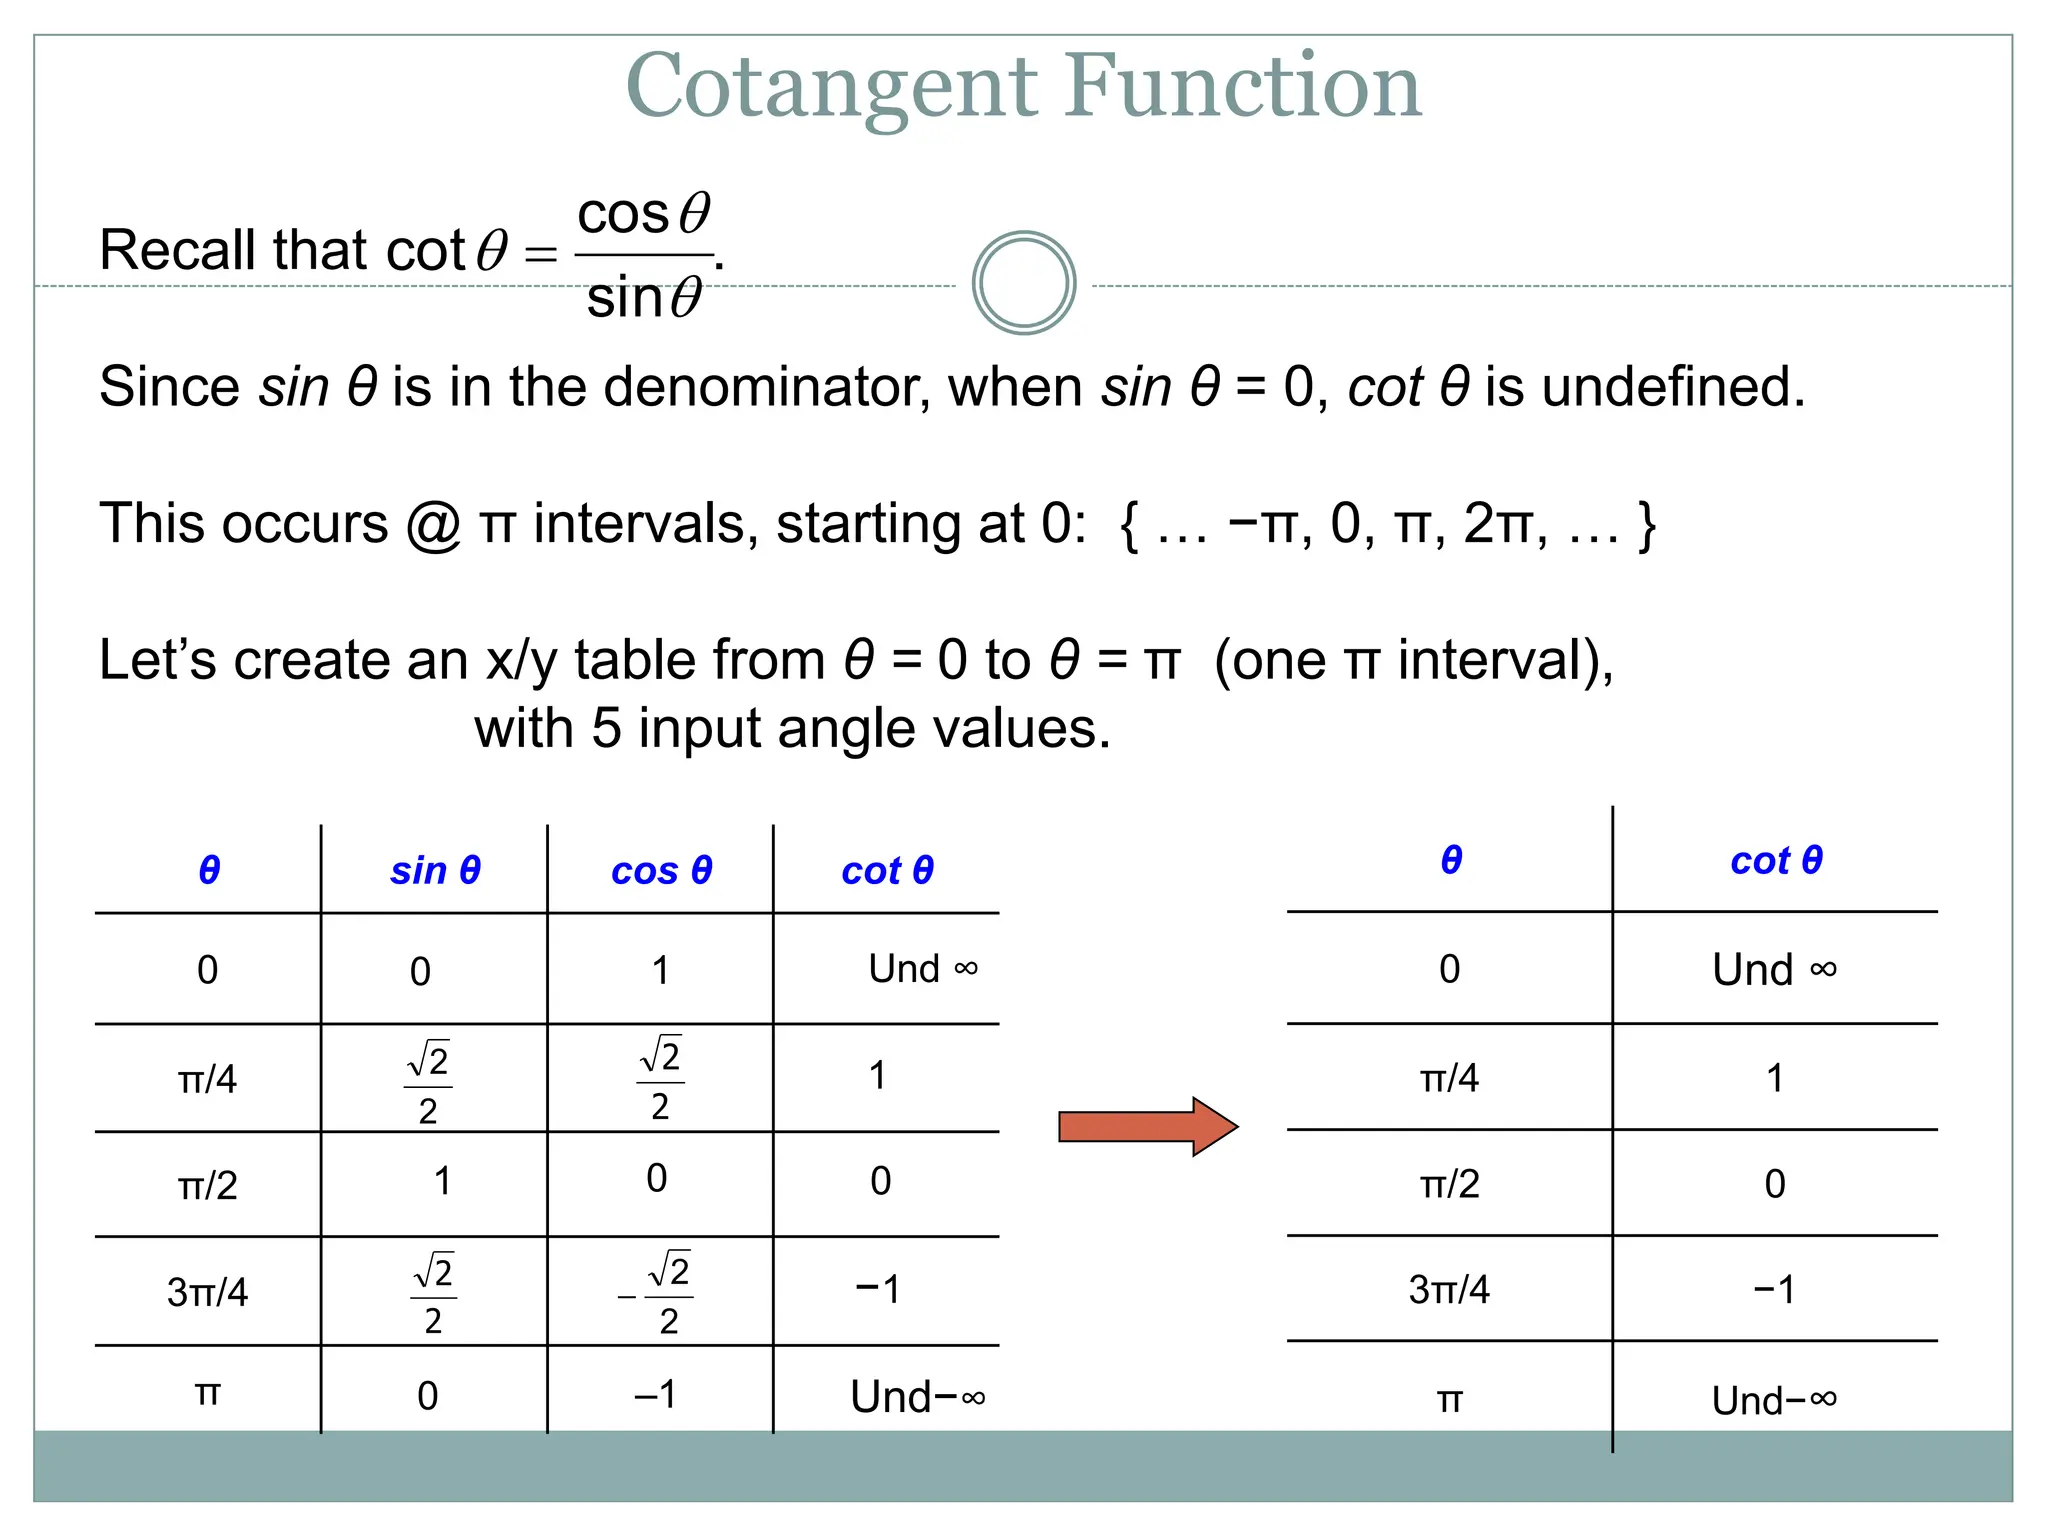
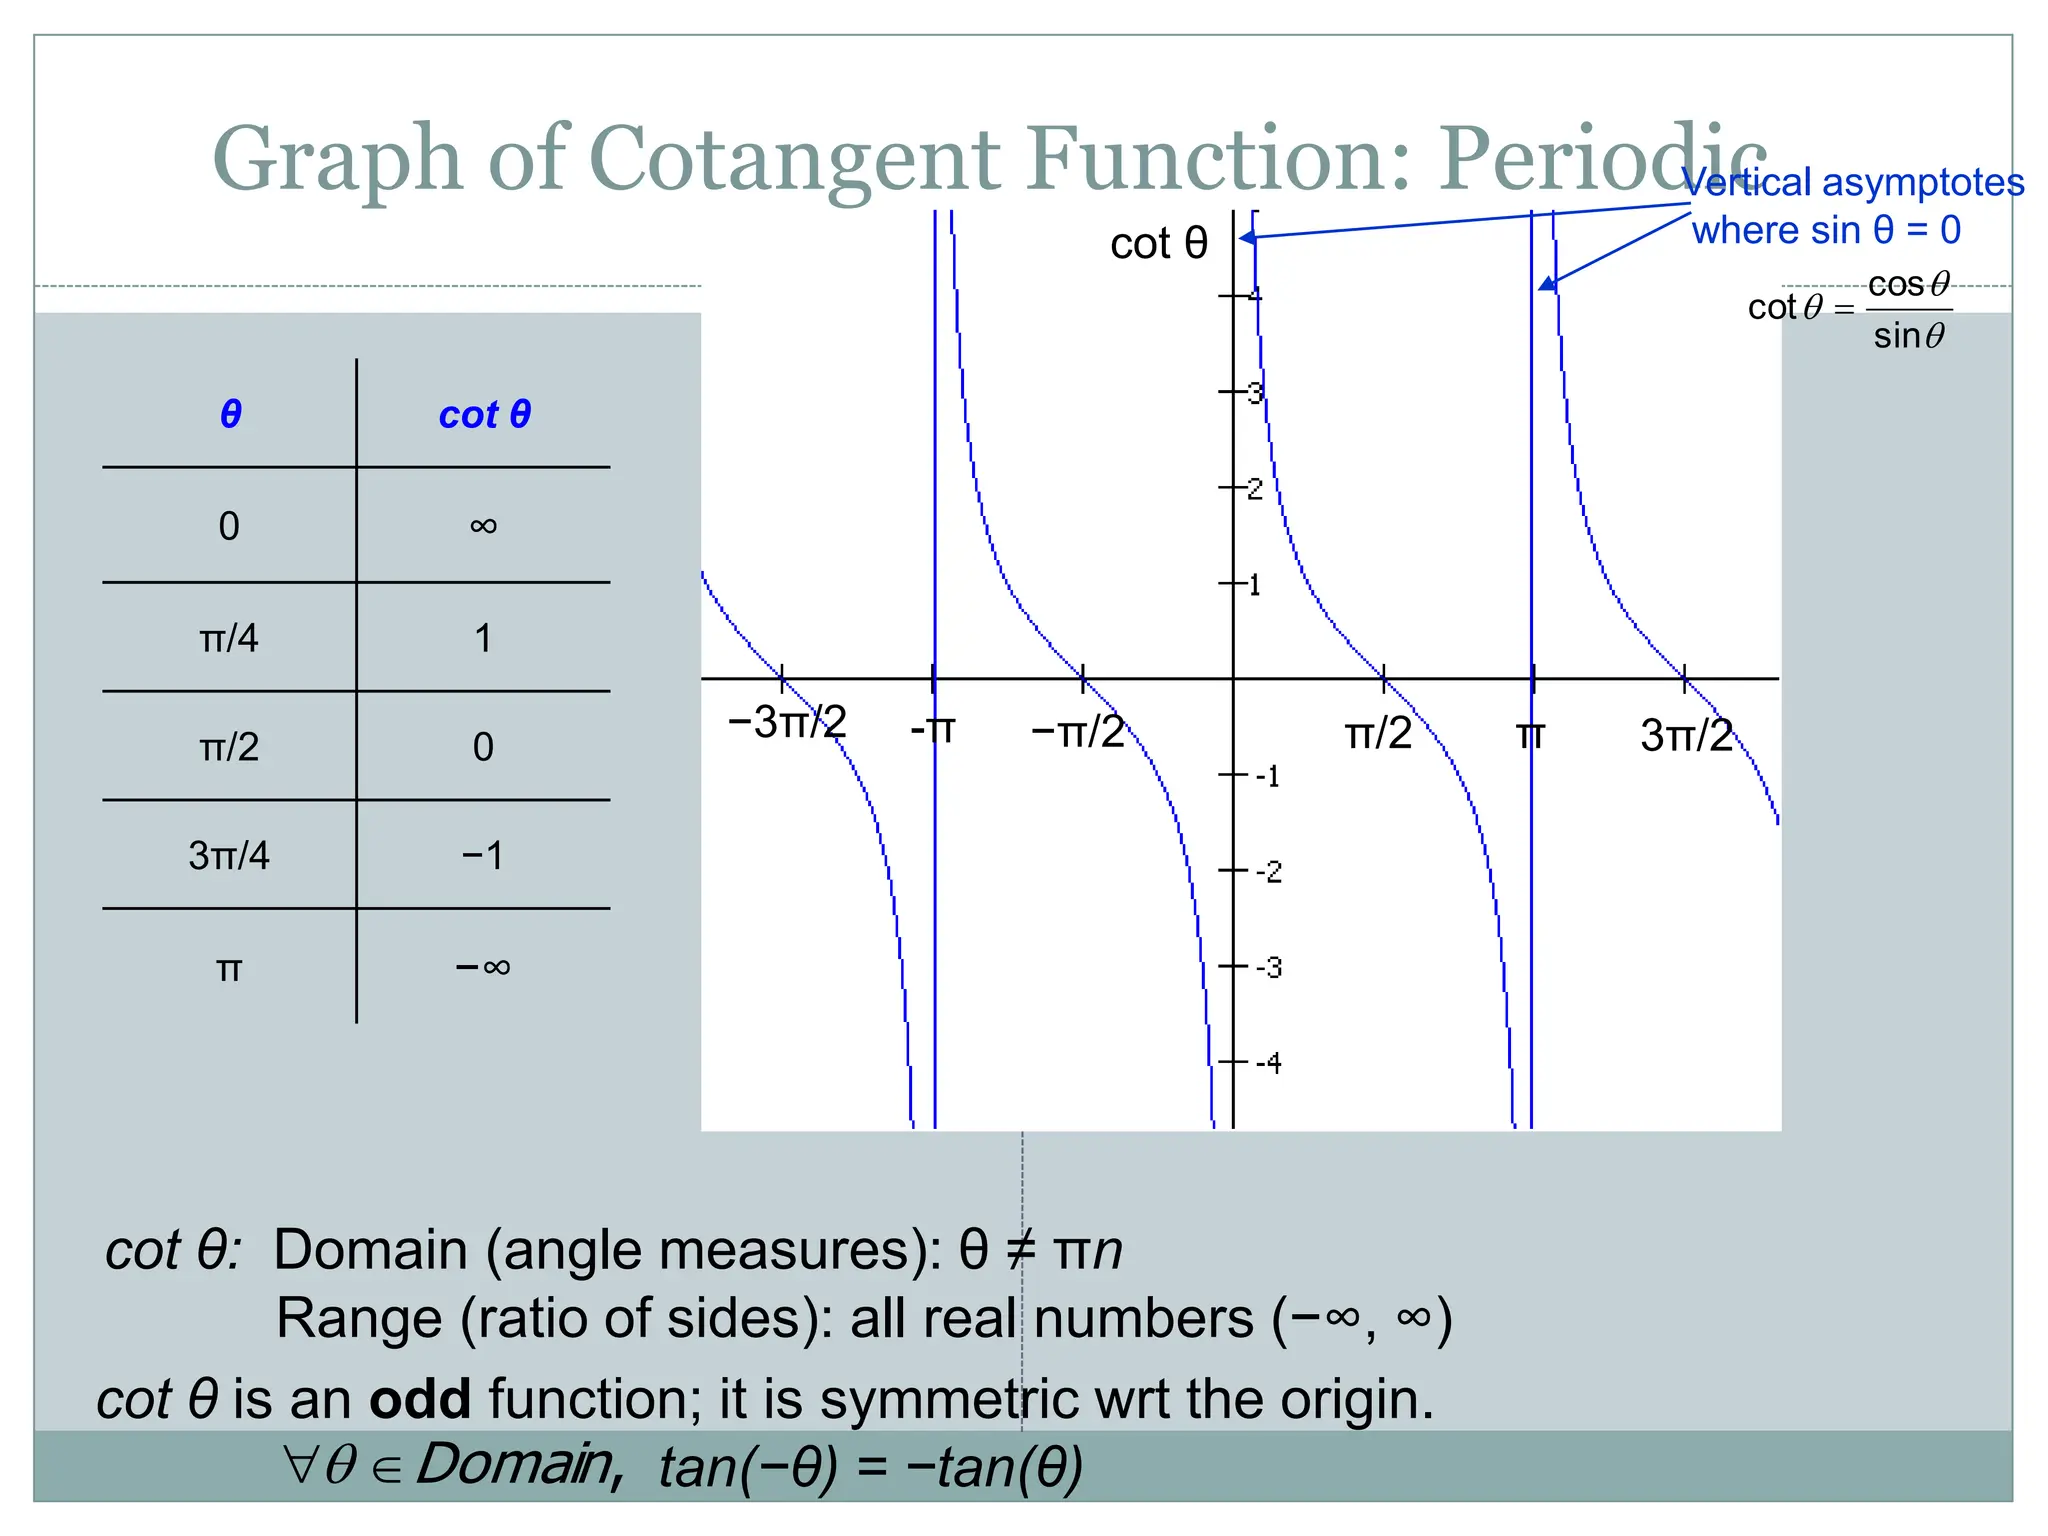
cot θ
cosθ
.sinθ
x
y π θ ≠ πn
All Reals or
(−∞, ∞)
odd](https://image.slidesharecdn.com/graphingtrigfunctions-240311121659-2ae4413a/75/Graphing-Trig-Functions-Tangent-and-Cotangent-ppt-30-2048.jpg)


![Inverse trigonometric functions xii[1]](https://cdn.slidesharecdn.com/ss_thumbnails/inversetrigonometricfunctionsxii1-110816104305-phpapp01-thumbnail.jpg?width=640&height=640&fit=bounds)


