Download to read offline
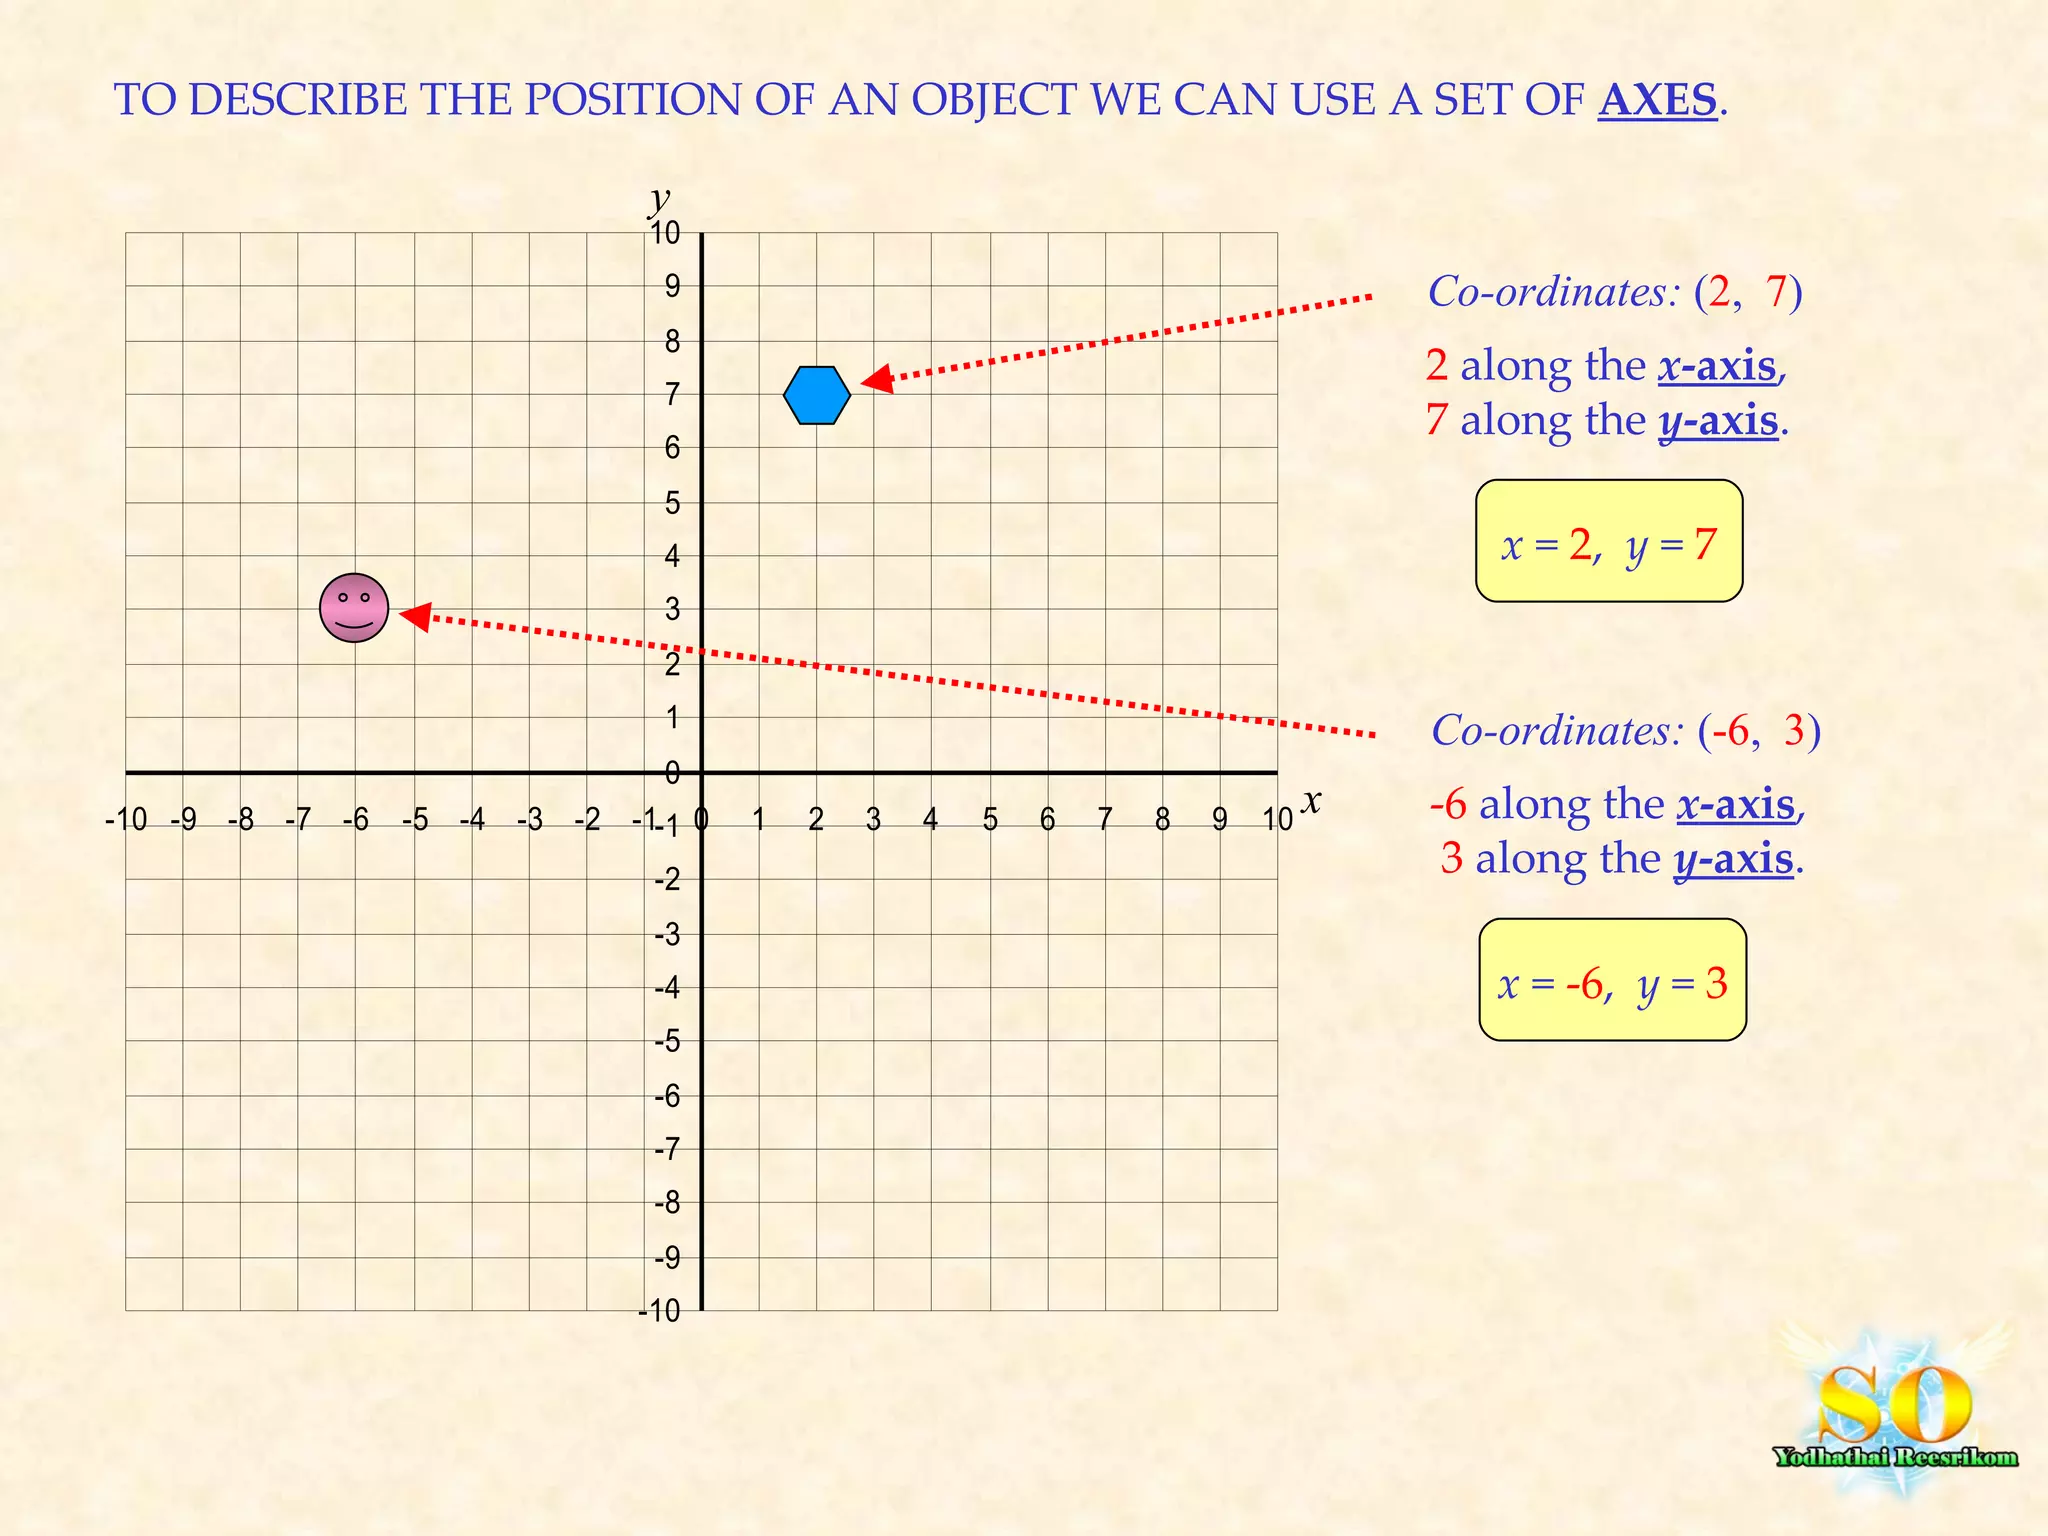
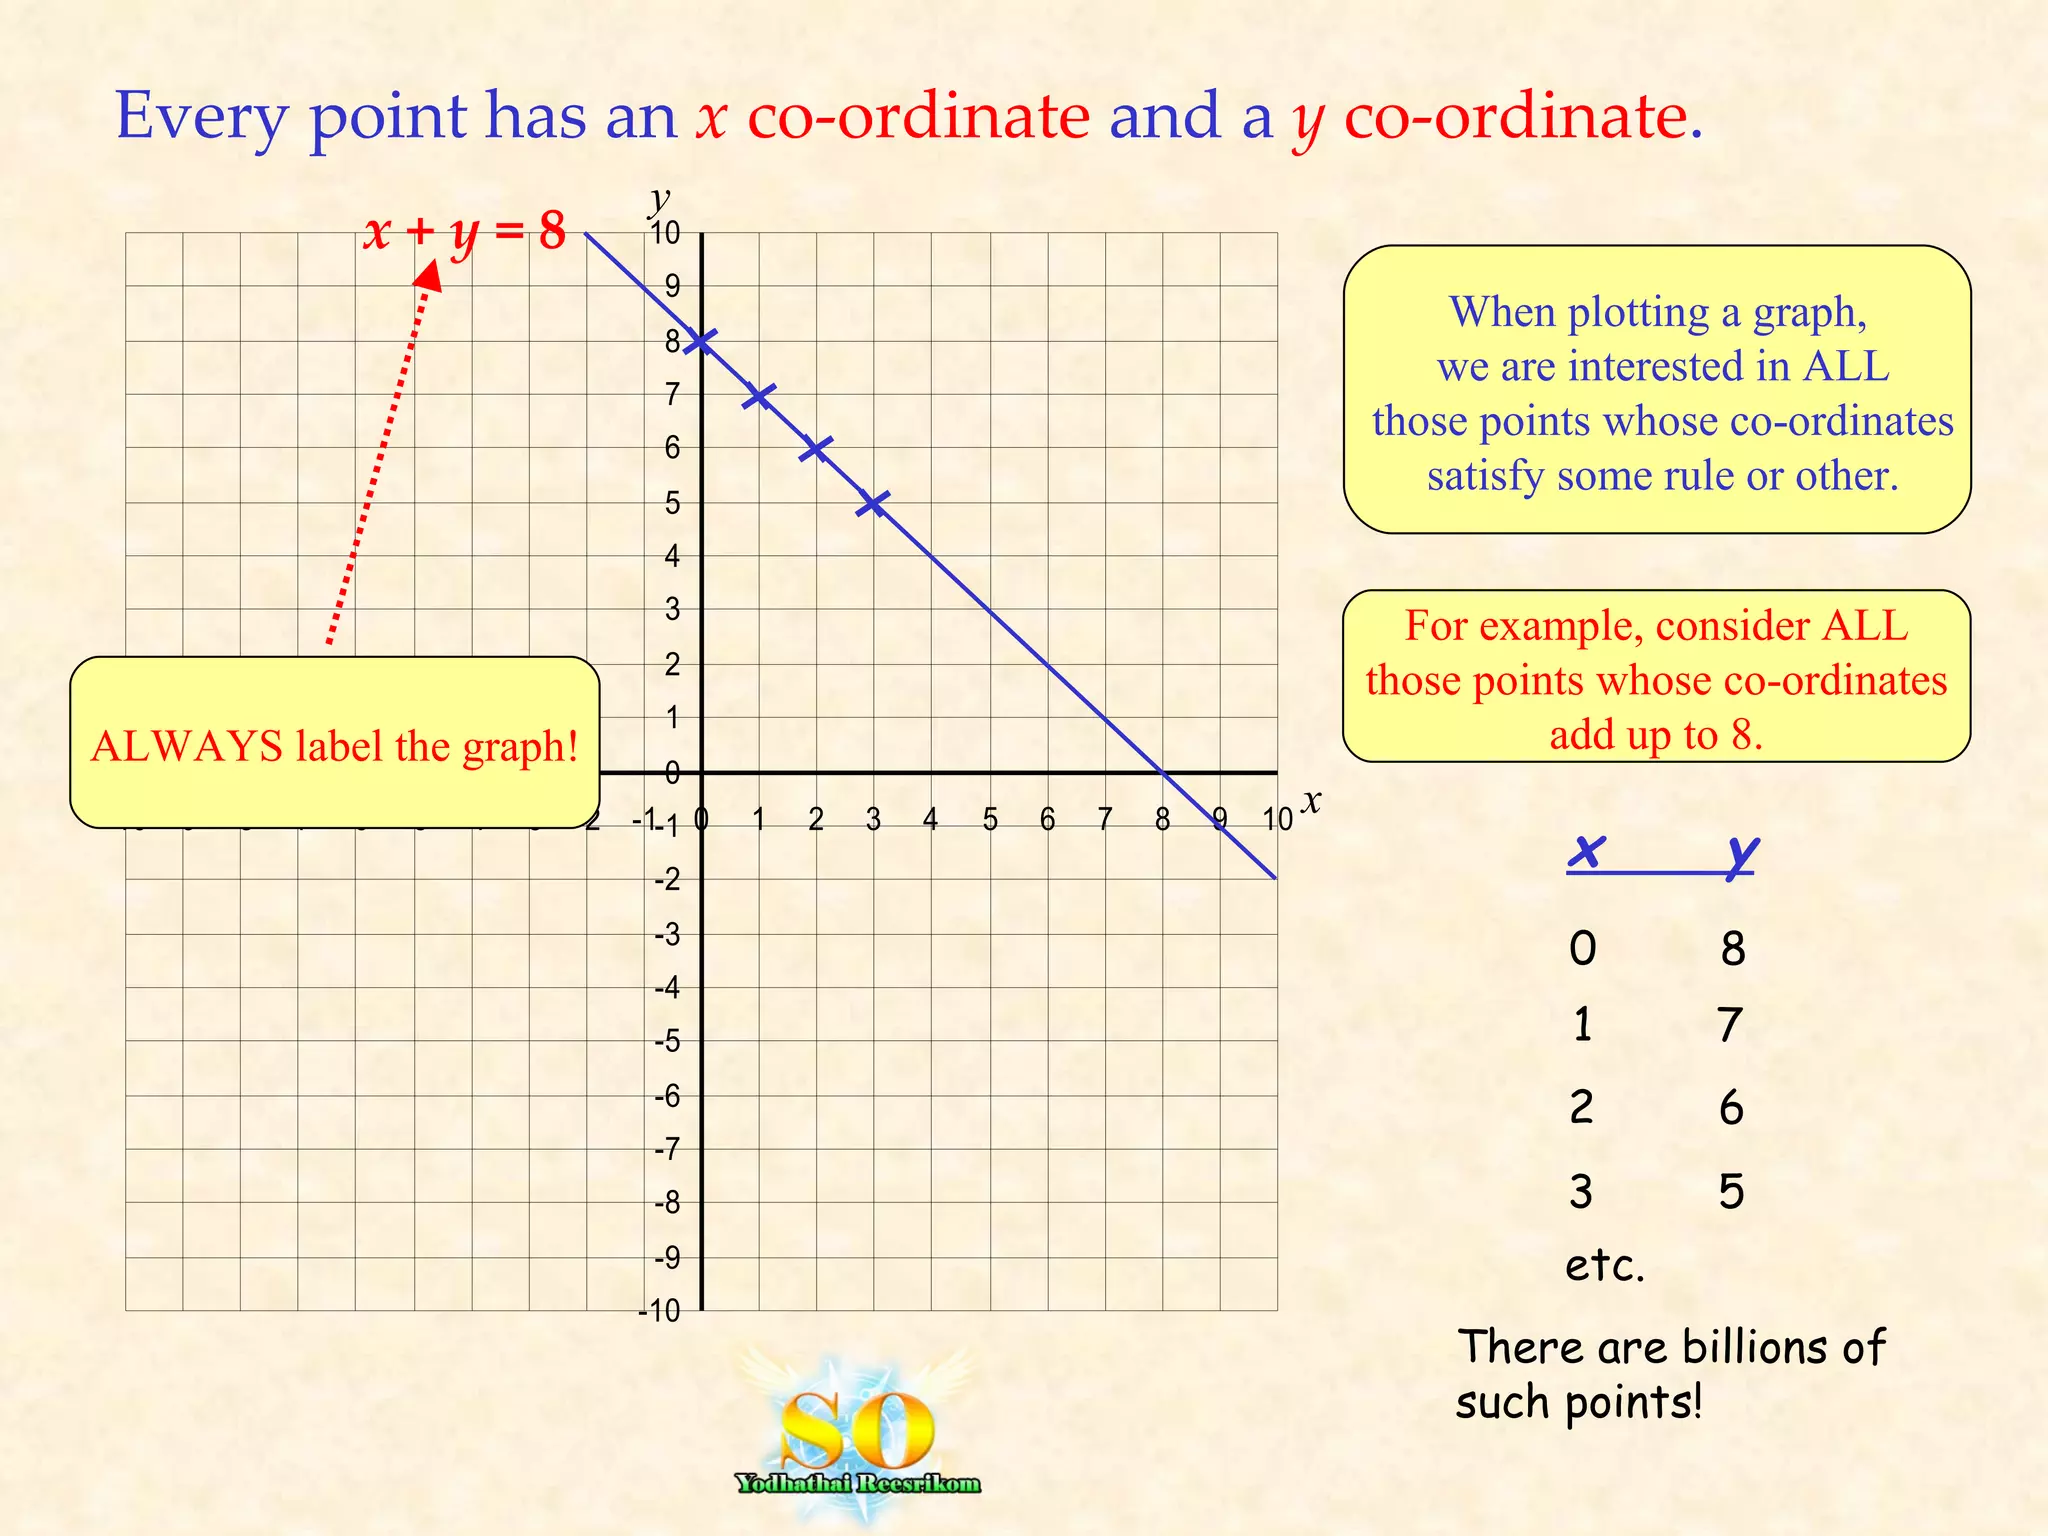
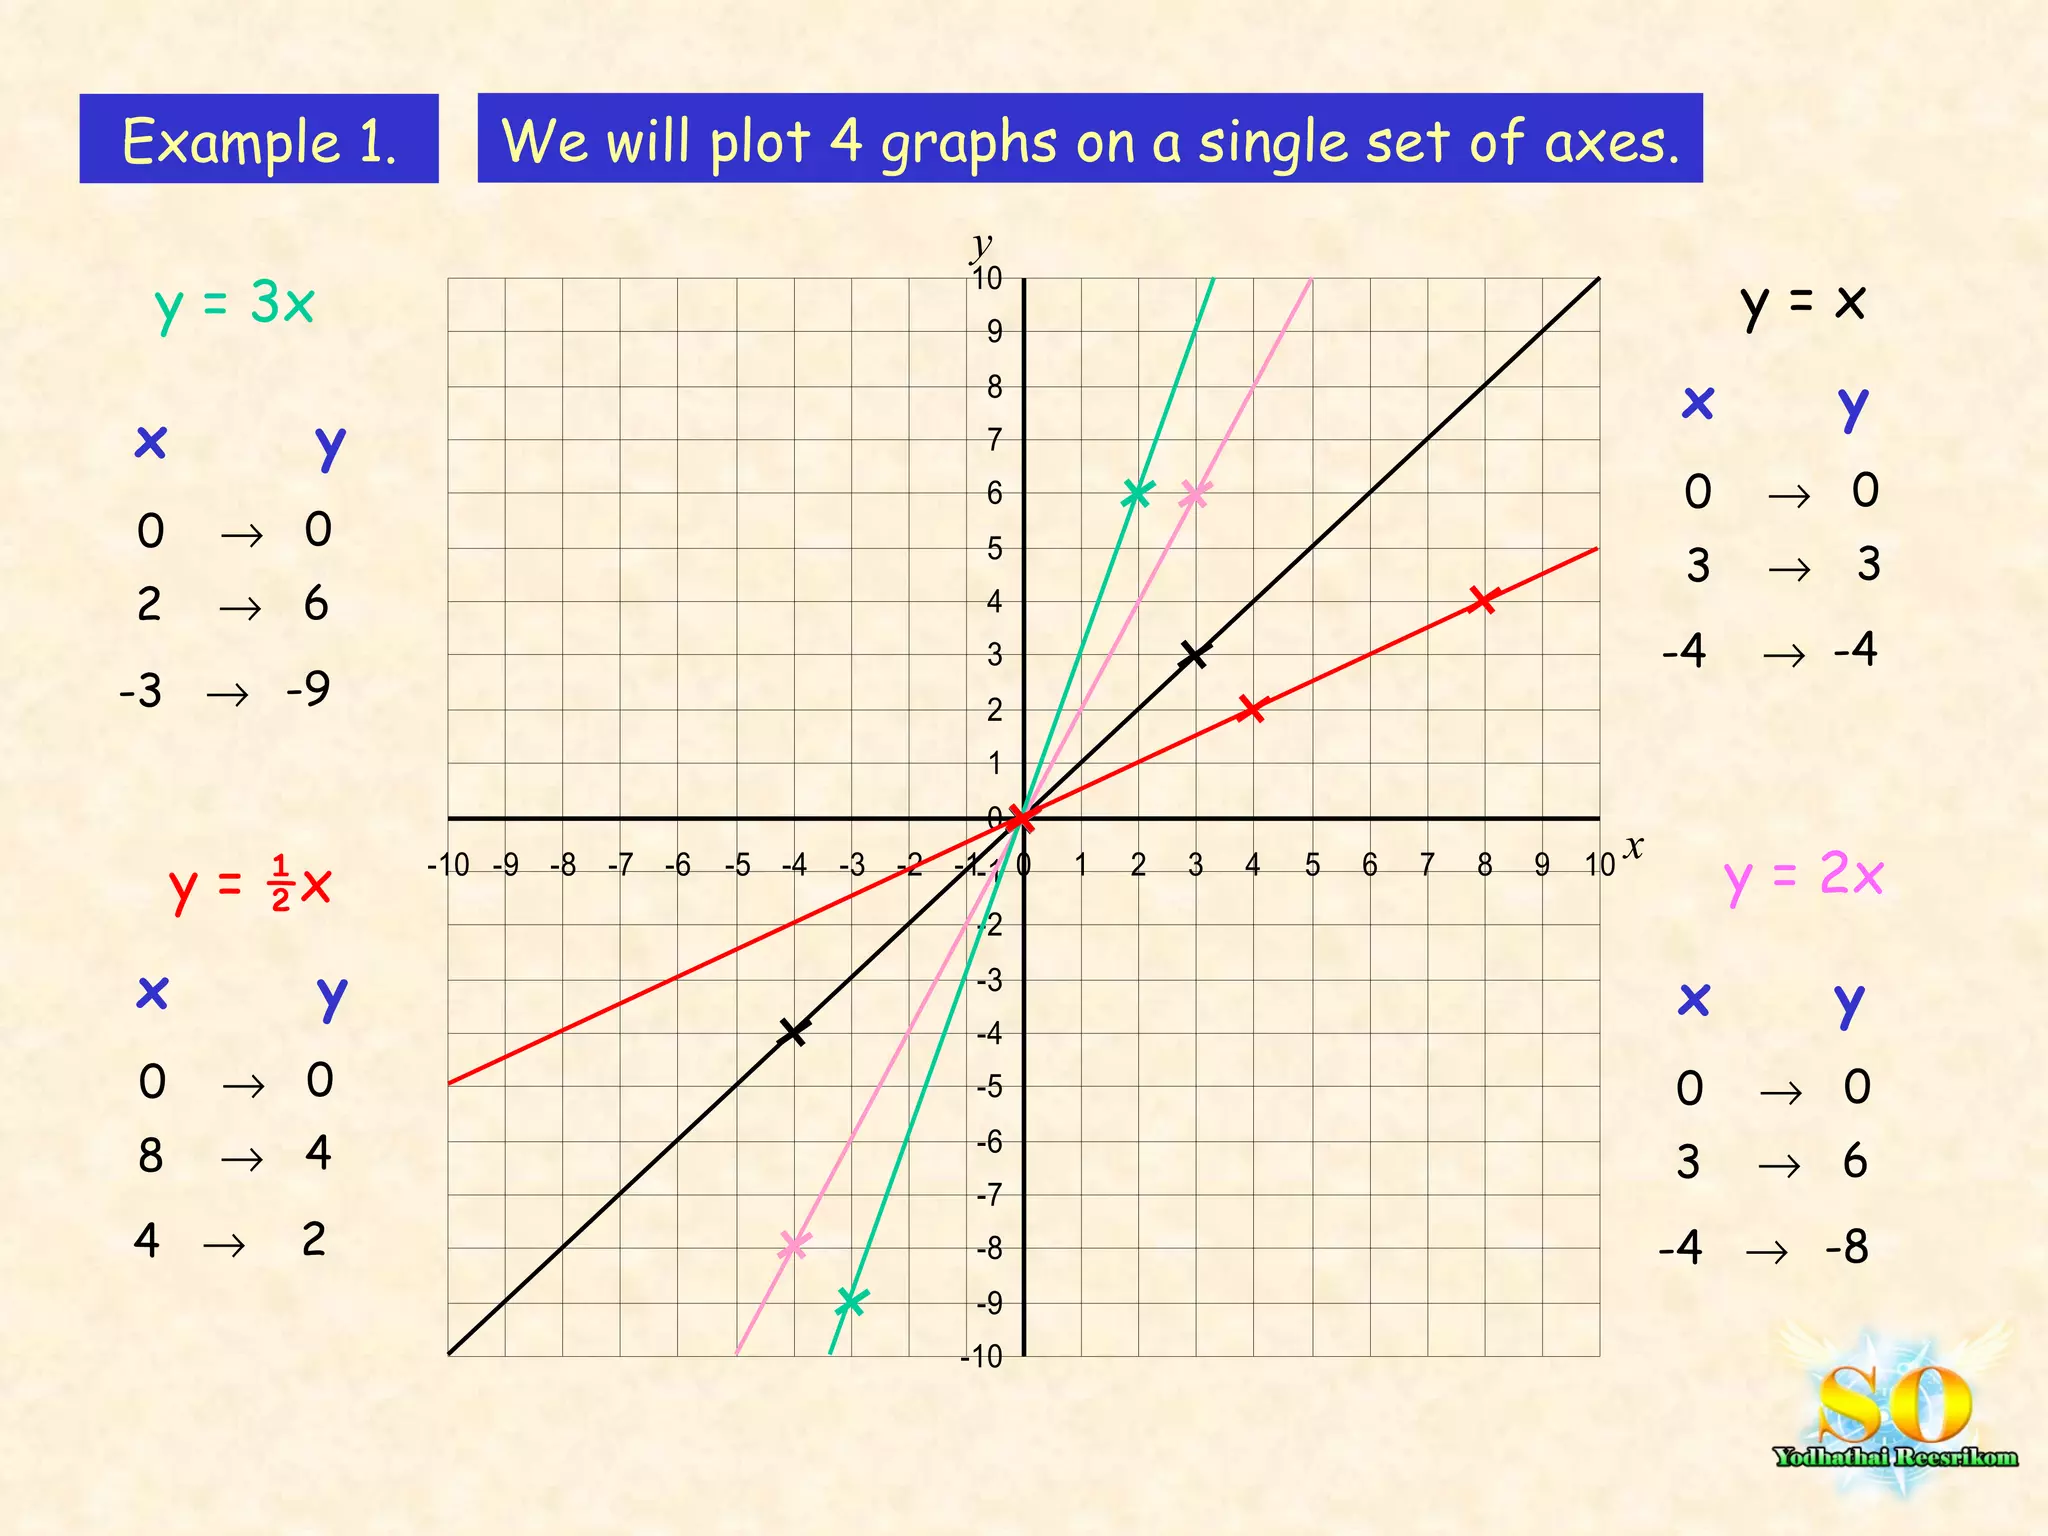
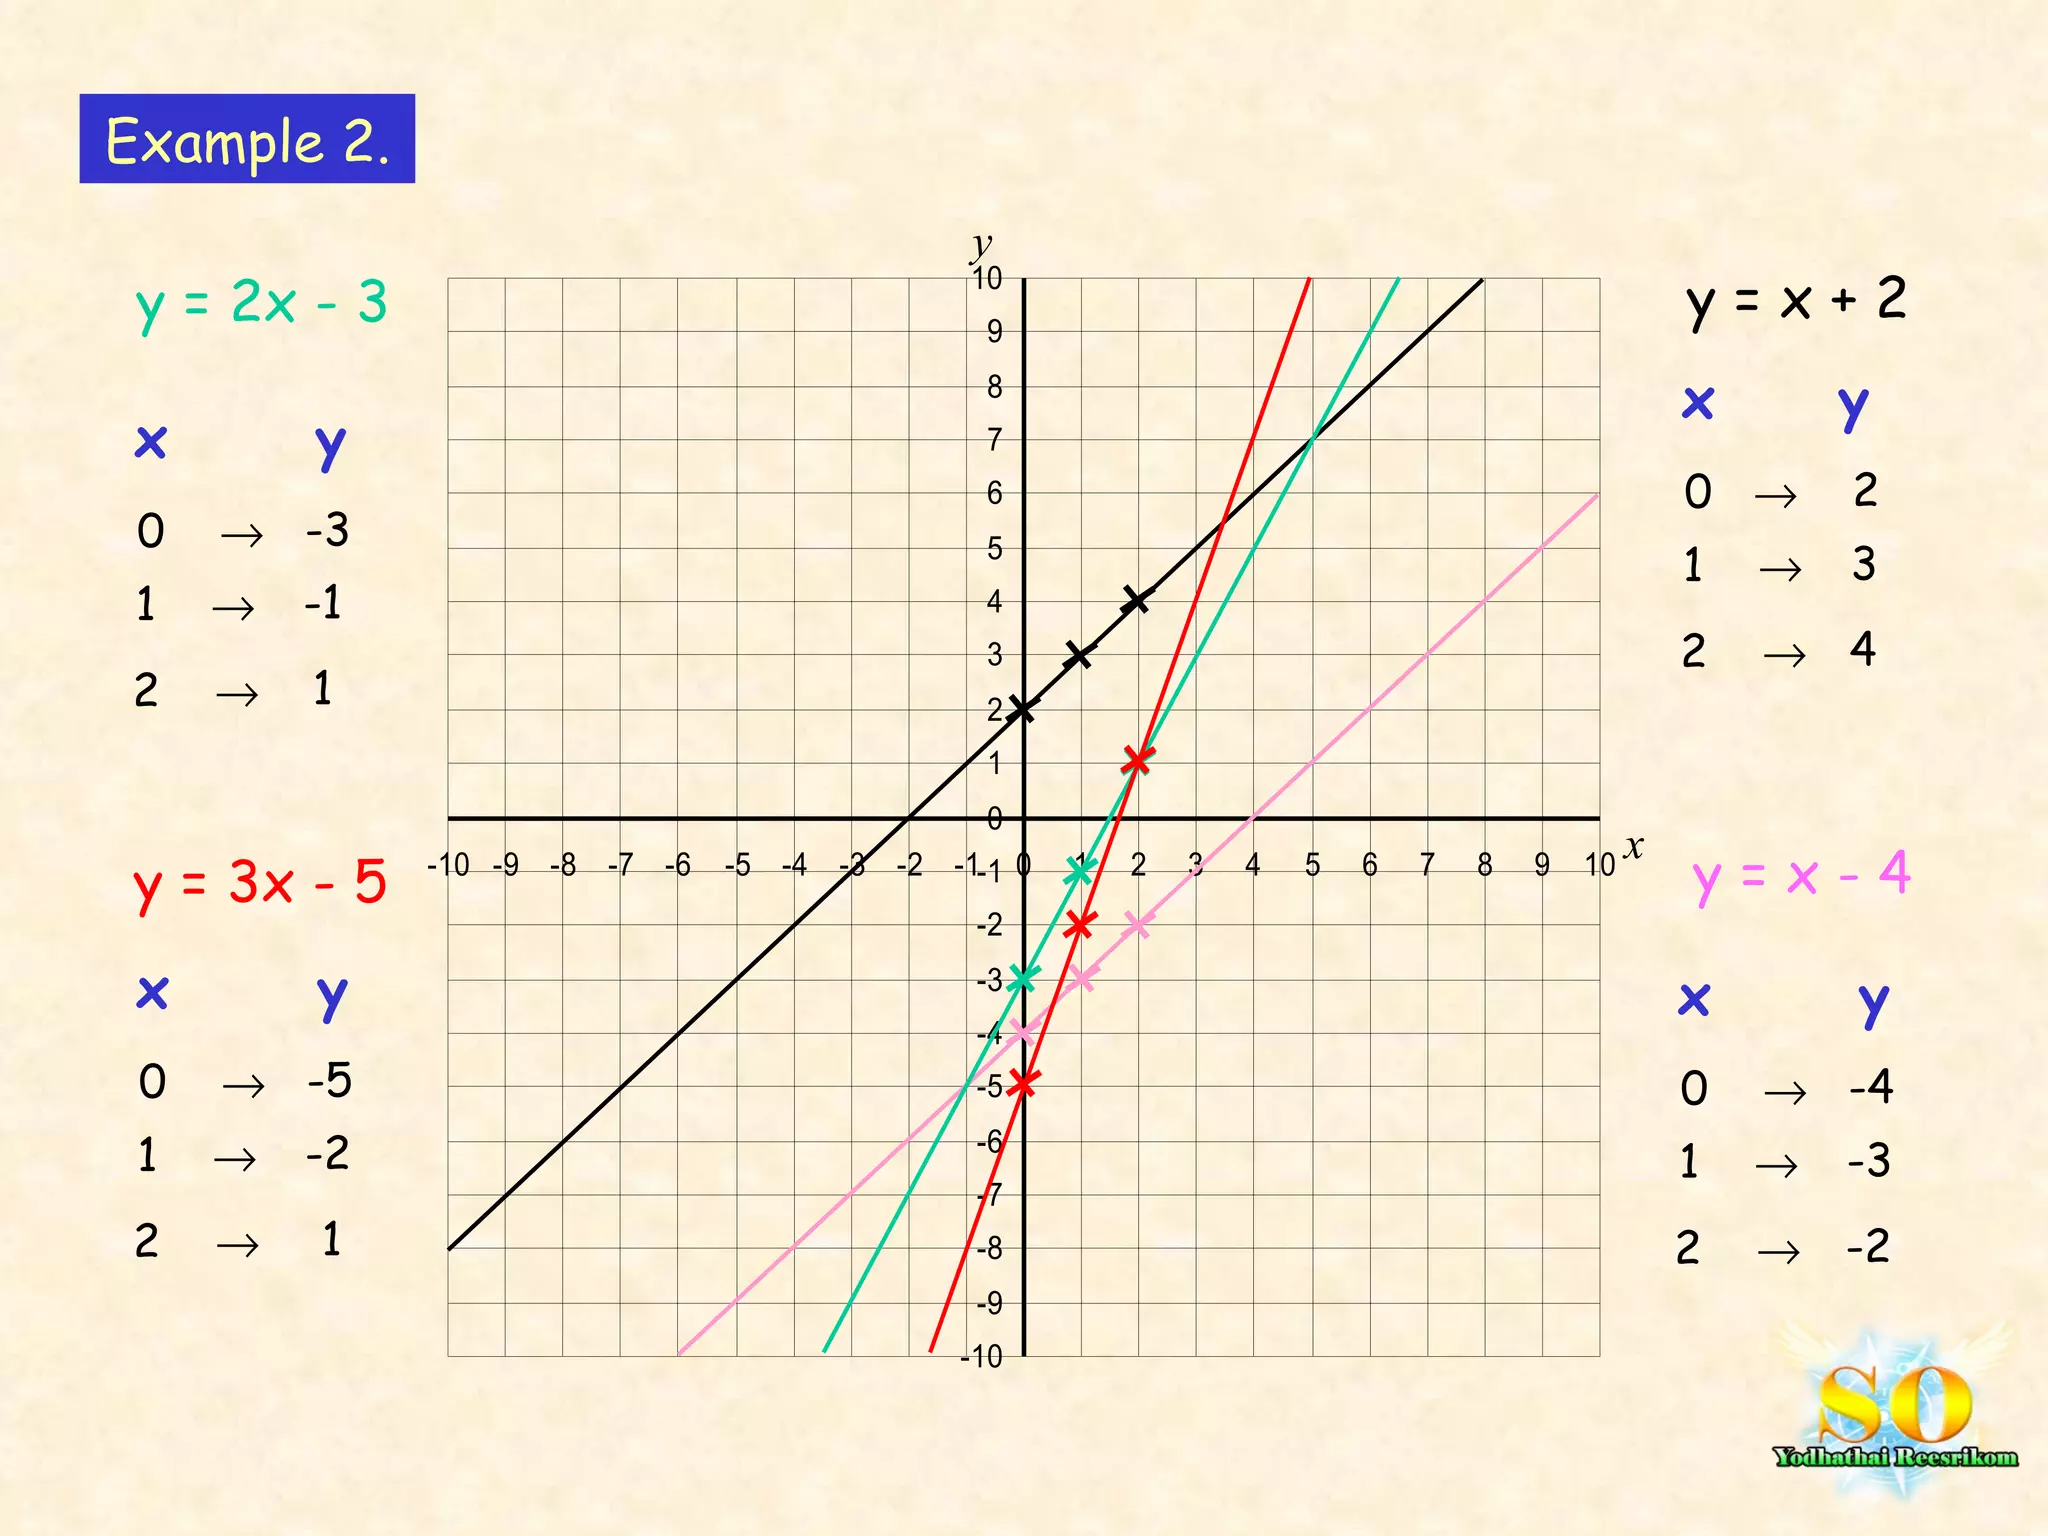
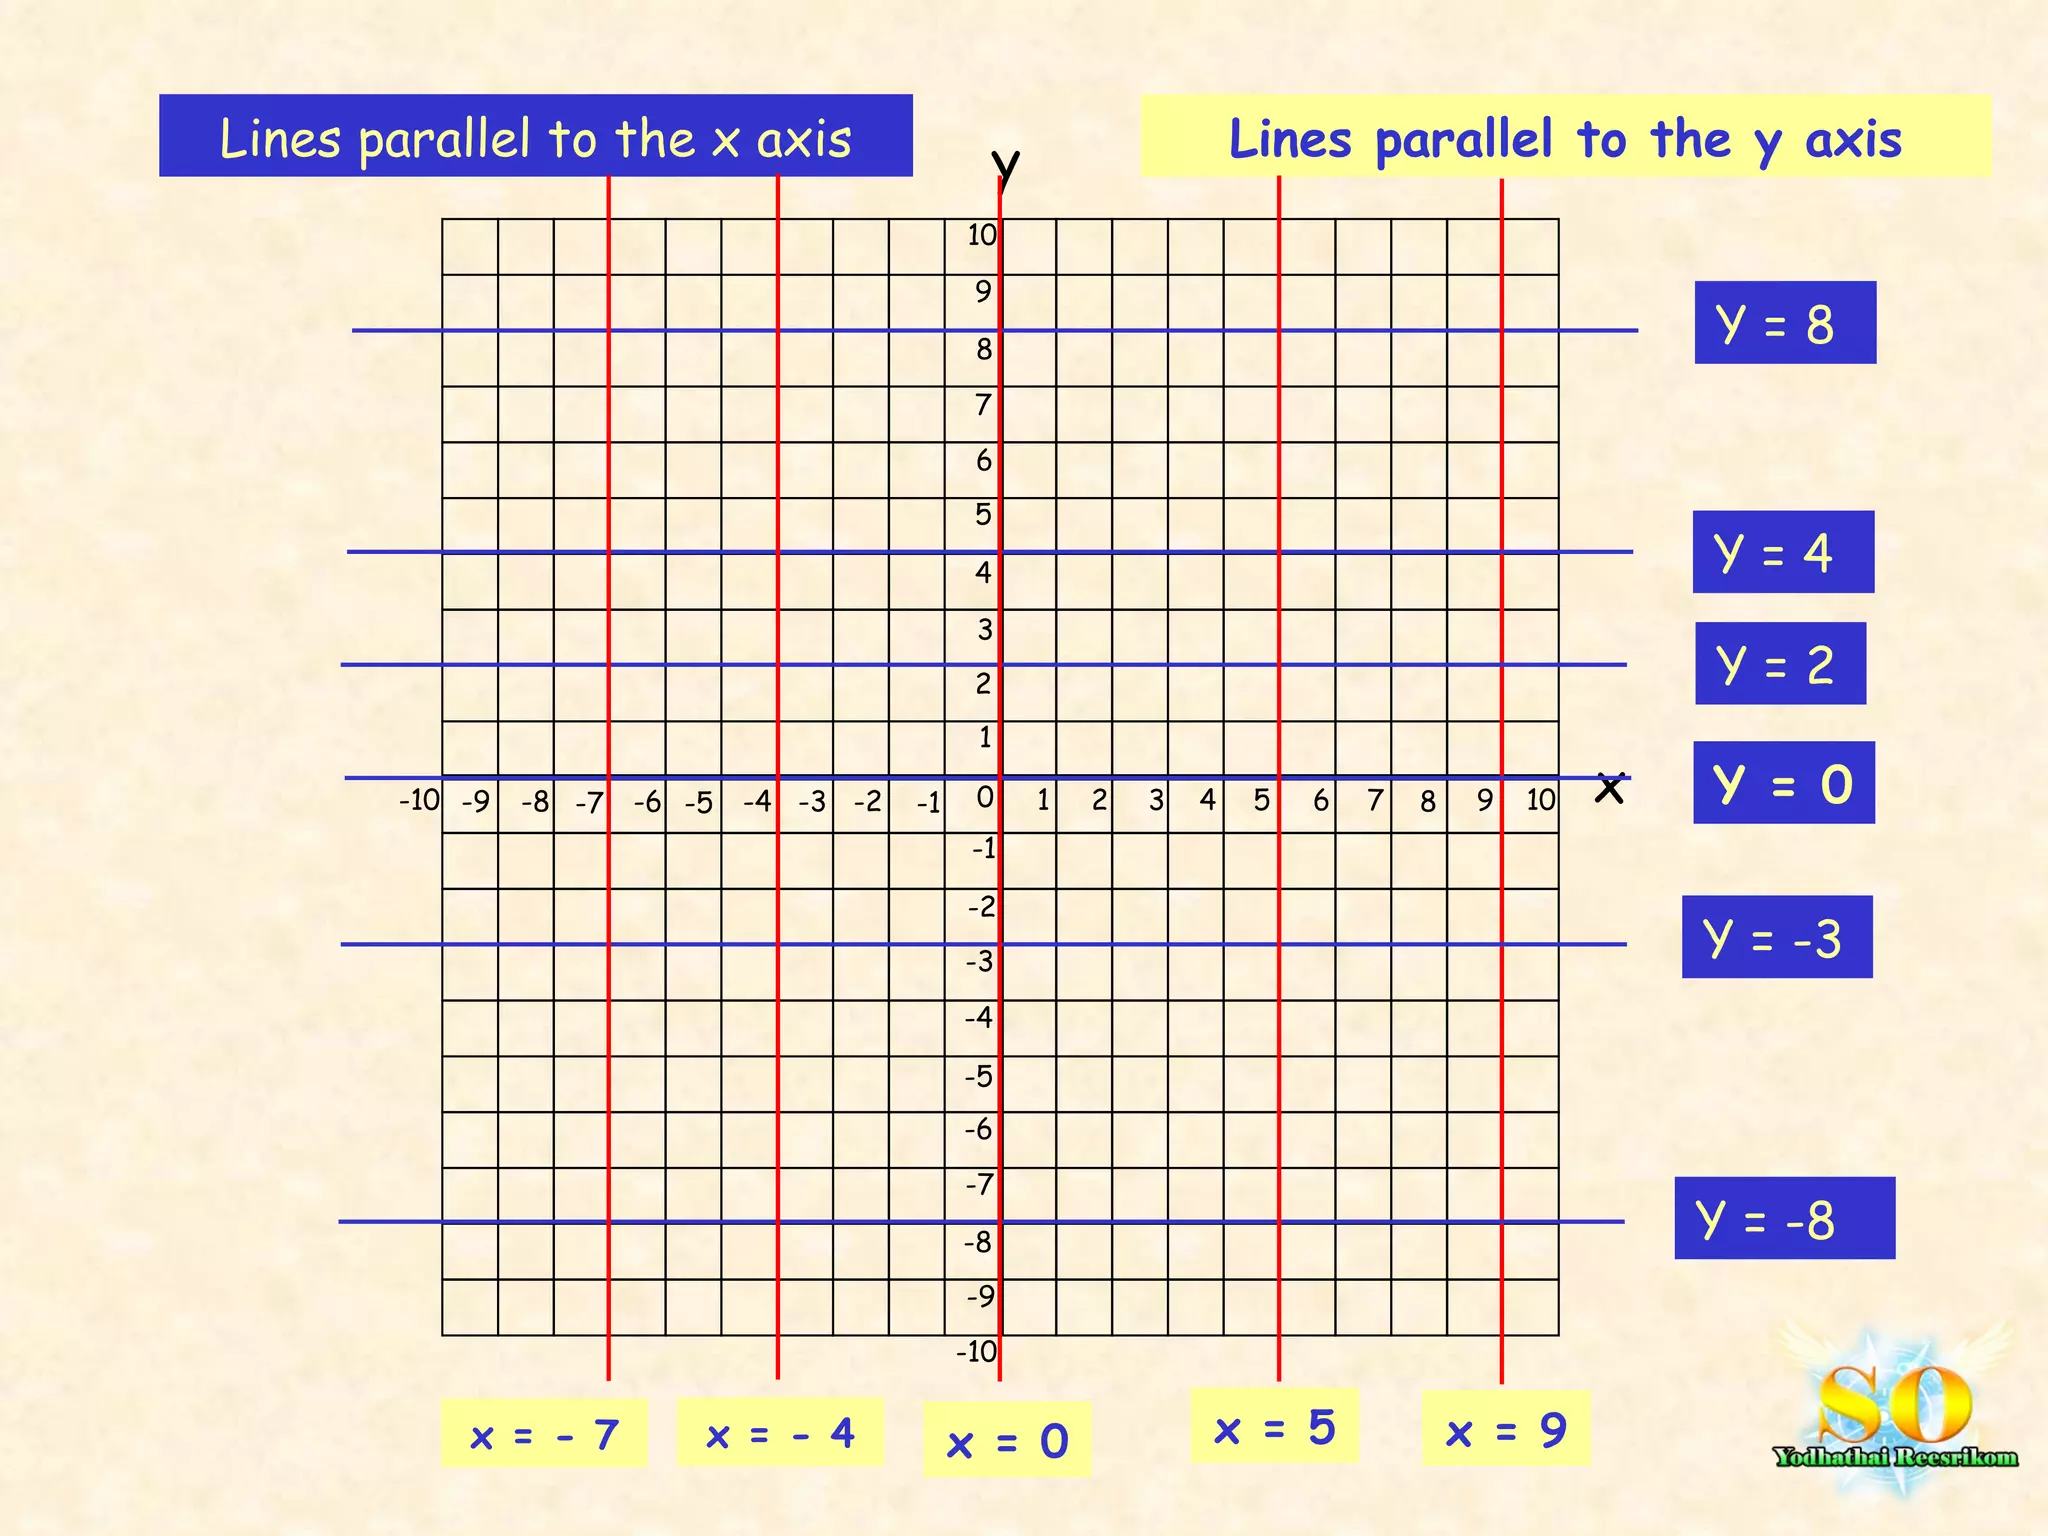
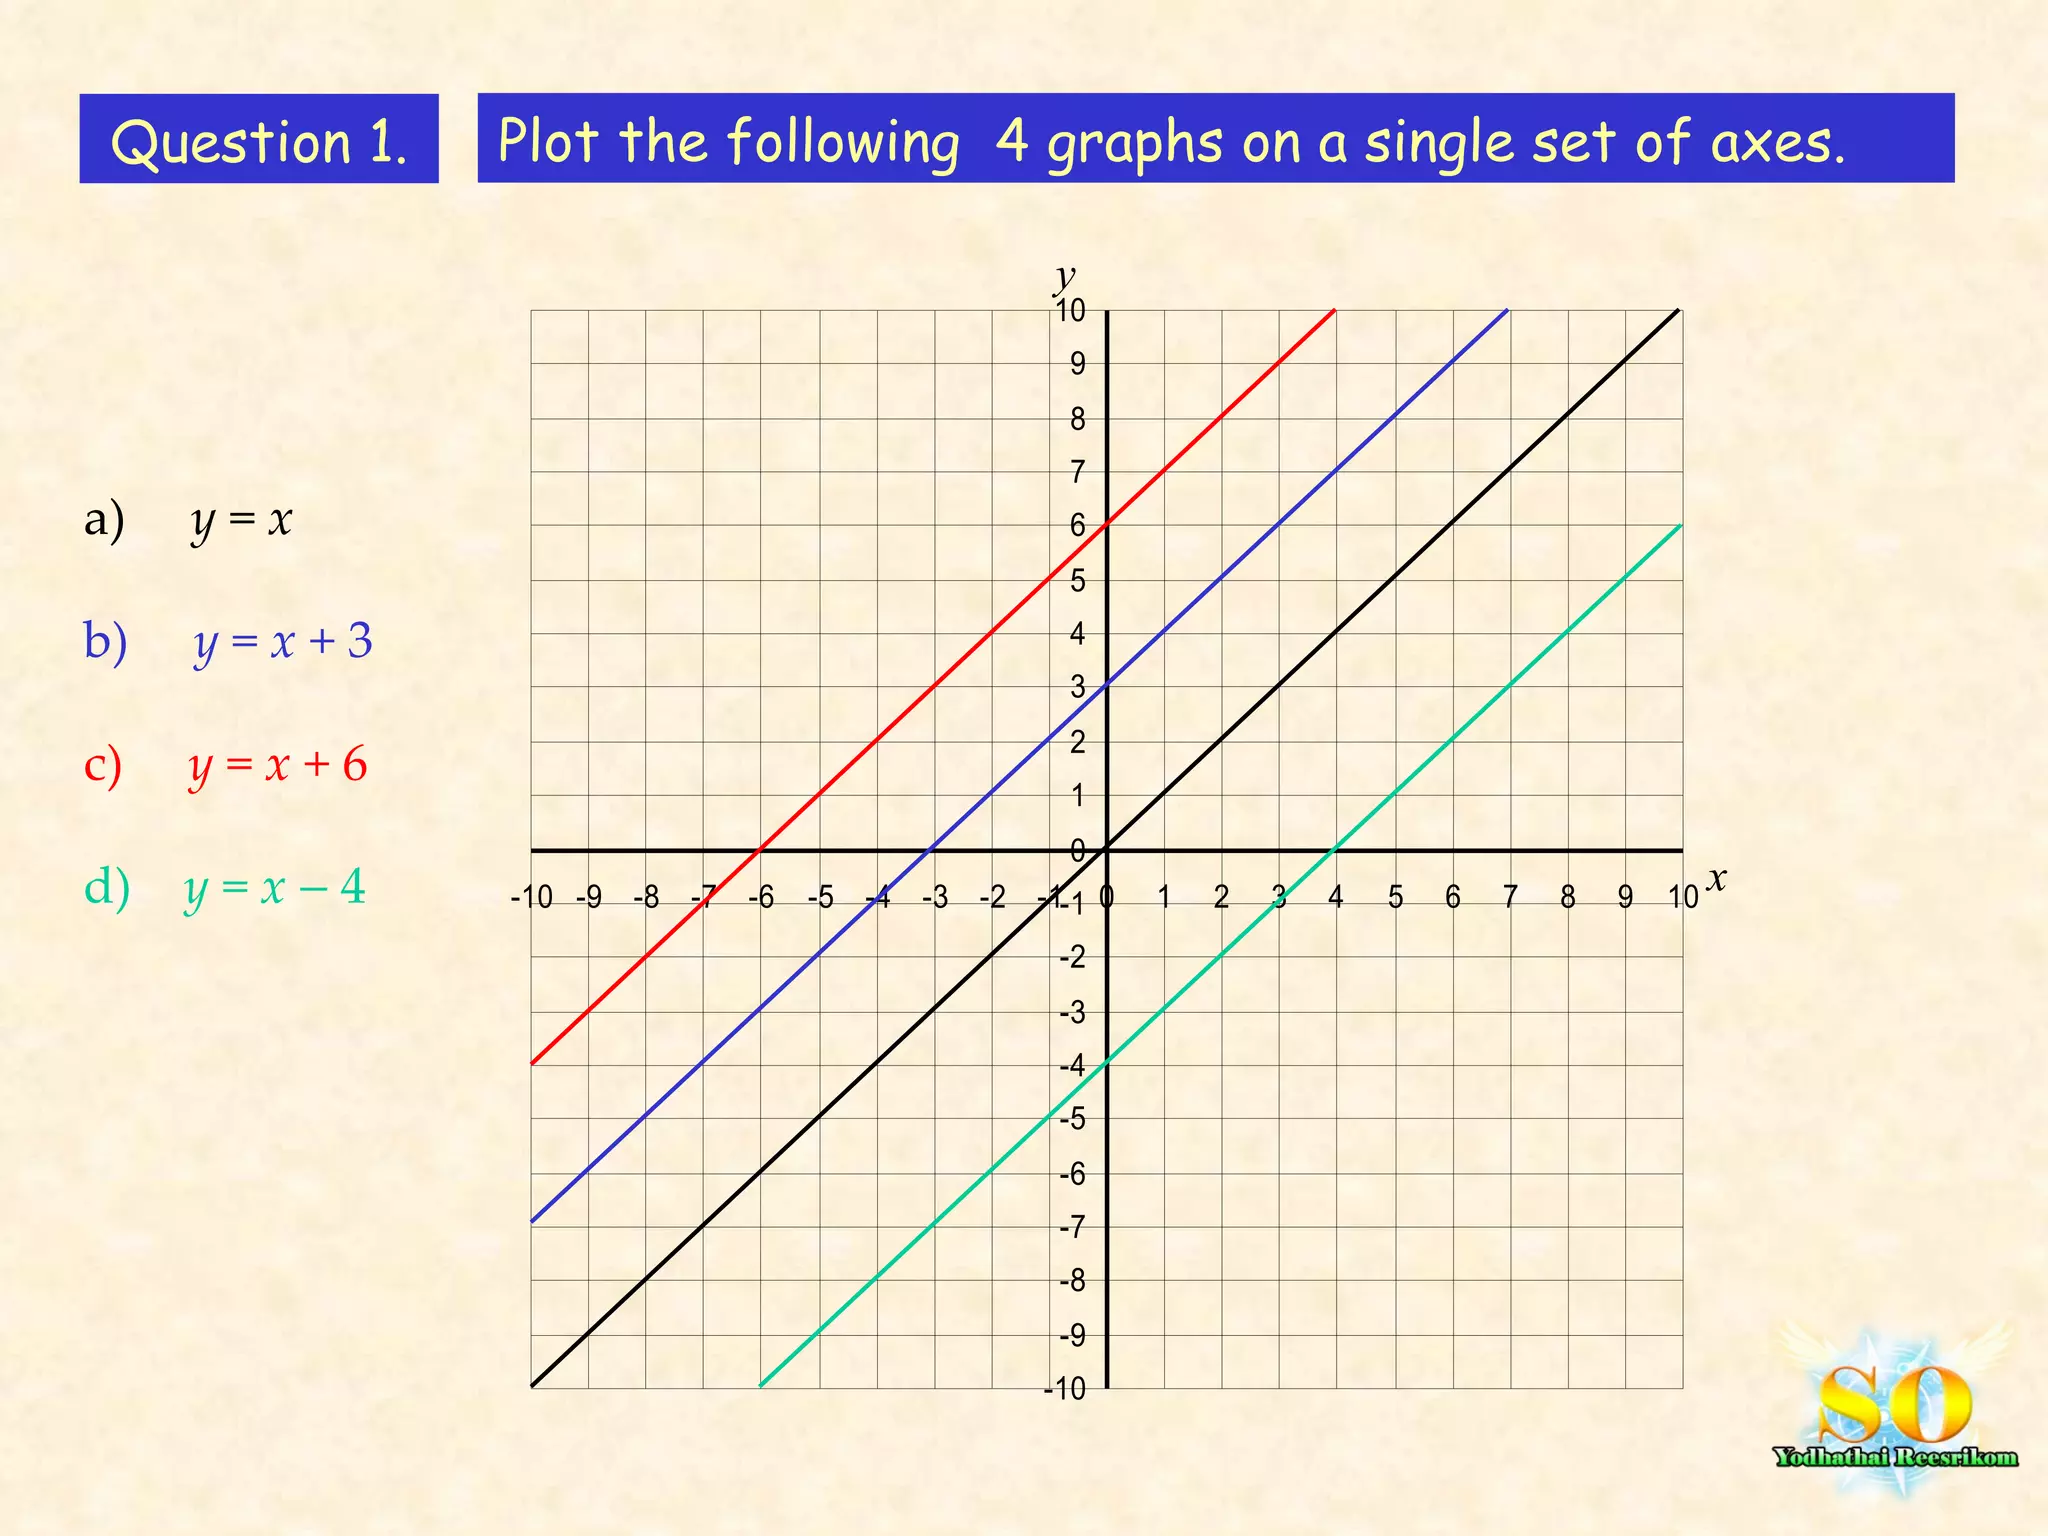
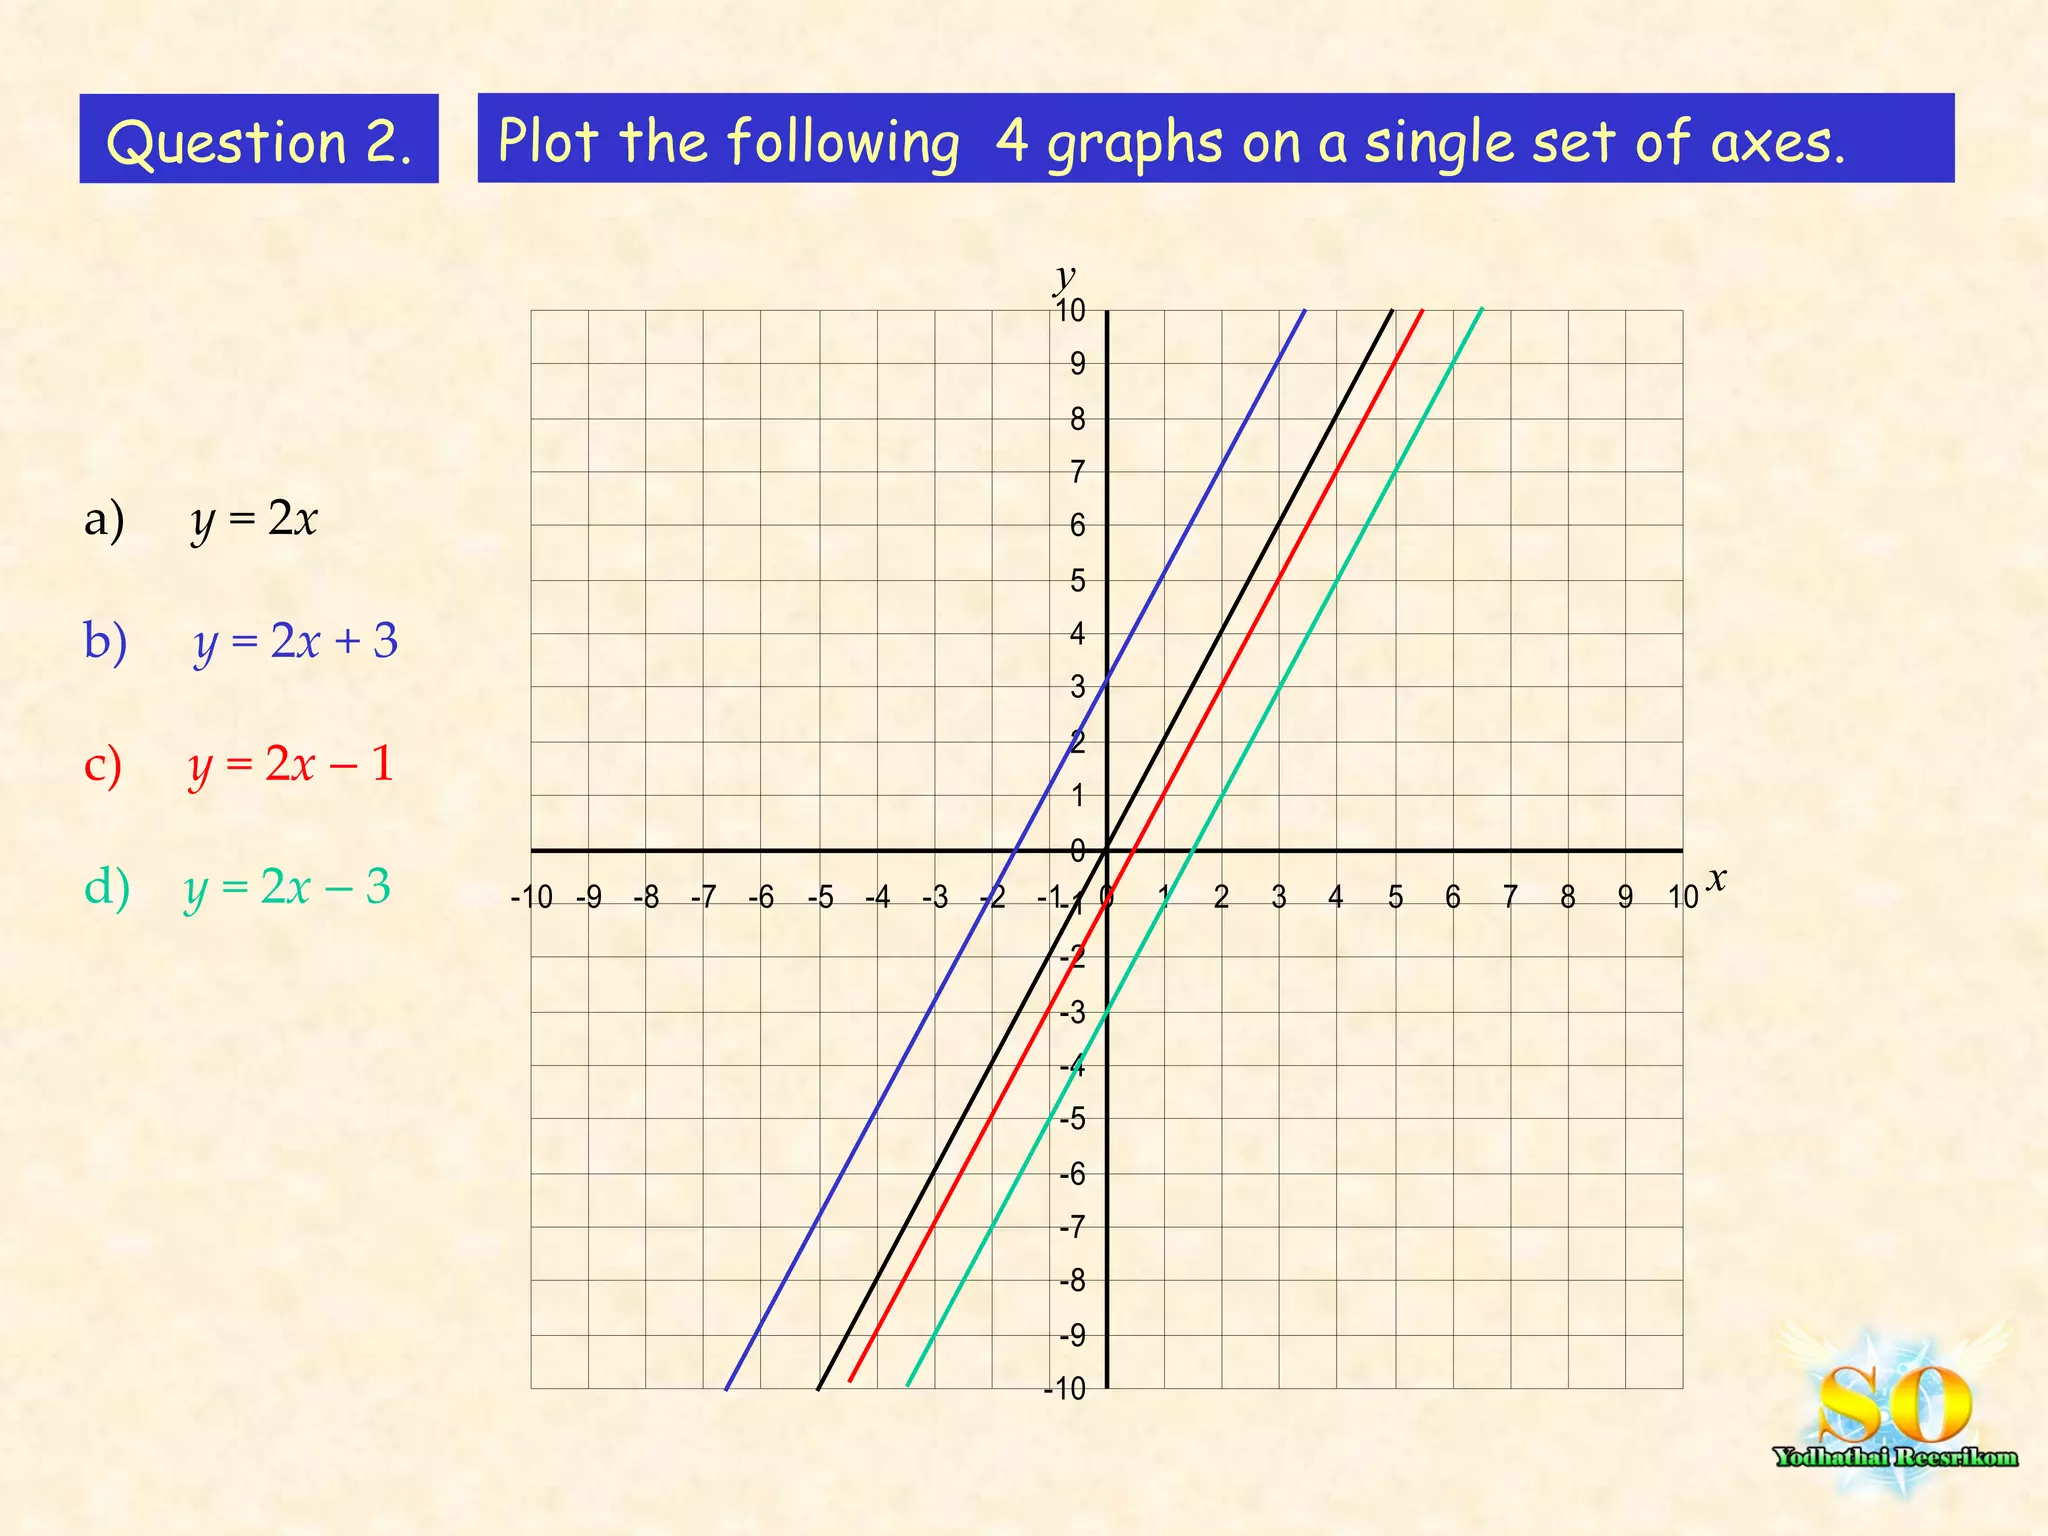
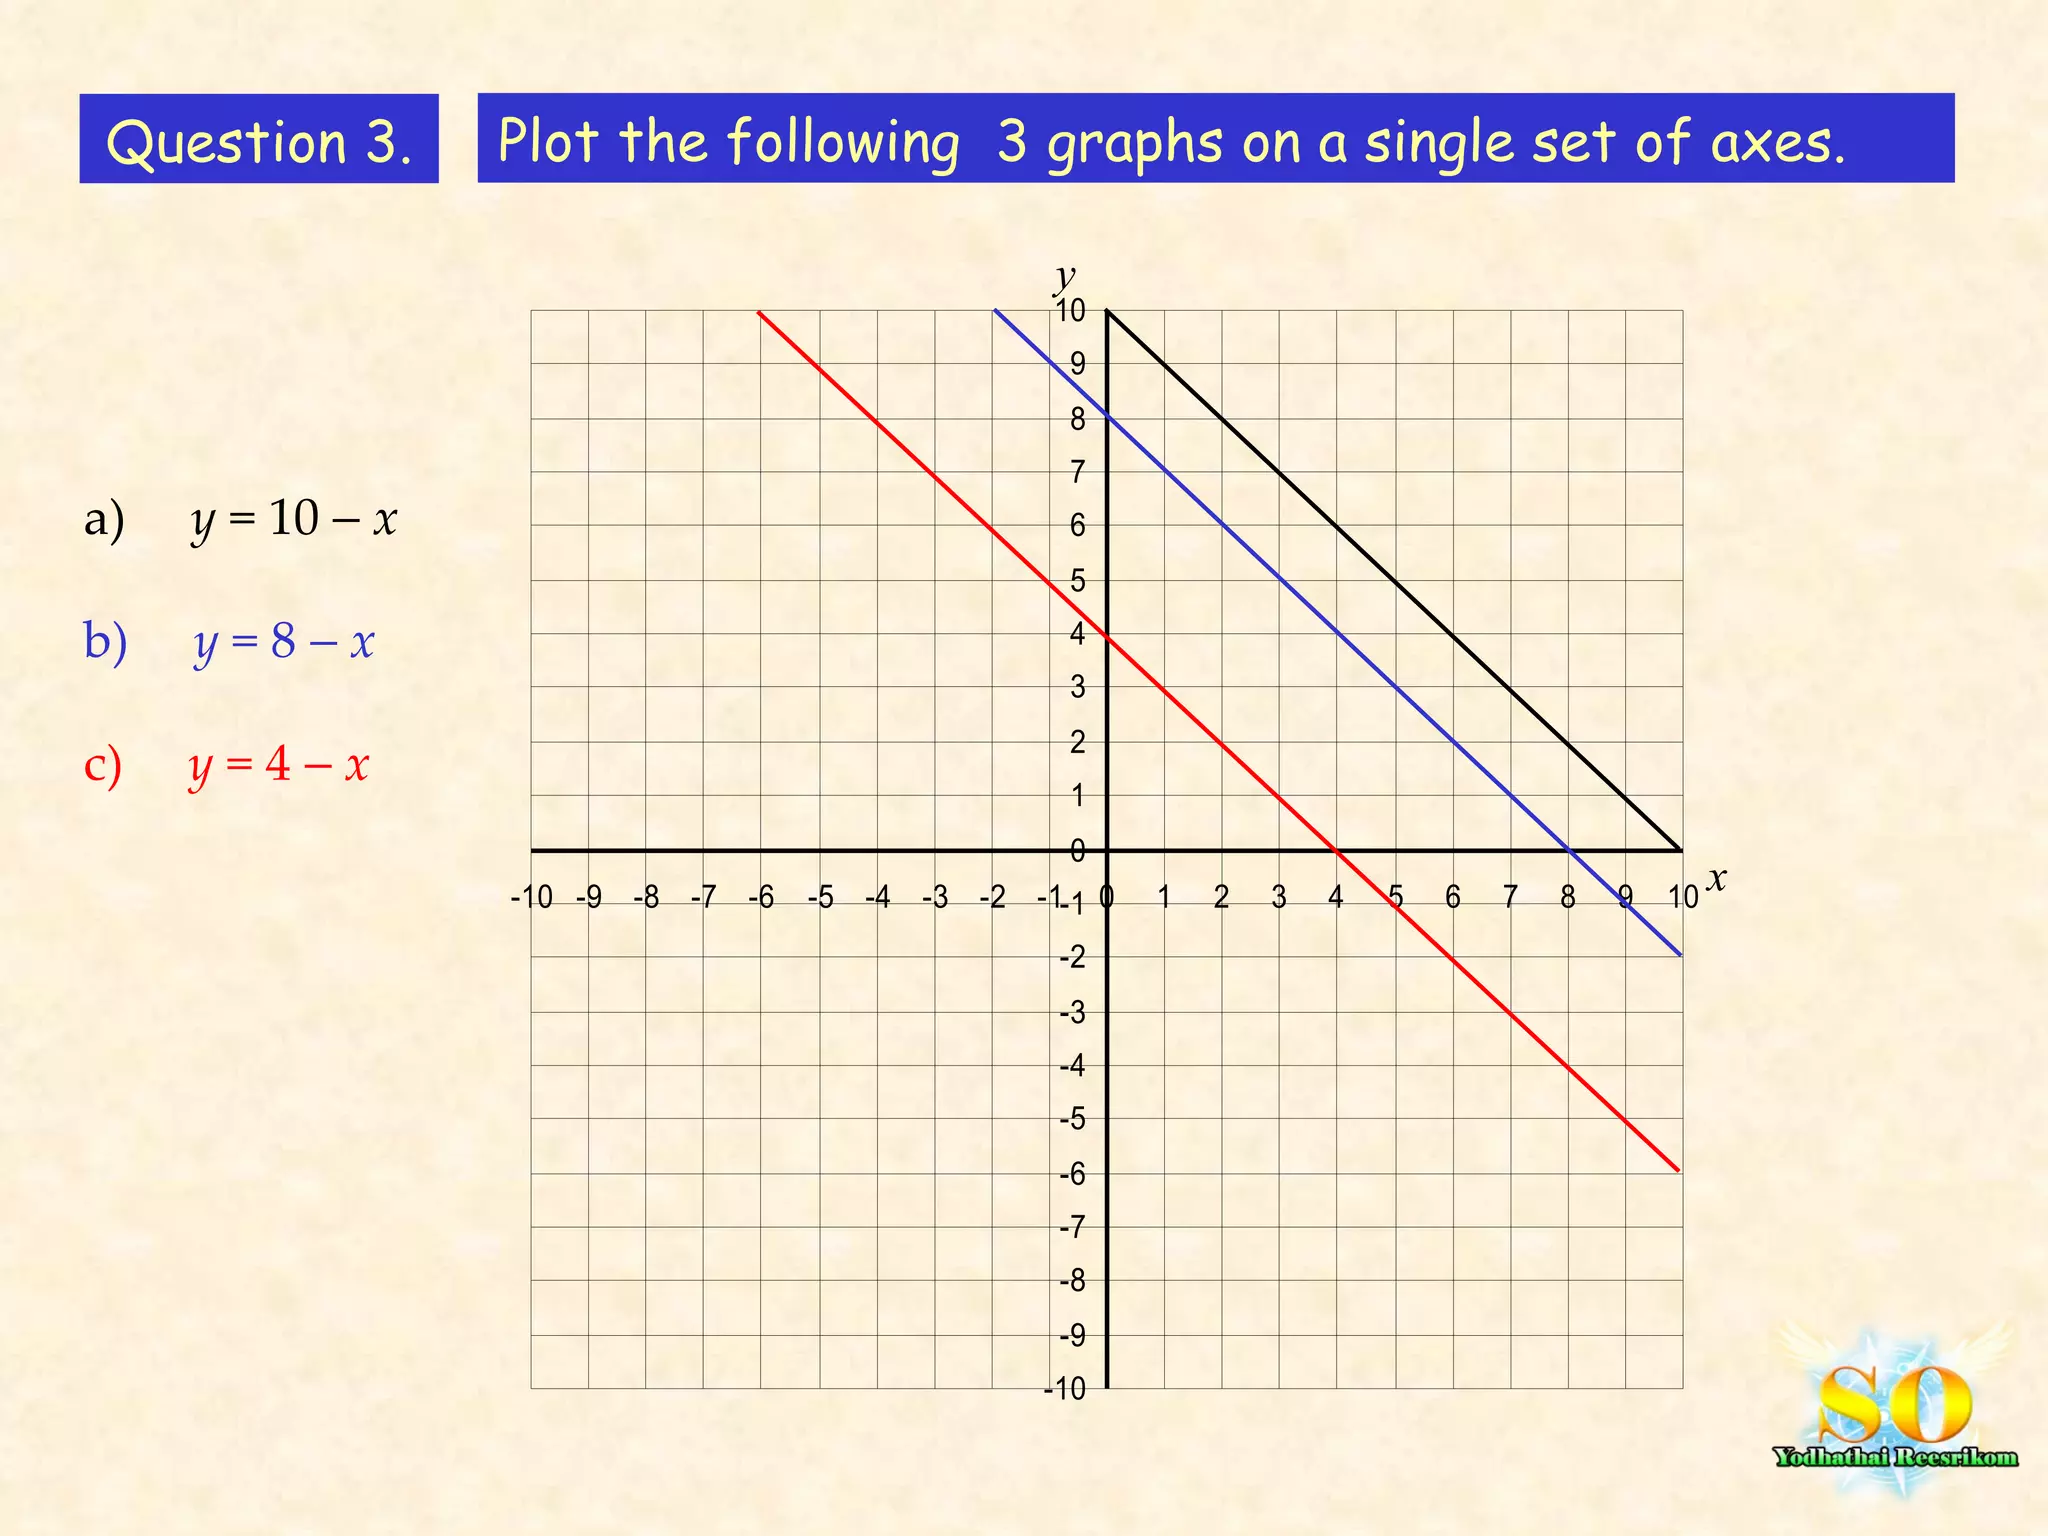
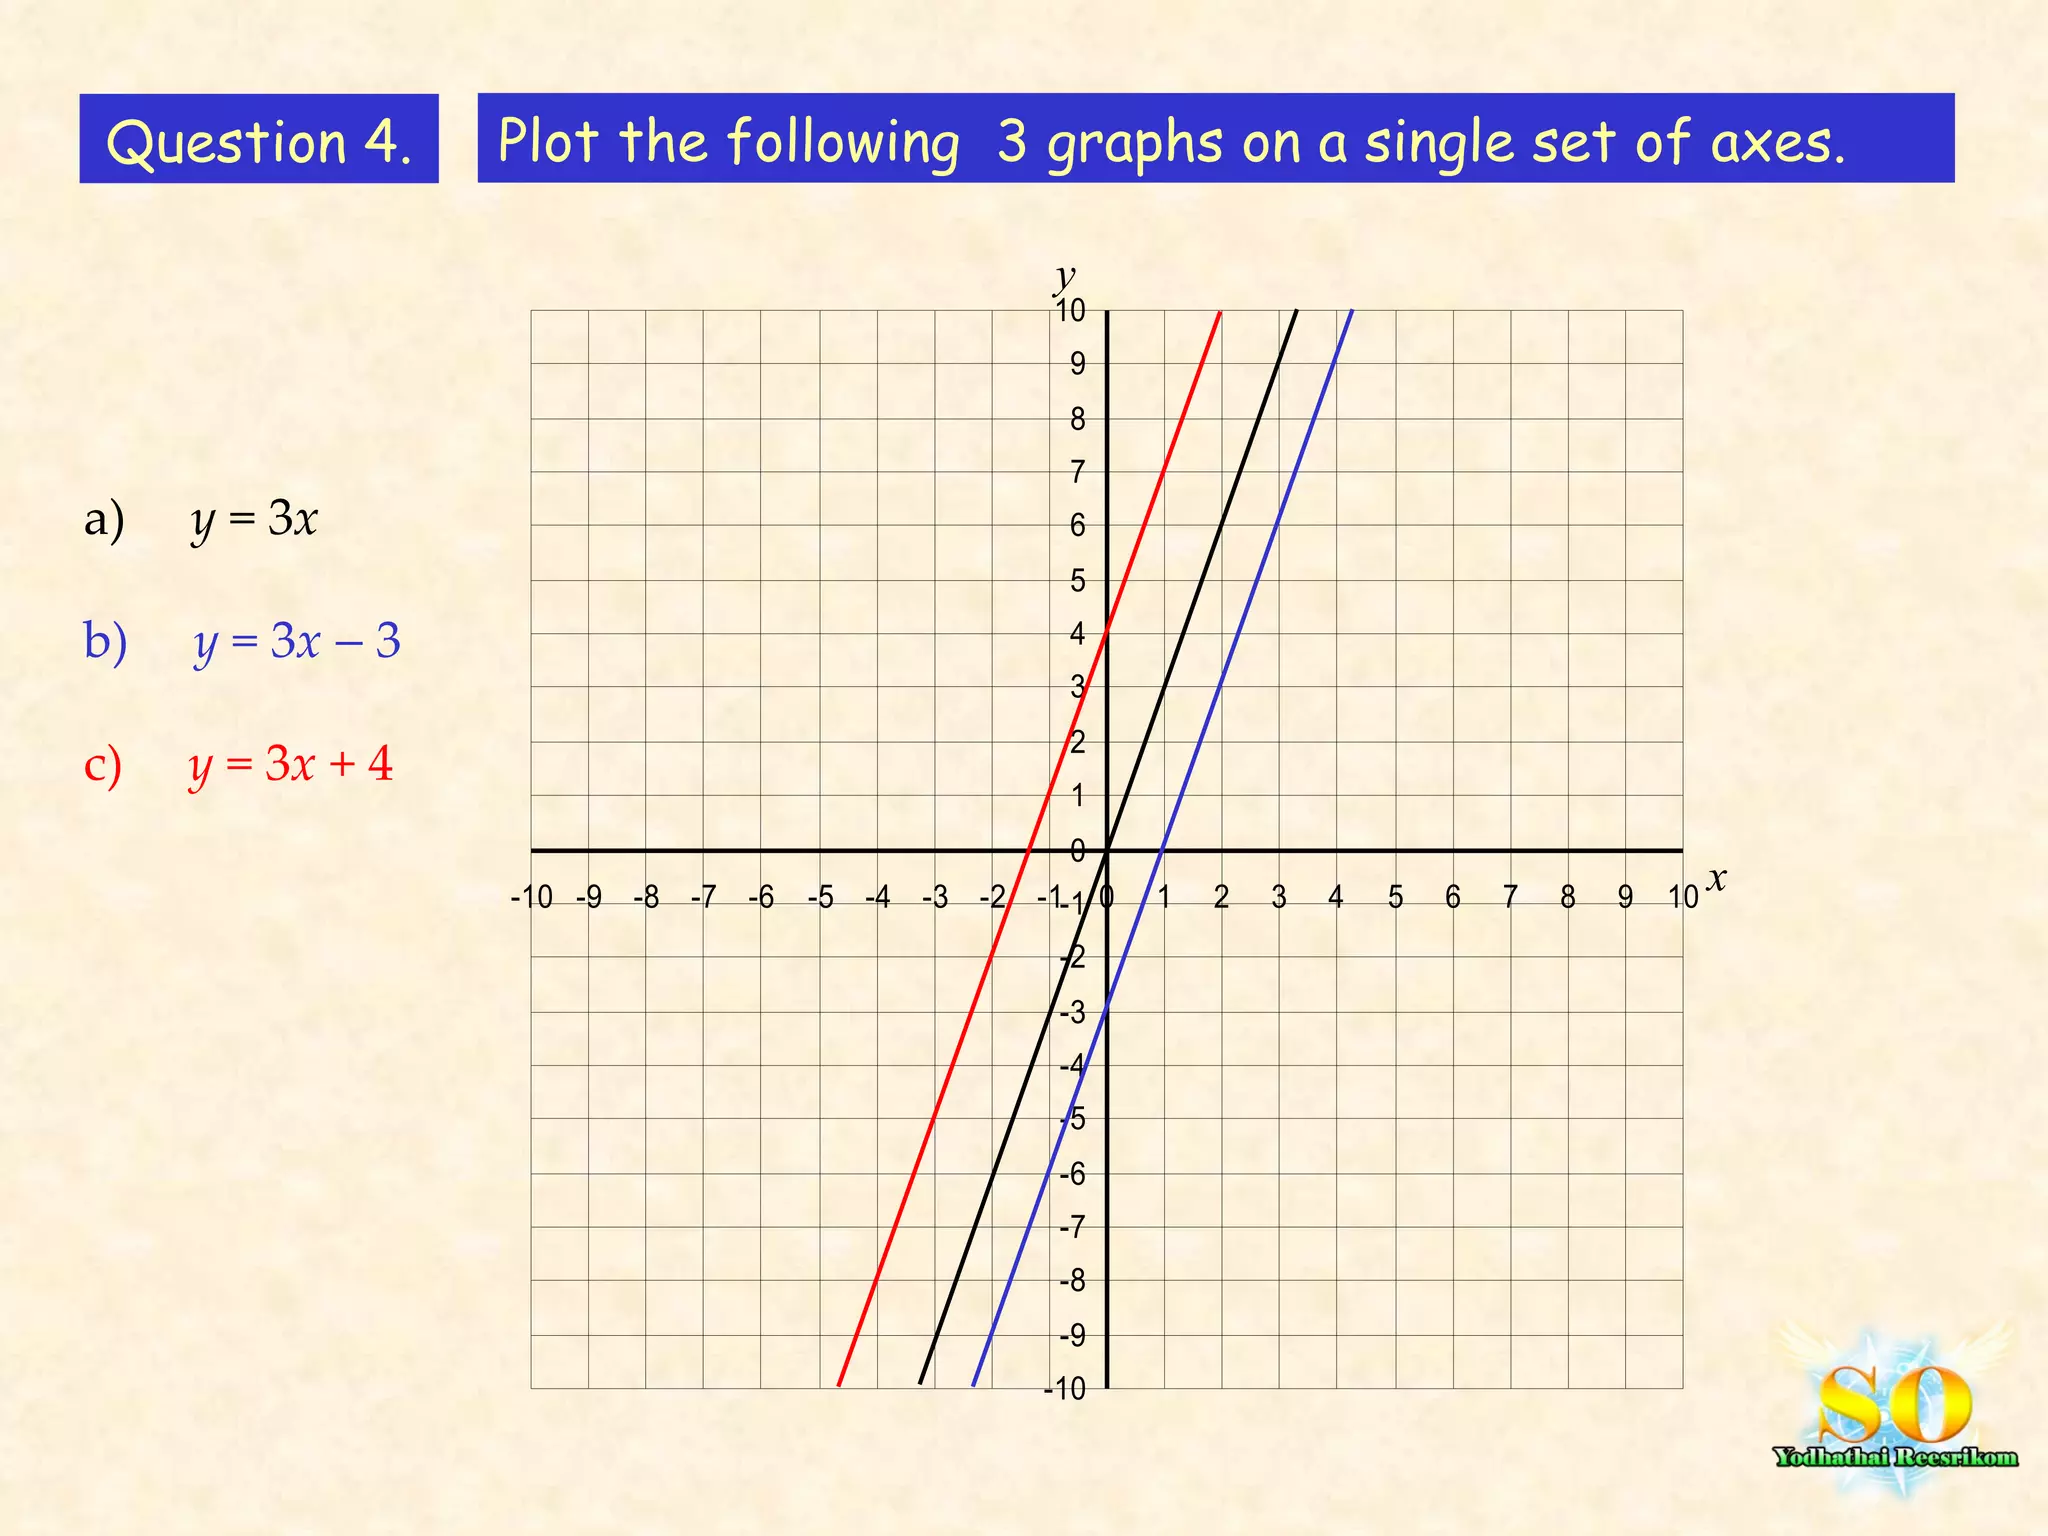
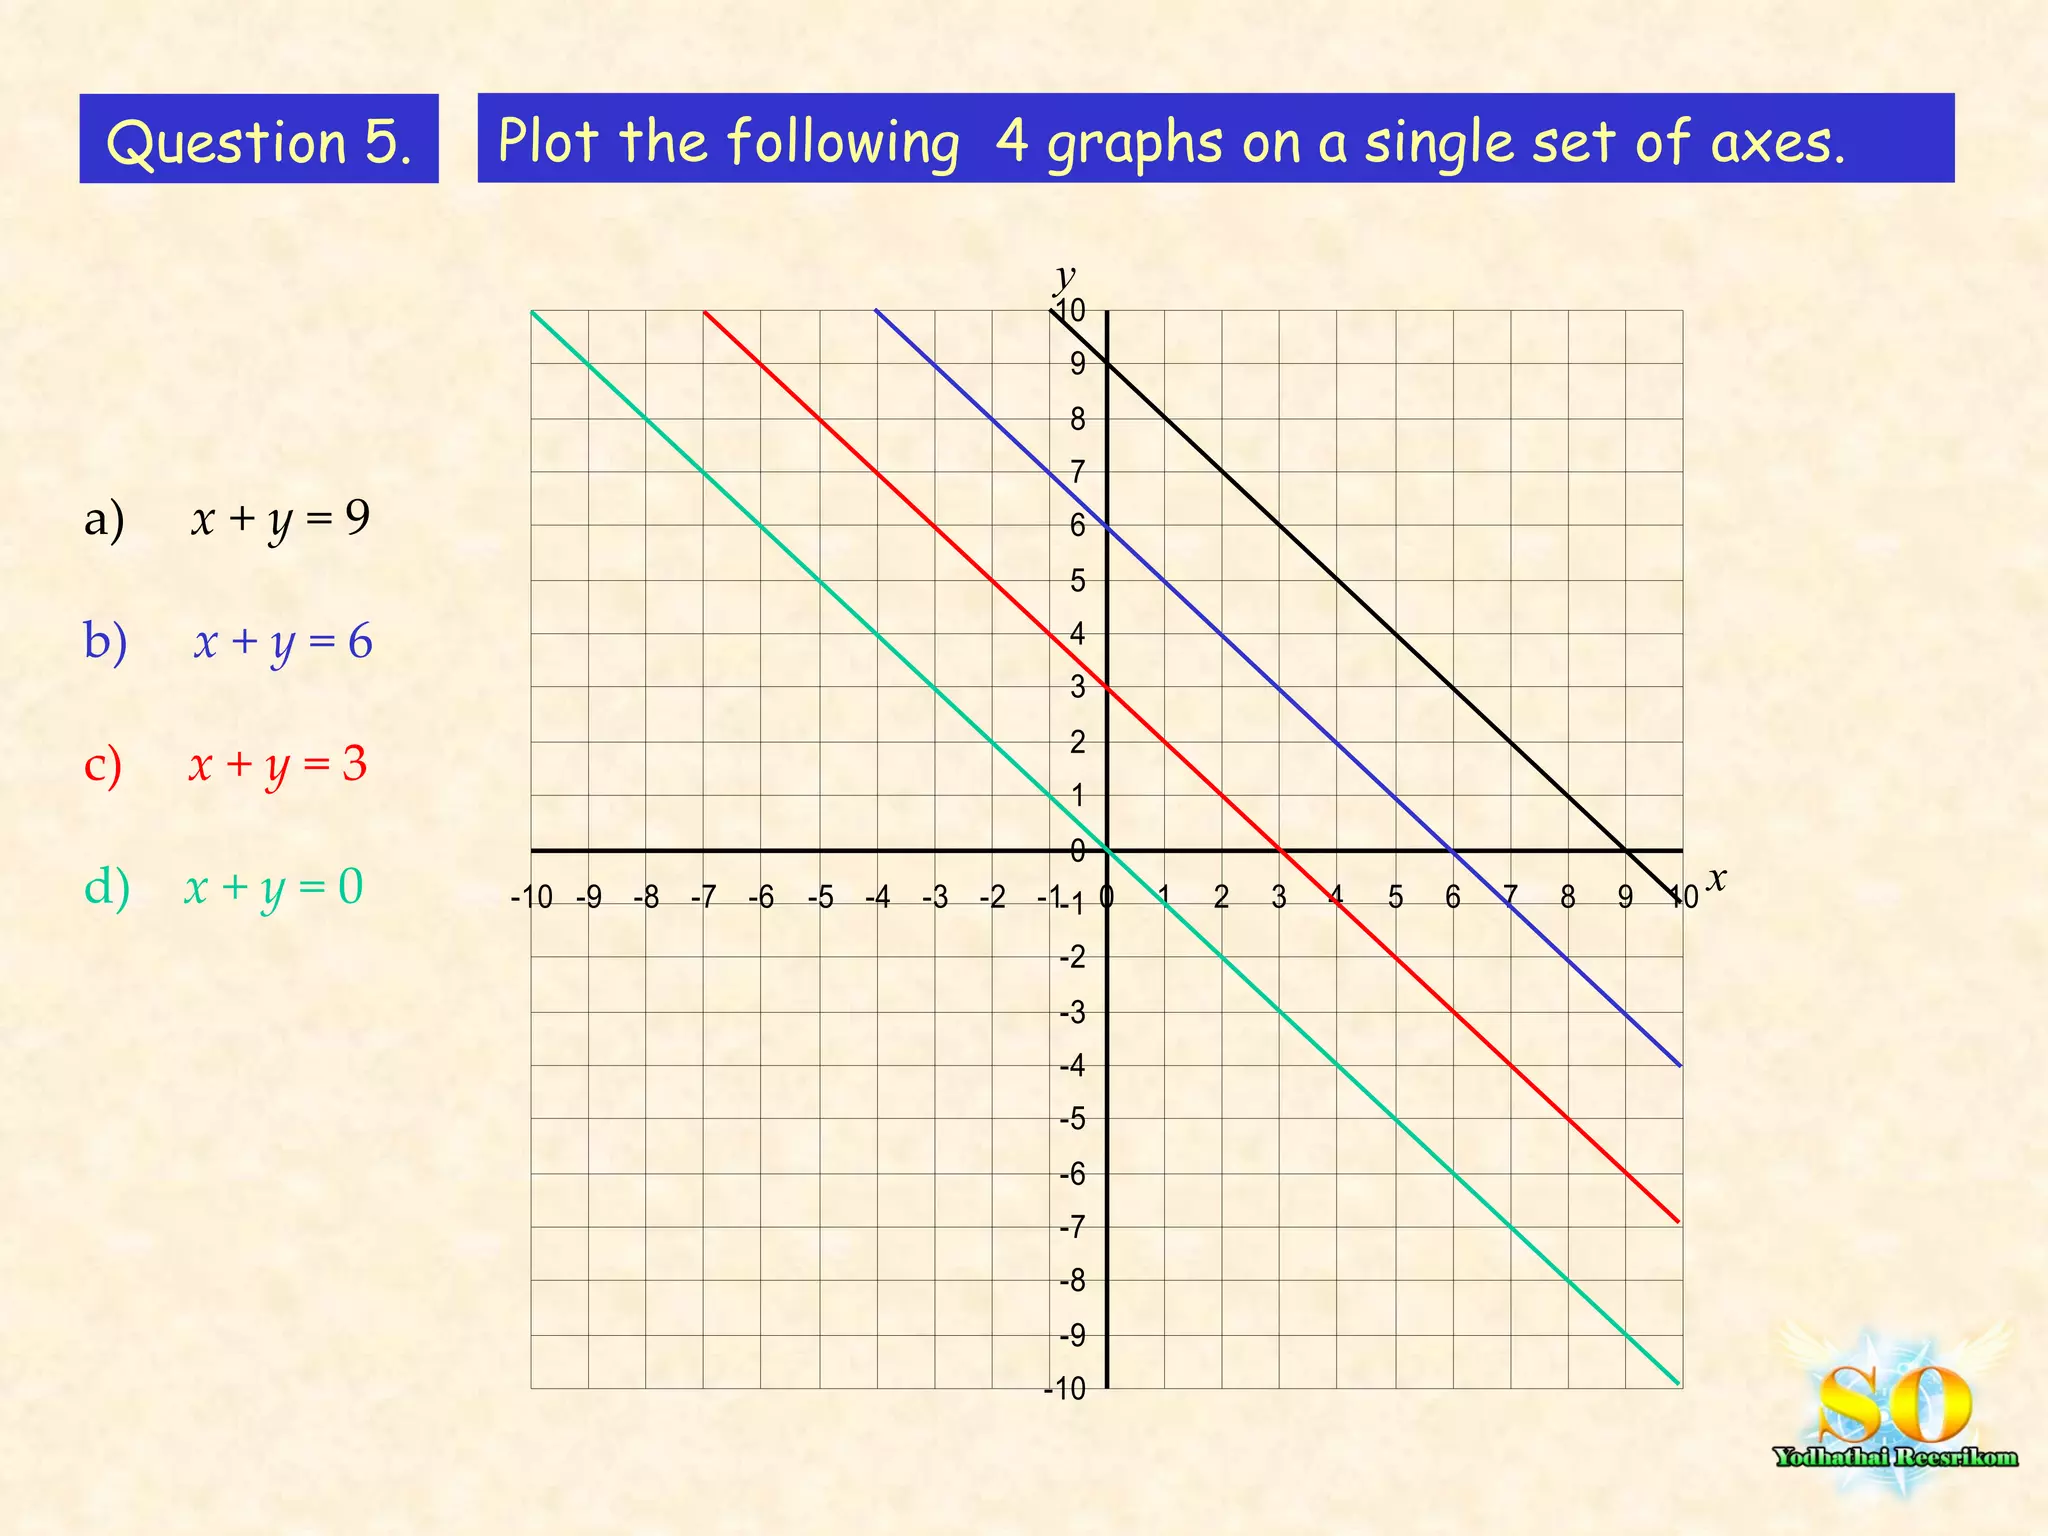
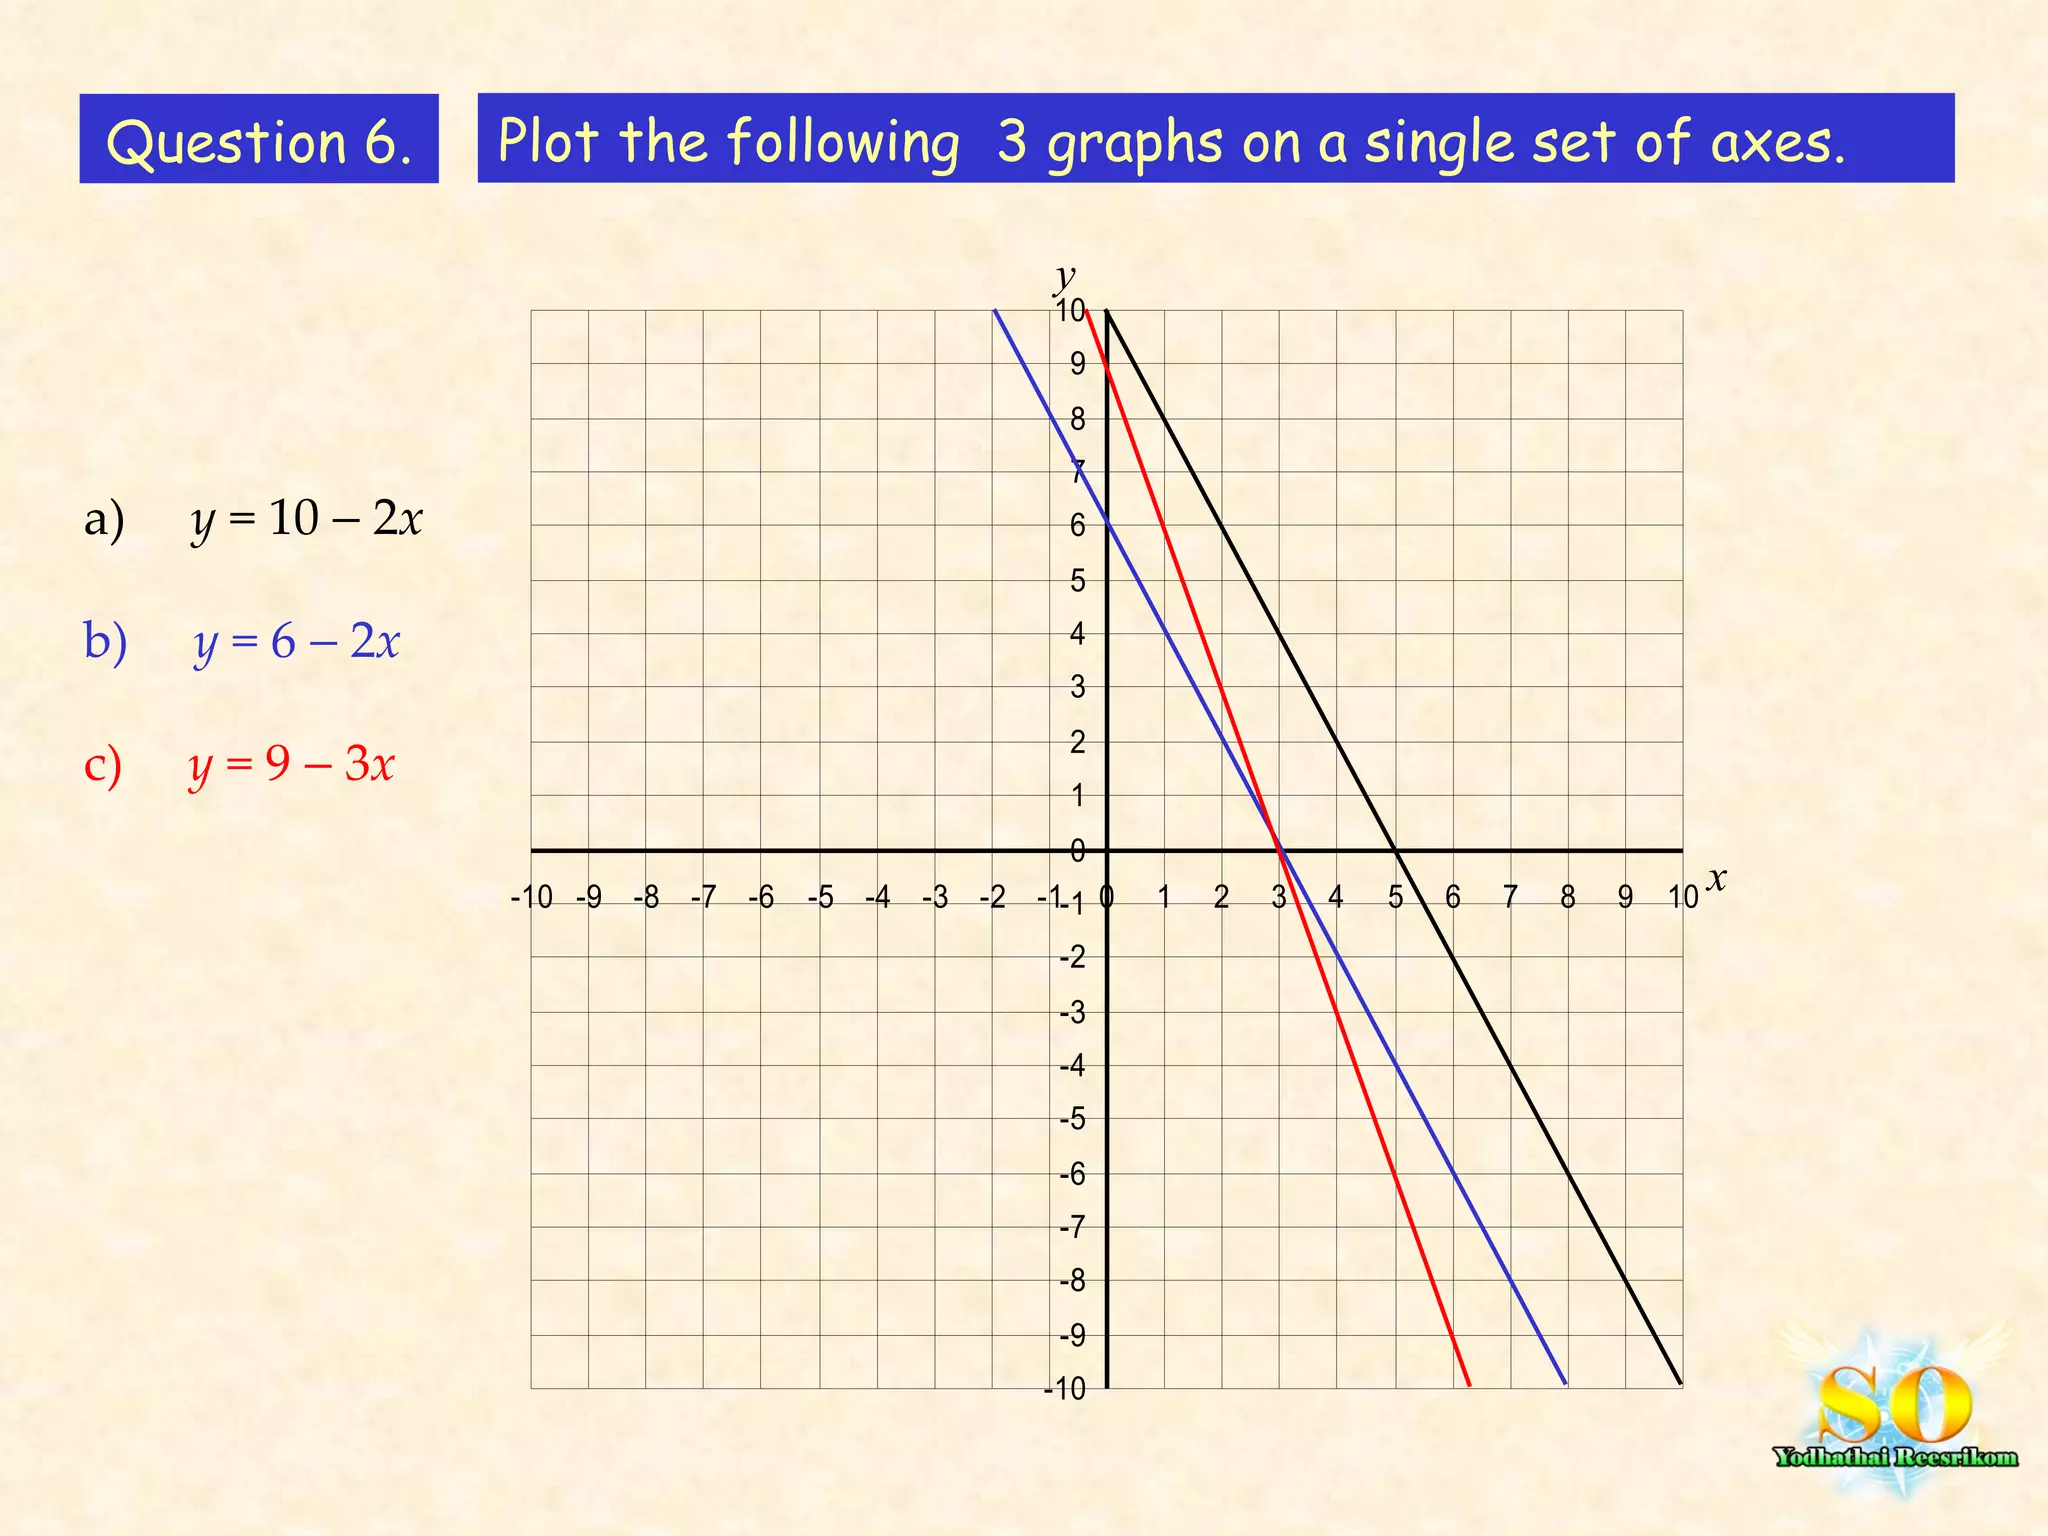
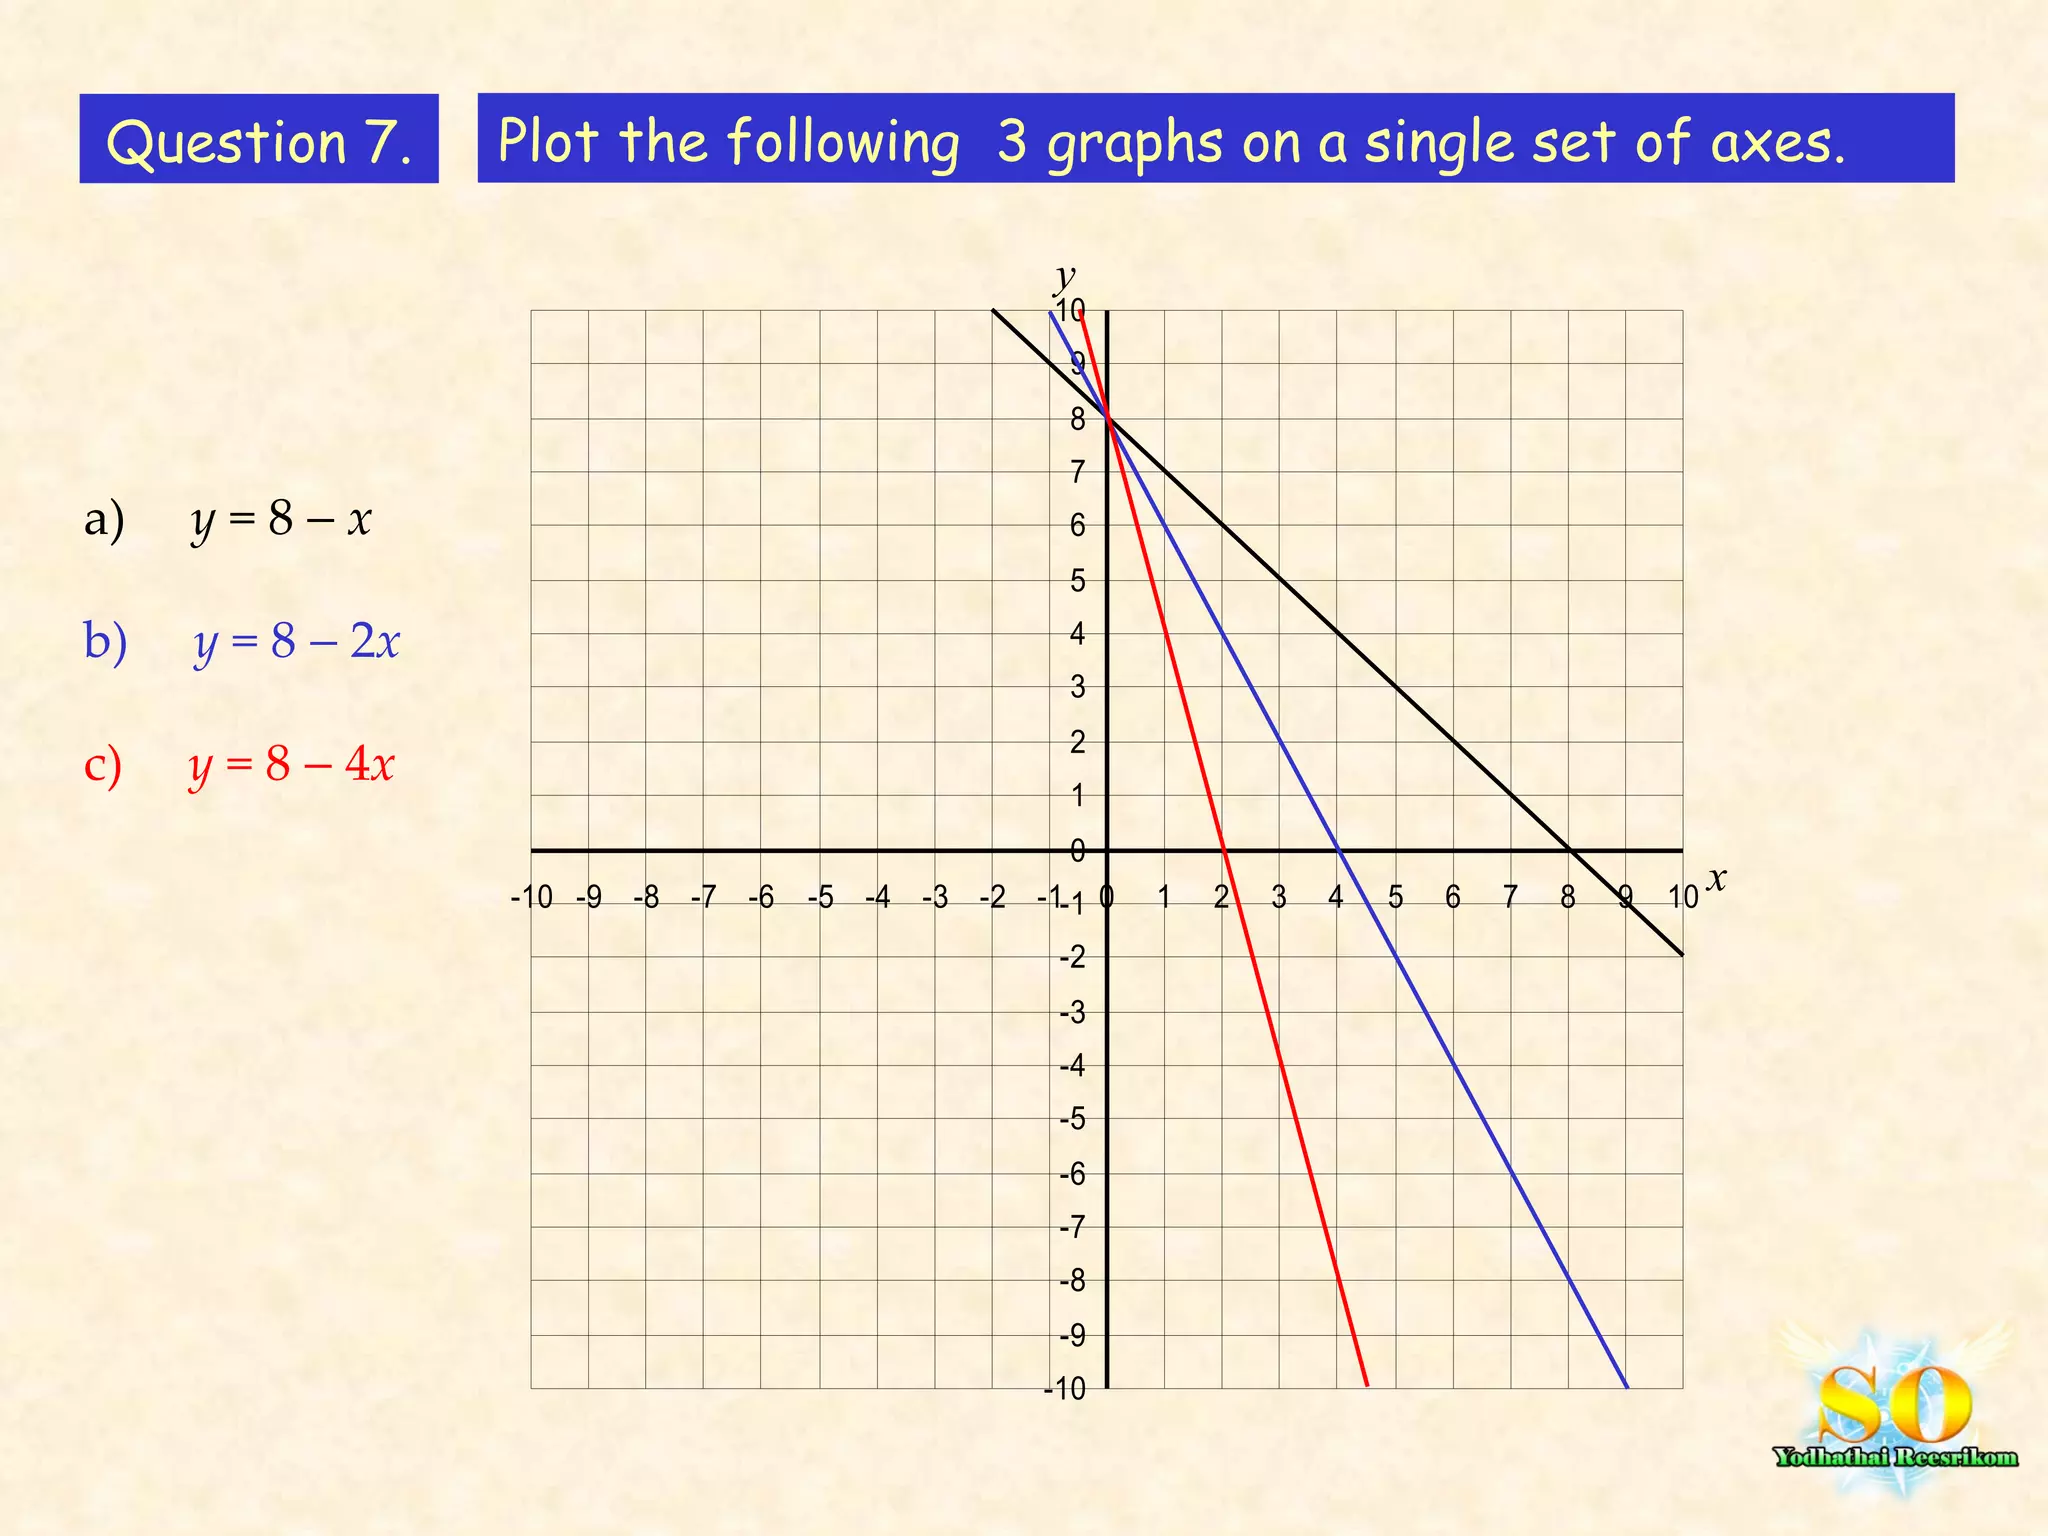

The document discusses using coordinate planes and axes to plot points and graphs. It explains that every point on a coordinate plane has an x-coordinate and y-coordinate. Various examples are given of plotting lines defined by equations on the same set of axes, such as lines where x + y = a constant or y = mx + b. A series of questions are also provided asking to plot multiple graphs defined by equations on the same set of axes.