The document provides examples of graphing quadratic functions by:
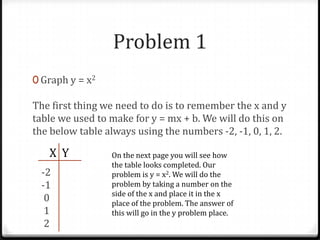
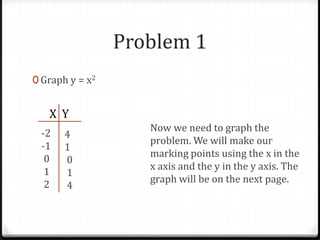
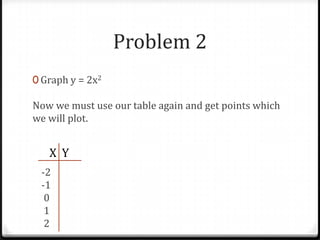
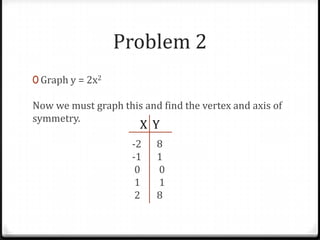
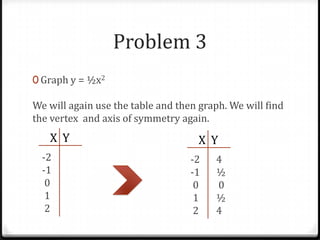
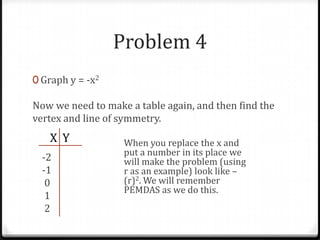
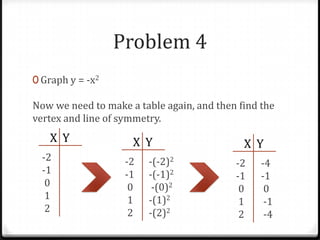
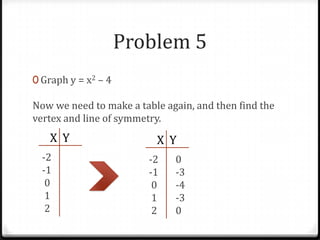
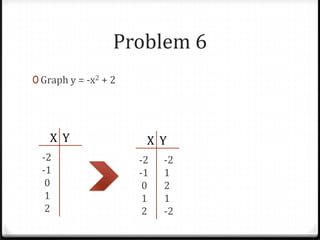
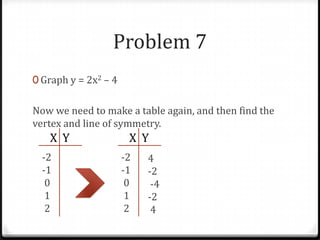
1) Creating an x-y table of values to plot points for functions like y=x^2, y=2x^2, y=-x^2, etc.
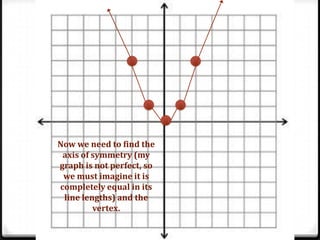
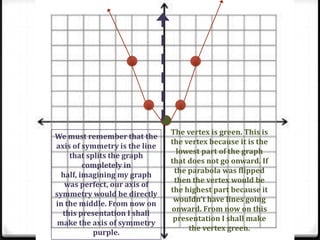
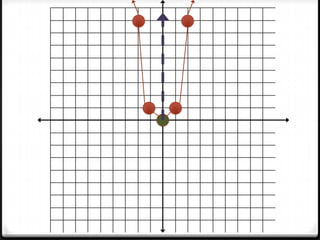
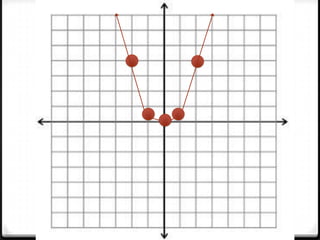
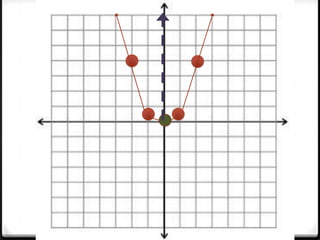
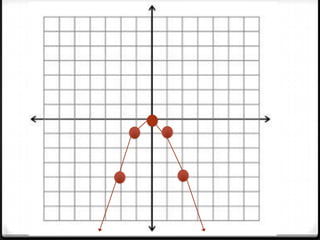
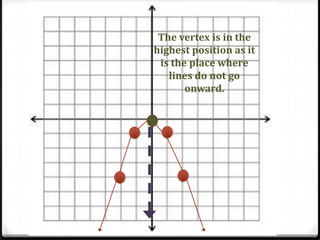
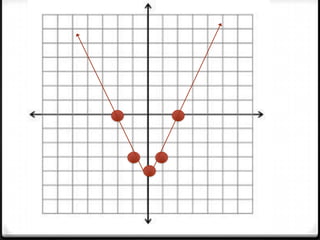
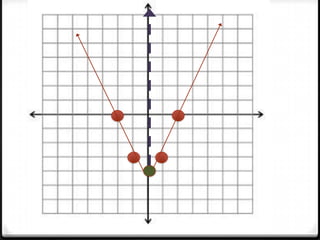
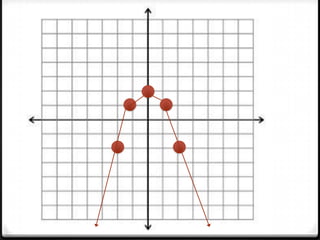
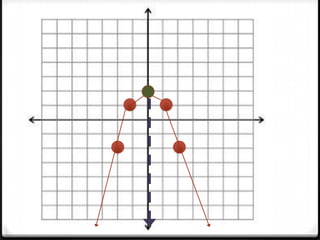
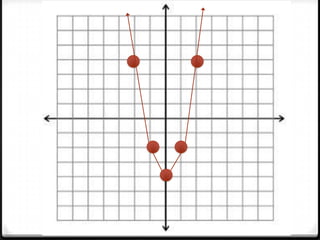
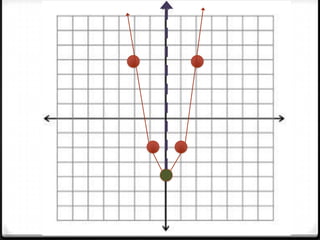
2) Plotting the points on a graph and identifying the vertex (lowest or highest point) and axis of symmetry (line splitting the graph in half).
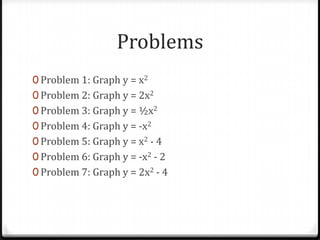
3) Working through examples like y=x^2, y=2x^2, y=1/2x^2, y=-x^2, y=x^2-4, y=-x^2-2, y=2x^2-4 to demonstrate how to graph