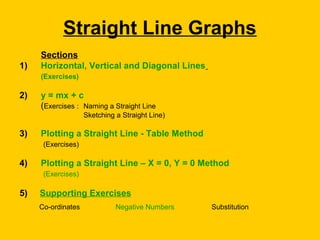
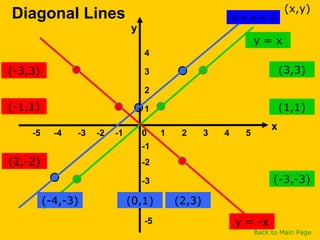
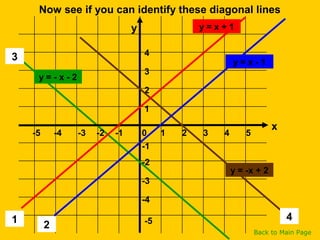
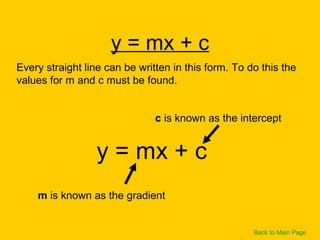
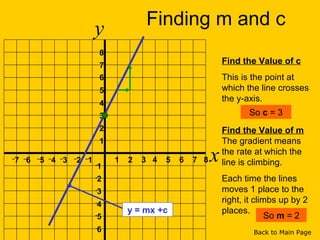
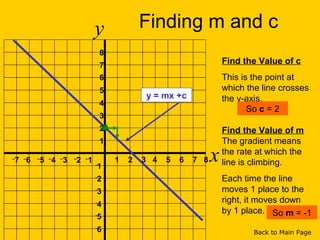
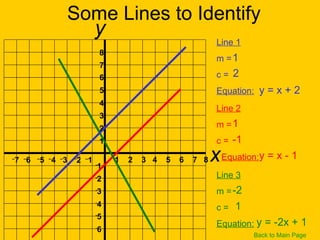
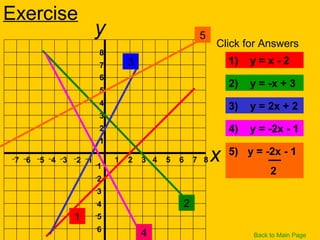
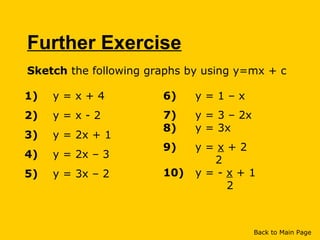
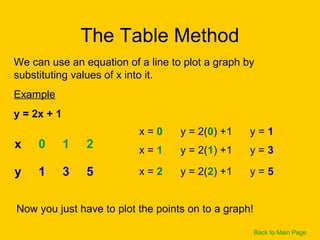
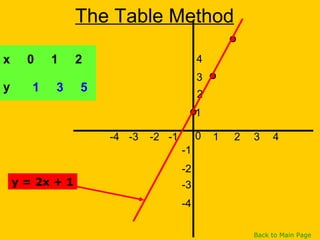
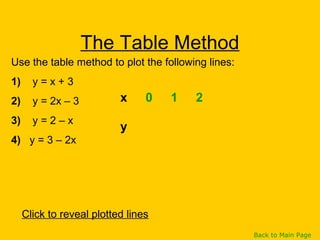
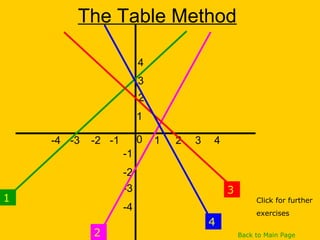
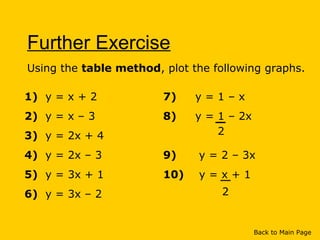
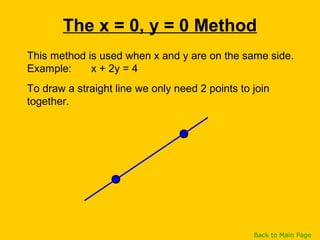
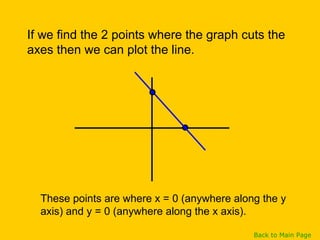
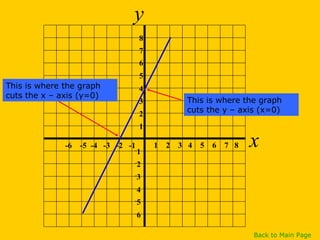
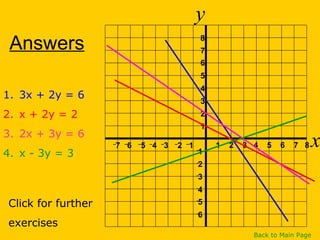
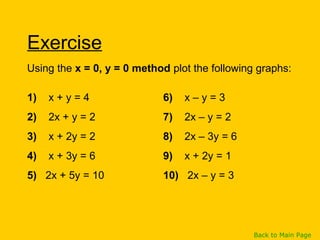
Straight Line Graphs
Sections
1) Horizontal, Vertical and Diagonal Lines
(Exercises)
2) y = mx + c
(Exercises : Naming a Straight Line
Sketching a Straight Line)
3) Plotting a Straight Line - Table Method
(Exercises)
4) Plotting a Straight Line – X = 0, Y = 0 Method
(Exercises)
5) Supporting Exercises
Co-ordinates Negative Numbers Substitution
x
y
1
-5
-4
-3
-2
-1
4
3
2
1
-5 -4 -3 -2 0 2 3 54-1
Naming horizontal and vertical lines
(-4,-2) (0,-2) (-4,-2)
y = -2
(3,4)
(3,1)
(3,-5)
x = 3
(x,y)
Back to Main Page
1
-5
-4
-3
-2
-1
4
3
2
1
-5 -4 -3 -2 0 2 3 54-1
Now try these lines
(-4,2) (0,2) (-4,2)
y = 2
(-2,4)
(-2,1)
(-2,-5)
x = -2
(x,y)
Back to Main Page
y
x
-5
-4
-3
-2
-1
4
3
2
1
1-5 -4 -3 -2 0 2 3 54-1
See if you can name lines 1 to 5(x,y)
1
5 3
4
2 Back to Main Page
y
x
y = 1
x = 1 x = 5
y = -4
x = -4
1
-5
-4
-3
-2
-1
4
3
2
1
-5 -4 -3 -2 0 2 3 54-1
Diagonal Lines
(-4,-3) (0,1) (2,3)
(3,3)
(1,1)
(-3,-3)
y = -x
(x,y)
Back to Main Page
(2,-2)
(-1,1)
(-3,3)
y = x
y = x + 1
y
x
Back to Main Page
1
2
1
-5
-4
-3
-2
-1
4
3
2
1
-5 -4 -3 -2 0 2 3 54-1
3
4
Now see if you can identify these diagonal lines
x
y
y = x - 1
y = x + 1
y = - x - 2
y = -x + 2
y = mx + c
Every straight line can be written in this form. To do this the
values for m and c must be found.
y = mx + c
c is known as the intercept
m is known as the gradient
Back to Main Page
y
x1 2 3 4 5 6 7 8
1
2
3
4
5
6
7
8
–
7 –
6 –
5 –
4 –
3 –
2 –
1 -
1
-
2
-
3
-
4
-
5
-
6
Find the Value of c
This is the point at
which the line crosses
the y-axis.
Find the Value of m
The gradient means
the rate at which the
line is climbing.
Each time the lines
moves 1 place to the
right, it climbs up by 2
places.
Finding m and c
y = 2x +3y = mx +c
So c = 3
So m = 2
Back to Main Page
y
x1 2 3 4 5 6 7 8
1
2
3
4
5
6
7
8
–
7 –
6 –
5 –
4 –
3 –
2 –
1 -
1
-
2
-
3
-
4
-
5
-
6
Find the Value of c
This is the point at
which the line crosses
the y-axis.
Find the Value of m
The gradient means
the rate at which the
line is climbing.
Each time the line
moves 1 place to the
right, it moves down
by 1 place.
Finding m and c
y = 2x +3y = mx +c
So c = 2
So m = -1
Back to Main Page
y
x1 2 3 4 5 6 7 8
1
2
3
4
5
6
7
8
–
7 –
6 –
5 –
4 –
3 –
2 –
1 -
1
-
2
-
3
-
4
-
5
-
6
Line 1
m =
c =
Equation:
Some Lines to Identify
Line 2
m =
c =
Equation:
1
2
y = x + 2
Line 3
m =
c =
Equation:
1
-1
y = x - 1
-2
1
y = -2x + 1
Back to Main Page
y
x1 2 3 4 5 6 7 8
1
2
3
4
5
6
7
8
–
7 –
6 –
5 –
4 –
3 –
2 –
1 -
1
-
2
-
3
-
4
-
5
-
6
Exercise
Back to Main Page
Click for Answers
1
2
3
5
4
1) y = x - 2
2) y = -x + 3
3) y = 2x + 2
4) y = -2x - 1
5) y = -2x - 1
2
Further Exercise
Sketch the following graphs by using y=mx + c
1) y = x + 4
2) y = x - 2
3) y = 2x + 1
4) y = 2x – 3
5) y = 3x – 2
6) y = 1 – x
7) y = 3 – 2x
8) y = 3x
9) y = x + 2
2
10) y = - x + 1
2
Back to Main Page
The Table Method
We can use an equation of a line to plot a graph by
substituting values of x into it.
Example
y = 2x + 1
x = 0 y = 2(0) +1 y = 1
x = 1 y = 2(1) +1 y = 3
x = 2 y = 2(2) +1 y = 5
Now you just have to plot the points on to a graph!
Back to Main Page
x 0 1 2
y 1 3 5
The Table Method
0 1-1 432-2-3-4
-1
-2
-3
-4
1
2
3
4
y = 2x + 1
Back to Main Page
x 0 1 2
y 1 3 5
The Table Method
Use the table method to plot the following lines:
1) y = x + 3
2) y = 2x – 3
3) y = 2 – x
4) y = 3 – 2x
Click to reveal plotted lines
Back to Main Page
x 0 1 2
y
The Table Method
0 1-1 432-2-3-4
-1
-2
-3
-4
1
2
3
4
4
3
1
2 Back to Main Page
Click for further
exercises
Further Exercise
Using the table method, plot the following graphs.
1) y = x + 2
2) y = x – 3
3) y = 2x + 4
4) y = 2x – 3
5) y = 3x + 1
6) y = 3x – 2
7) y = 1 – x
8) y = 1 – 2x
9) y = 2 – 3x
10) y = x + 1
2
Back to Main Page
2
This method is used when x and y are on the same side.
Example: x + 2y = 4
The x = 0, y = 0 Method
To draw a straight line we only need 2 points to join
together.
Back to Main Page
These points are where x = 0 (anywhere along the y
axis) and y = 0 (anywhere along the x axis).
If we find the 2 points where the graph cuts the
axes then we can plot the line.
Back to Main Page
y
x1 2 3 4 5 6 7 8
1
2
3
4
5
6
7
8
-6 -5 -4 -3 -2 -1-
1
-
2
-
3
-
4
-
5
-
6
This is where the graph
cuts the y – axis (x=0)
This is where the graph
cuts the x – axis (y=0)
Back to Main Page
By substituting these values into the equation we
can find the other half of the co-ordinates.
Back to Main Page
Example
Question: Draw the graph of 2x + y = 4
Solution
x = 0
2(0) + y = 4
y = 4
1st
Co-ordinate = (0,4)
y = 0
2x + 0 = 4
2x = 4
x = 2
2nd
Co-ordinate = (2,0)
Back to Main Page
So the graph will look like this.
y
x1 2 3 4 5 6 7 8
1
2
3
4
5
6
7
8
–
7 –
6 –
5 –
4 –
3 –
2 –
1 -
1
-
2
-
3
-
4
-
5
-
6
2x + y = 4
Back to Main Page
Exercise
Plot the following graphs using the x=0, y=0 method.
1) x + y = 5
2) x + 2y = 2
3) 2x + 3y = 6
4) x + 3y = 3
Click to reveal plotted lines
Back to Main Page
Answers
y
x1 2 3 4 5 6 7 8
1
2
3
4
5
6
7
8
–
7 –
6 –
5 –
4 –
3 –
2 –
1 -
1
-
2
-
3
-
4
-
5
-
6
1. 3x + 2y = 6
2. x + 2y = 2
3. 2x + 3y = 6
4. x - 3y = 3
Click for further
exercises
Back to Main Page
Exercise
1) x + y = 4
2) 2x + y = 2
3) x + 2y = 2
4) x + 3y = 6
5) 2x + 5y = 10
6) x – y = 3
7) 2x – y = 2
8) 2x – 3y = 6
9) x + 2y = 1
10) 2x – y = 3
Back to Main Page
Using the x = 0, y = 0 method plot the following graphs:
What are the Co-ordinates of these points?
-1
1
-5
-4
-3
-2
5
4
3
2
1
-5 -4 -3 -2 0 2 3 54-1
(x,y)
Back to Main Page
Negative Numbers
(1) 2 + 3 (2) 6 - 5 (3) 3 - 7 (4) -2 + 6
(5) -1 - 2 (6) -4 + 5 (7) -2 - 2 (8) 0 – 4
(9) -3 + 6 (10) -4 - 1 (11) 6 - 8 (12) -5 - 2
(13) -8 + 4 (14) -5 - (- 2) (15) 0 - (- 1)
(16) 7 - 12 + 9 (17) -4 - 9 + -2 (18) 14 - (- 2)
(19) -45 + 17 (20) 4 - 5½
Addition and Subtraction
Back to Main Page
Negative Numbers
(1) 4 x -3 (2) -7 x -2
(3) -5 x 4 (4) 28 ÷ -7
(5) -21 ÷ -3 (6) -20 ÷ 5
(7) -2 x 3 x 2 (8) -18 ÷ -3 x 2
(9) -2 x -2 x -2 (10) 2.5 x -10
Multiplication and Division
Back to Main Page
Substituting Numbers into Formulae
Exercise
Substitute x = 4 into the following formulae:
1) x – 2
2) 2x
3) 3x + 2
4) 1 – x
5) 3 – 2x
6) 4 - 2x
7) x - 3
2
8) 3 - x
2
9) 2x – 6
Click forward to reveal answers
2
8
14
-3
-5
-4
-1
1
2
Back to Main Page
Substituting Negative Numbers into Formulae
Exercise
Substitute x = -1 into the following formulae:
1) x – 2
2) 2x
3) 3x + 2
4) 1 – x
5) 3 – 2x
6) 4 - 2x
7) x - 3
2
8) 3 - x
2
9) 2x – 6
Click forward to reveal answers
-3
-2
-1
2
5
6
-3½
3½
-8
Back to Main Page

Straight line graphs

  • 1.
  • 2.
    Straight Line Graphs Sections 1)Horizontal, Vertical and Diagonal Lines (Exercises) 2) y = mx + c (Exercises : Naming a Straight Line Sketching a Straight Line) 3) Plotting a Straight Line - Table Method (Exercises) 4) Plotting a Straight Line – X = 0, Y = 0 Method (Exercises) 5) Supporting Exercises Co-ordinates Negative Numbers Substitution
  • 3.
    x y 1 -5 -4 -3 -2 -1 4 3 2 1 -5 -4 -3-2 0 2 3 54-1 Naming horizontal and vertical lines (-4,-2) (0,-2) (-4,-2) y = -2 (3,4) (3,1) (3,-5) x = 3 (x,y) Back to Main Page
  • 4.
    1 -5 -4 -3 -2 -1 4 3 2 1 -5 -4 -3-2 0 2 3 54-1 Now try these lines (-4,2) (0,2) (-4,2) y = 2 (-2,4) (-2,1) (-2,-5) x = -2 (x,y) Back to Main Page y x
  • 5.
    -5 -4 -3 -2 -1 4 3 2 1 1-5 -4 -3-2 0 2 3 54-1 See if you can name lines 1 to 5(x,y) 1 5 3 4 2 Back to Main Page y x y = 1 x = 1 x = 5 y = -4 x = -4
  • 6.
    1 -5 -4 -3 -2 -1 4 3 2 1 -5 -4 -3-2 0 2 3 54-1 Diagonal Lines (-4,-3) (0,1) (2,3) (3,3) (1,1) (-3,-3) y = -x (x,y) Back to Main Page (2,-2) (-1,1) (-3,3) y = x y = x + 1 y x
  • 7.
    Back to MainPage 1 2 1 -5 -4 -3 -2 -1 4 3 2 1 -5 -4 -3 -2 0 2 3 54-1 3 4 Now see if you can identify these diagonal lines x y y = x - 1 y = x + 1 y = - x - 2 y = -x + 2
  • 8.
    y = mx+ c Every straight line can be written in this form. To do this the values for m and c must be found. y = mx + c c is known as the intercept m is known as the gradient Back to Main Page
  • 9.
    y x1 2 34 5 6 7 8 1 2 3 4 5 6 7 8 – 7 – 6 – 5 – 4 – 3 – 2 – 1 - 1 - 2 - 3 - 4 - 5 - 6 Find the Value of c This is the point at which the line crosses the y-axis. Find the Value of m The gradient means the rate at which the line is climbing. Each time the lines moves 1 place to the right, it climbs up by 2 places. Finding m and c y = 2x +3y = mx +c So c = 3 So m = 2 Back to Main Page
  • 10.
    y x1 2 34 5 6 7 8 1 2 3 4 5 6 7 8 – 7 – 6 – 5 – 4 – 3 – 2 – 1 - 1 - 2 - 3 - 4 - 5 - 6 Find the Value of c This is the point at which the line crosses the y-axis. Find the Value of m The gradient means the rate at which the line is climbing. Each time the line moves 1 place to the right, it moves down by 1 place. Finding m and c y = 2x +3y = mx +c So c = 2 So m = -1 Back to Main Page
  • 11.
    y x1 2 34 5 6 7 8 1 2 3 4 5 6 7 8 – 7 – 6 – 5 – 4 – 3 – 2 – 1 - 1 - 2 - 3 - 4 - 5 - 6 Line 1 m = c = Equation: Some Lines to Identify Line 2 m = c = Equation: 1 2 y = x + 2 Line 3 m = c = Equation: 1 -1 y = x - 1 -2 1 y = -2x + 1 Back to Main Page
  • 12.
    y x1 2 34 5 6 7 8 1 2 3 4 5 6 7 8 – 7 – 6 – 5 – 4 – 3 – 2 – 1 - 1 - 2 - 3 - 4 - 5 - 6 Exercise Back to Main Page Click for Answers 1 2 3 5 4 1) y = x - 2 2) y = -x + 3 3) y = 2x + 2 4) y = -2x - 1 5) y = -2x - 1 2
  • 13.
    Further Exercise Sketch thefollowing graphs by using y=mx + c 1) y = x + 4 2) y = x - 2 3) y = 2x + 1 4) y = 2x – 3 5) y = 3x – 2 6) y = 1 – x 7) y = 3 – 2x 8) y = 3x 9) y = x + 2 2 10) y = - x + 1 2 Back to Main Page
  • 14.
    The Table Method Wecan use an equation of a line to plot a graph by substituting values of x into it. Example y = 2x + 1 x = 0 y = 2(0) +1 y = 1 x = 1 y = 2(1) +1 y = 3 x = 2 y = 2(2) +1 y = 5 Now you just have to plot the points on to a graph! Back to Main Page x 0 1 2 y 1 3 5
  • 15.
    The Table Method 01-1 432-2-3-4 -1 -2 -3 -4 1 2 3 4 y = 2x + 1 Back to Main Page x 0 1 2 y 1 3 5
  • 16.
    The Table Method Usethe table method to plot the following lines: 1) y = x + 3 2) y = 2x – 3 3) y = 2 – x 4) y = 3 – 2x Click to reveal plotted lines Back to Main Page x 0 1 2 y
  • 17.
    The Table Method 01-1 432-2-3-4 -1 -2 -3 -4 1 2 3 4 4 3 1 2 Back to Main Page Click for further exercises
  • 18.
    Further Exercise Using thetable method, plot the following graphs. 1) y = x + 2 2) y = x – 3 3) y = 2x + 4 4) y = 2x – 3 5) y = 3x + 1 6) y = 3x – 2 7) y = 1 – x 8) y = 1 – 2x 9) y = 2 – 3x 10) y = x + 1 2 Back to Main Page 2
  • 19.
    This method isused when x and y are on the same side. Example: x + 2y = 4 The x = 0, y = 0 Method To draw a straight line we only need 2 points to join together. Back to Main Page
  • 20.
    These points arewhere x = 0 (anywhere along the y axis) and y = 0 (anywhere along the x axis). If we find the 2 points where the graph cuts the axes then we can plot the line. Back to Main Page
  • 21.
    y x1 2 34 5 6 7 8 1 2 3 4 5 6 7 8 -6 -5 -4 -3 -2 -1- 1 - 2 - 3 - 4 - 5 - 6 This is where the graph cuts the y – axis (x=0) This is where the graph cuts the x – axis (y=0) Back to Main Page
  • 22.
    By substituting thesevalues into the equation we can find the other half of the co-ordinates. Back to Main Page
  • 23.
    Example Question: Draw thegraph of 2x + y = 4 Solution x = 0 2(0) + y = 4 y = 4 1st Co-ordinate = (0,4) y = 0 2x + 0 = 4 2x = 4 x = 2 2nd Co-ordinate = (2,0) Back to Main Page
  • 24.
    So the graphwill look like this. y x1 2 3 4 5 6 7 8 1 2 3 4 5 6 7 8 – 7 – 6 – 5 – 4 – 3 – 2 – 1 - 1 - 2 - 3 - 4 - 5 - 6 2x + y = 4 Back to Main Page
  • 25.
    Exercise Plot the followinggraphs using the x=0, y=0 method. 1) x + y = 5 2) x + 2y = 2 3) 2x + 3y = 6 4) x + 3y = 3 Click to reveal plotted lines Back to Main Page
  • 26.
    Answers y x1 2 34 5 6 7 8 1 2 3 4 5 6 7 8 – 7 – 6 – 5 – 4 – 3 – 2 – 1 - 1 - 2 - 3 - 4 - 5 - 6 1. 3x + 2y = 6 2. x + 2y = 2 3. 2x + 3y = 6 4. x - 3y = 3 Click for further exercises Back to Main Page
  • 27.
    Exercise 1) x +y = 4 2) 2x + y = 2 3) x + 2y = 2 4) x + 3y = 6 5) 2x + 5y = 10 6) x – y = 3 7) 2x – y = 2 8) 2x – 3y = 6 9) x + 2y = 1 10) 2x – y = 3 Back to Main Page Using the x = 0, y = 0 method plot the following graphs:
  • 28.
    What are theCo-ordinates of these points? -1 1 -5 -4 -3 -2 5 4 3 2 1 -5 -4 -3 -2 0 2 3 54-1 (x,y) Back to Main Page
  • 29.
    Negative Numbers (1) 2+ 3 (2) 6 - 5 (3) 3 - 7 (4) -2 + 6 (5) -1 - 2 (6) -4 + 5 (7) -2 - 2 (8) 0 – 4 (9) -3 + 6 (10) -4 - 1 (11) 6 - 8 (12) -5 - 2 (13) -8 + 4 (14) -5 - (- 2) (15) 0 - (- 1) (16) 7 - 12 + 9 (17) -4 - 9 + -2 (18) 14 - (- 2) (19) -45 + 17 (20) 4 - 5½ Addition and Subtraction Back to Main Page
  • 30.
    Negative Numbers (1) 4x -3 (2) -7 x -2 (3) -5 x 4 (4) 28 ÷ -7 (5) -21 ÷ -3 (6) -20 ÷ 5 (7) -2 x 3 x 2 (8) -18 ÷ -3 x 2 (9) -2 x -2 x -2 (10) 2.5 x -10 Multiplication and Division Back to Main Page
  • 31.
    Substituting Numbers intoFormulae Exercise Substitute x = 4 into the following formulae: 1) x – 2 2) 2x 3) 3x + 2 4) 1 – x 5) 3 – 2x 6) 4 - 2x 7) x - 3 2 8) 3 - x 2 9) 2x – 6 Click forward to reveal answers 2 8 14 -3 -5 -4 -1 1 2 Back to Main Page
  • 32.
    Substituting Negative Numbersinto Formulae Exercise Substitute x = -1 into the following formulae: 1) x – 2 2) 2x 3) 3x + 2 4) 1 – x 5) 3 – 2x 6) 4 - 2x 7) x - 3 2 8) 3 - x 2 9) 2x – 6 Click forward to reveal answers -3 -2 -1 2 5 6 -3½ 3½ -8 Back to Main Page

Editor's Notes

  • #29 Mention the order of cartesian co-ordiantes (x is a-cross)