Recommended
PPTX
PPT
PPT
straight-line-graphs11111111111111111.ppt
PPT
Linear equations 2-2 a graphing and x-y intercepts
PPTX
PDF
Lecture 5.1.5 graphs of quadratic equations
PPTX
PPT
PPTX
IGCSE MATHS - Algebraic and Graph - Graph of Functions (quadratic, cubic....)
PPT
G8 Math Q2- Week 4- Graph Linear Function.ppt
PDF
PPT
Graphs linear equations and functions
DOC
Mathematics 9 Quadratic Functions (Module 2)
PPTX
PPT
Introduction to straight line graphs lesson
PPTX
Graphs & linear equations assign
PPTX
2a-Sketching-Graphs-of-Quadratic-Functions.pptx
PPTX
Precalculus 01 Functions and Graphs.pptx
PPT
PPT
Solving quadratics by graphing notes
PPTX
0101: Graphing Quadratic Functions
DOC
PPTX
PPTX
PPTX
KEY
PDF
DOC
PDF
Agent-Based Automation of Collaborative Software Development: Current Status ...
PDF
Blooket Hacks with Updated Codes 2025 Free
More Related Content
PPTX
PPT
PPT
straight-line-graphs11111111111111111.ppt
PPT
Linear equations 2-2 a graphing and x-y intercepts
PPTX
PDF
Lecture 5.1.5 graphs of quadratic equations
PPTX
PPT
Similar to Plotting Line and quadratic Graphs grade 7.pptx
PPTX
IGCSE MATHS - Algebraic and Graph - Graph of Functions (quadratic, cubic....)
PPT
G8 Math Q2- Week 4- Graph Linear Function.ppt
PDF
PPT
Graphs linear equations and functions
DOC
Mathematics 9 Quadratic Functions (Module 2)
PPTX
PPT
Introduction to straight line graphs lesson
PPTX
Graphs & linear equations assign
PPTX
2a-Sketching-Graphs-of-Quadratic-Functions.pptx
PPTX
Precalculus 01 Functions and Graphs.pptx
PPT
PPT
Solving quadratics by graphing notes
PPTX
0101: Graphing Quadratic Functions
DOC
PPTX
PPTX
PPTX
KEY
PDF
DOC
Recently uploaded
PDF
Agent-Based Automation of Collaborative Software Development: Current Status ...
PDF
Blooket Hacks with Updated Codes 2025 Free
PDF
Mahatma Gandhi and the Nationalist Movement.pdf
PPTX
Random_Presentation_1 sie ejebbsjsnseu shbes
PDF
GreenRoute_Presentation_CE-UY4833_FV.pdf
PPTX
Jim-Nitterauer-Decrypting-the-Mess-that-is-SSL-TLS-Negotiation-Preparing-for-...
PDF
Sensor LSI Cat.pdf INSTALALACION Y CALIBRACION
PDF
G11-IT(2).PDF Information Technology grade 11th new curriculum book
PDF
Letter Writing for the Students of Inter
PDF
Entrepreneurship-in-the-Digital-Age Entrepreneur in digital age
PPTX
Android is one of the most widely used mobile operating systems
PPT
Null hypothesis and p-values, degree of freedom B.Pharm.ppt
PPTX
Waste_to_Electricity_Project_Presentatio
PPTX
1. SIH2025-IDEA-Presentation-Format[1].pptx
PPTX
Vehicle-as-a-Platform Hardware Market Top key players and Regional Outlook t...
PDF
John Deere 330G Skid Steer Loader Repair Technical Manual
PDF
624J John Deere Loader Operation and Test Technical Manual.pdf
PDF
Ford_3415_Operational and Maintenance Manual
DOCX
24/7 QuickBooks Support near me in San Jose.docx
DOCX
create a bluecollar pitchdeck aimed at creating jobs for kenyans,let the imag...
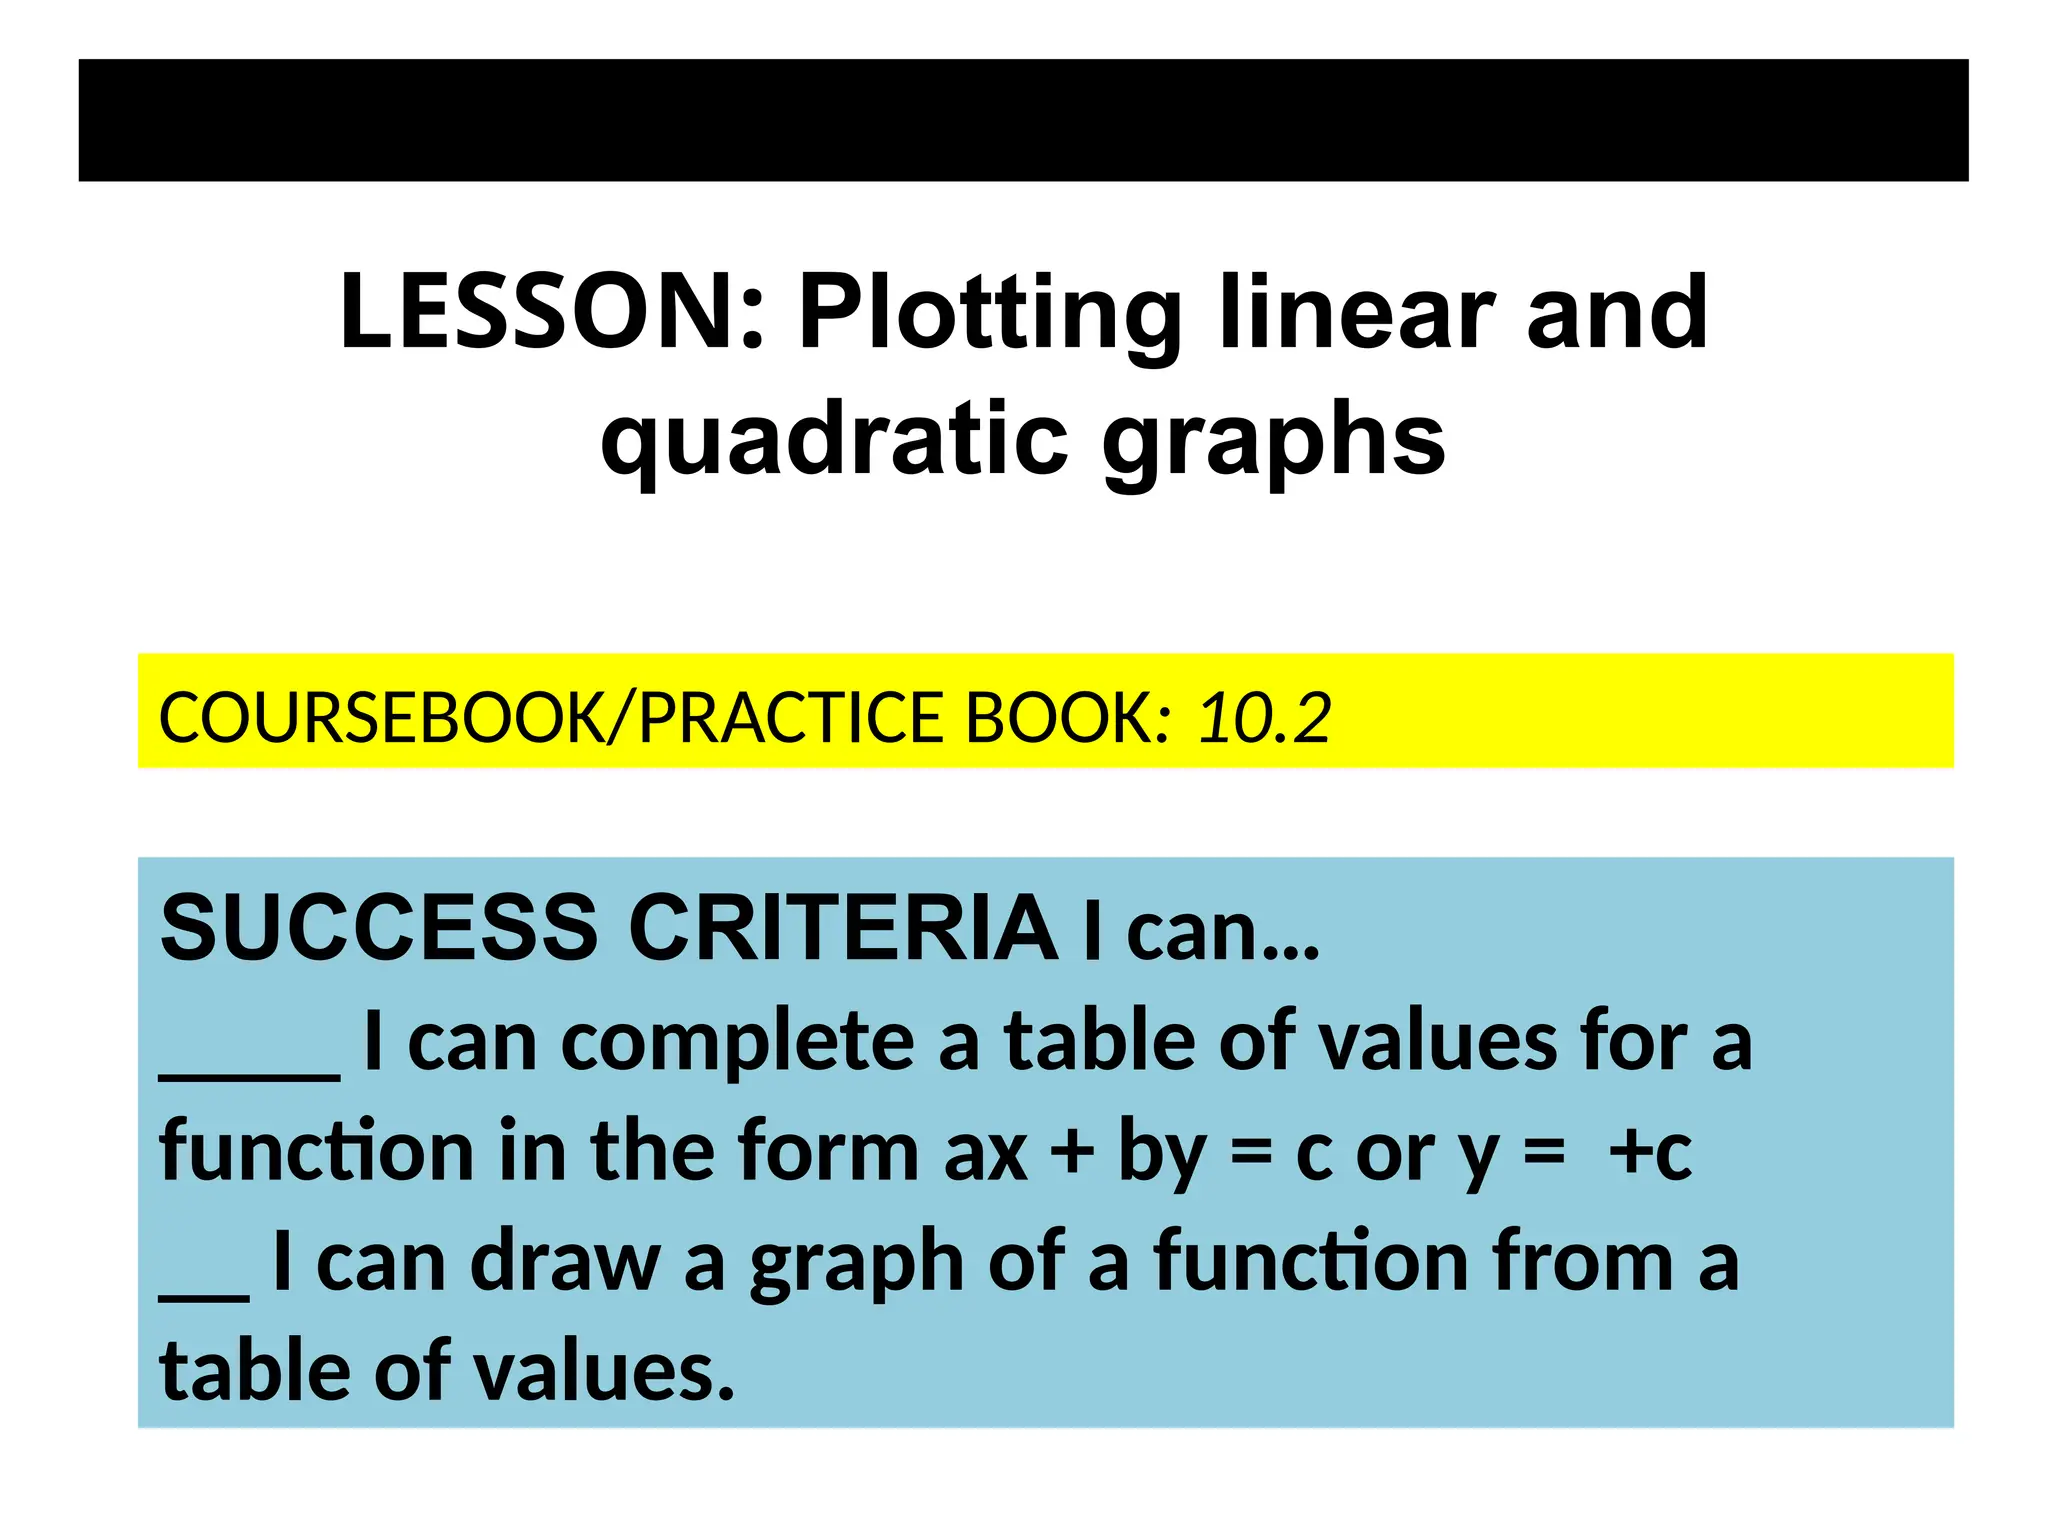
Plotting Line and quadratic Graphs grade 7.pptx 1. 2. LESSON: Plotting linear and
quadratic graphs
SUCCESS CRITERIA I can…
____ I can complete a table of values for a
function in the form ax + by = c or y = +c
__ I can draw a graph of a function from a
table of values.
COURSEBOOK/PRACTICE BOOK: 10.2
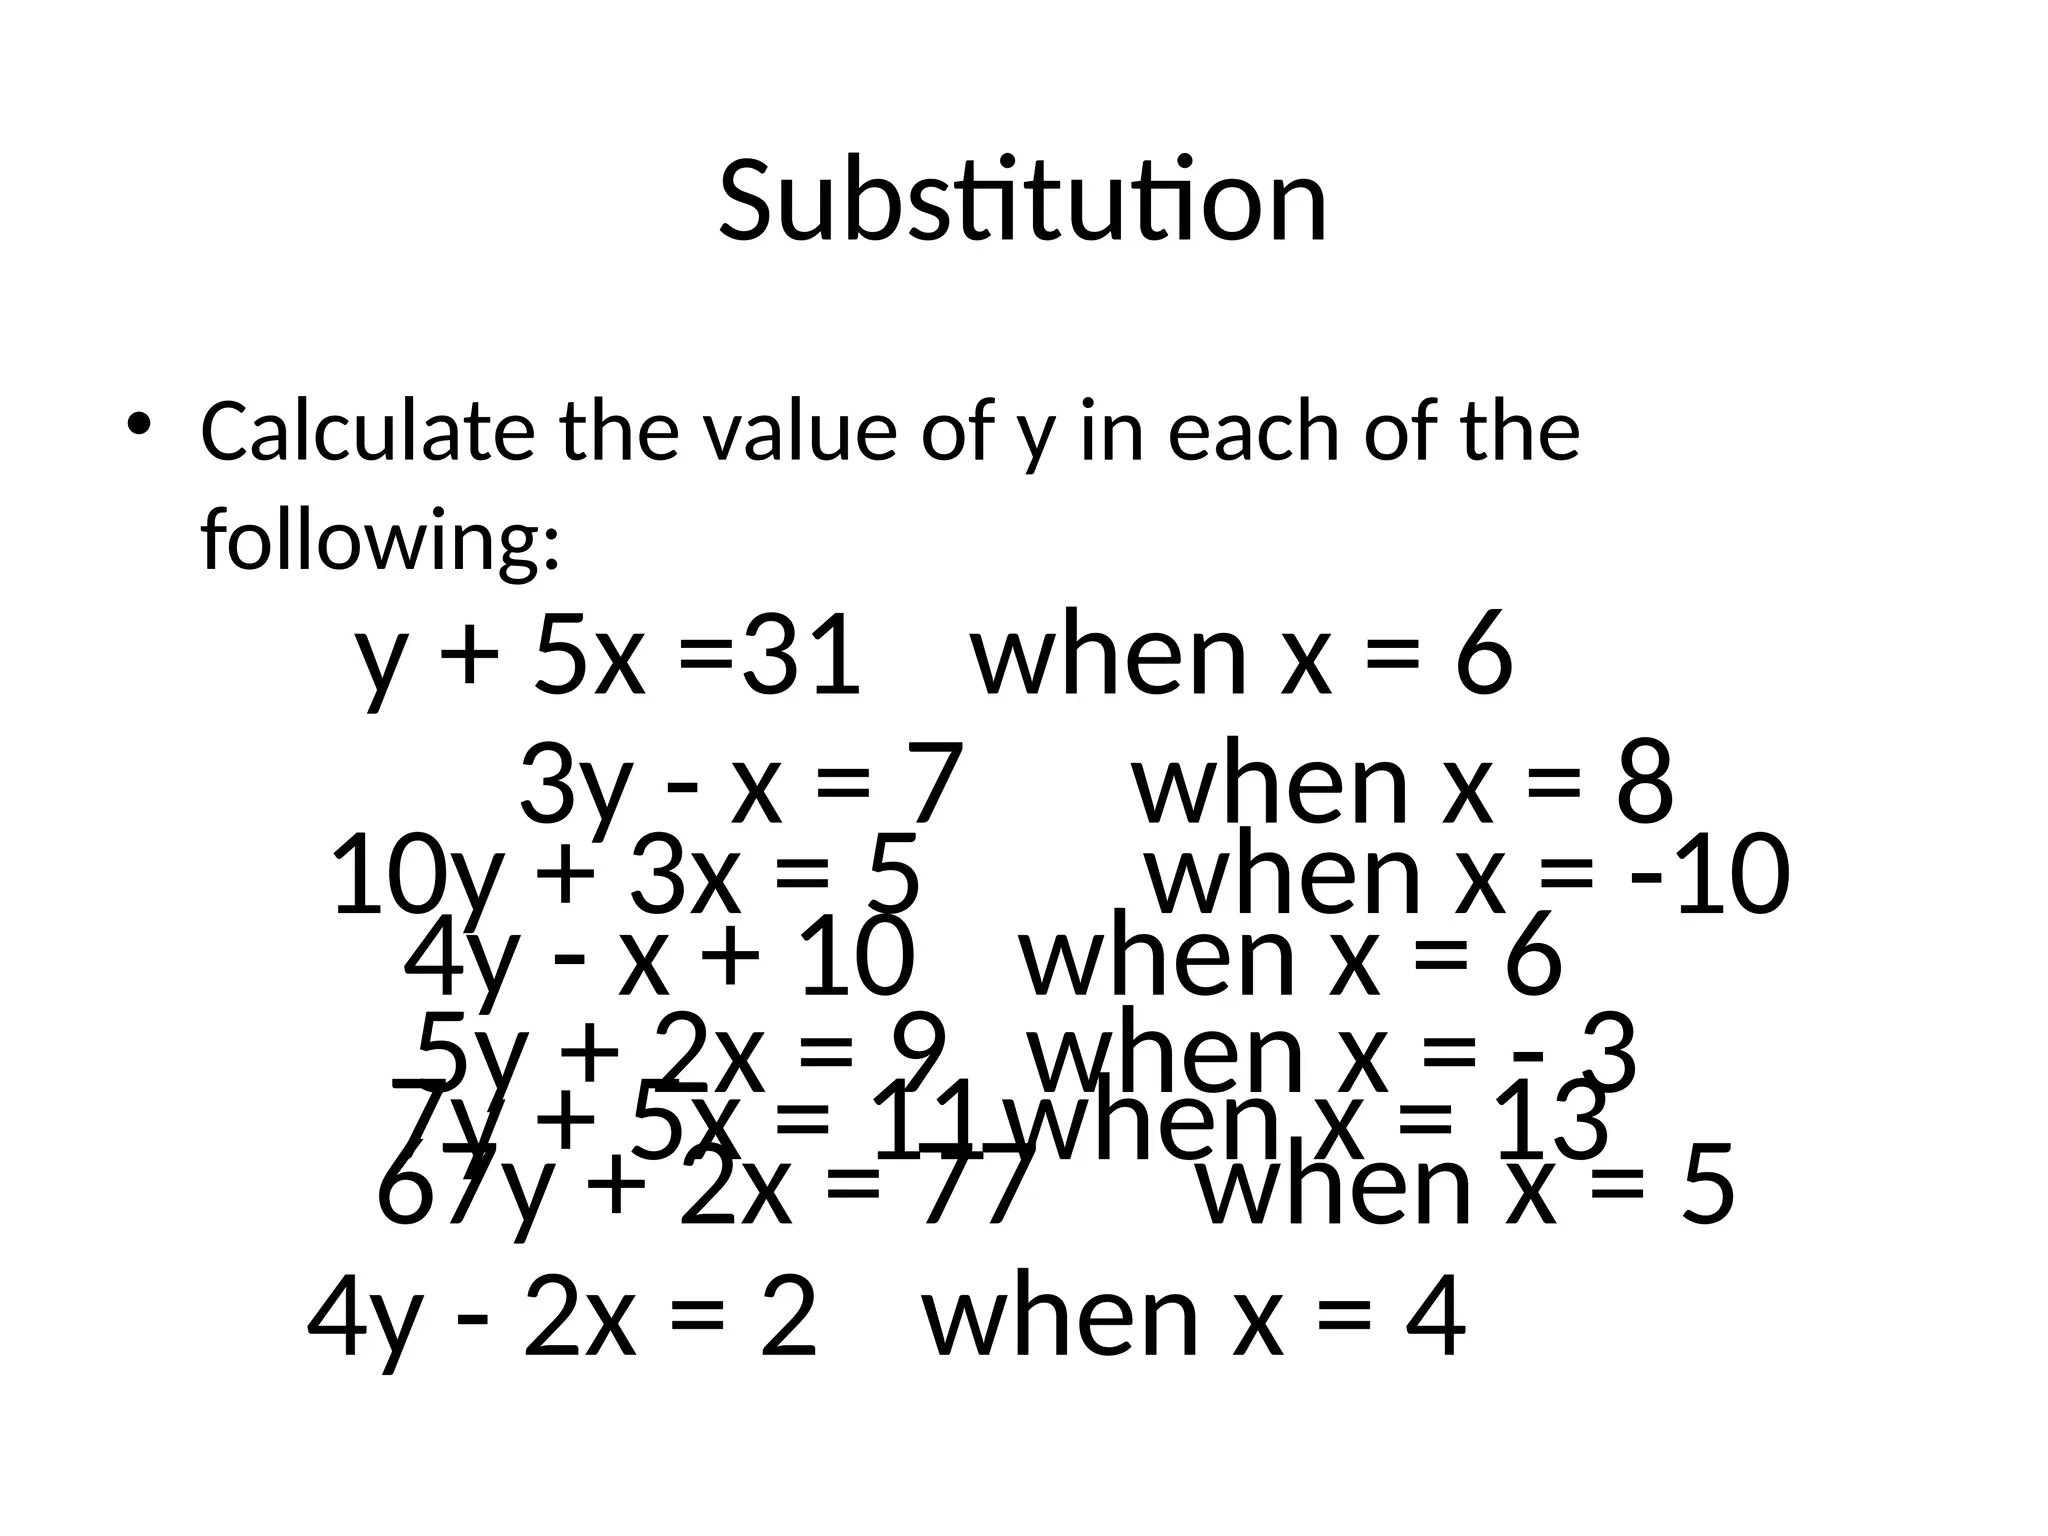
3. Substitution
• Calculate the value of y in each of the
following:
3y - x = 7 when x = 8
4y - x + 10 when x = 6
7y + 5x = 11when x = 13
67y + 2x = 77 when x = 5
y + 5x =31 when x = 6
4y - 2x = 2 when x = 4
10y + 3x = 5 when x = -10
5y + 2x = 9 when x = - 3
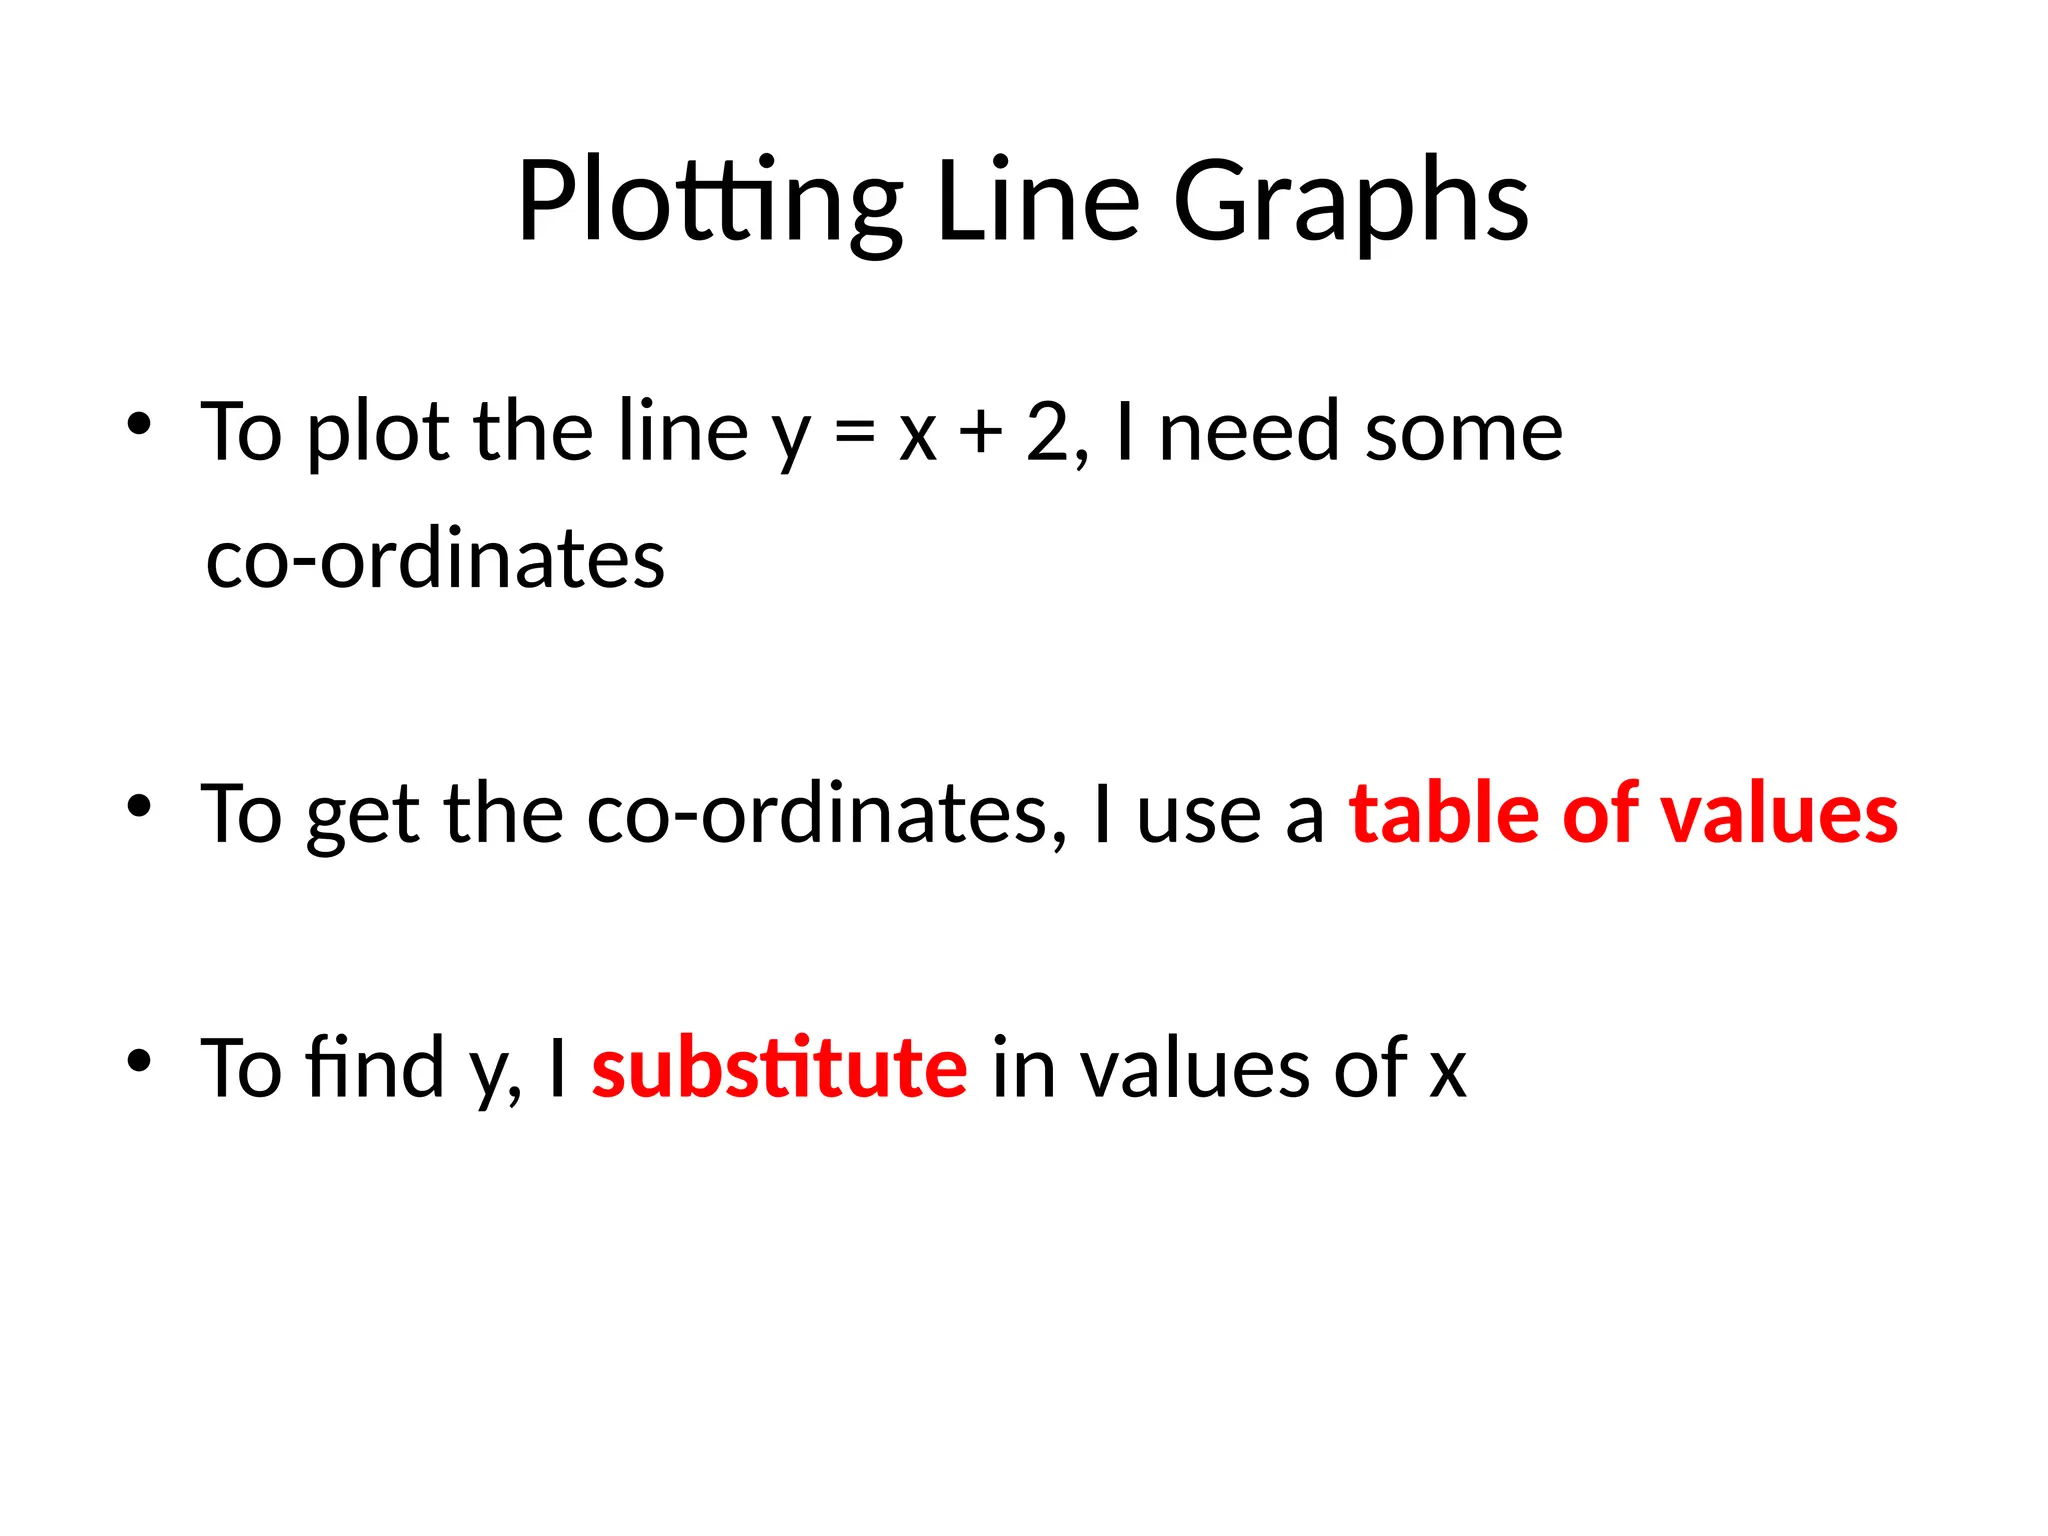
4. Plotting Line Graphs
• To plot the line y = x + 2, I need some
co-ordinates
• To get the co-ordinates, I use a table of values
• To find y, I substitute in values of x
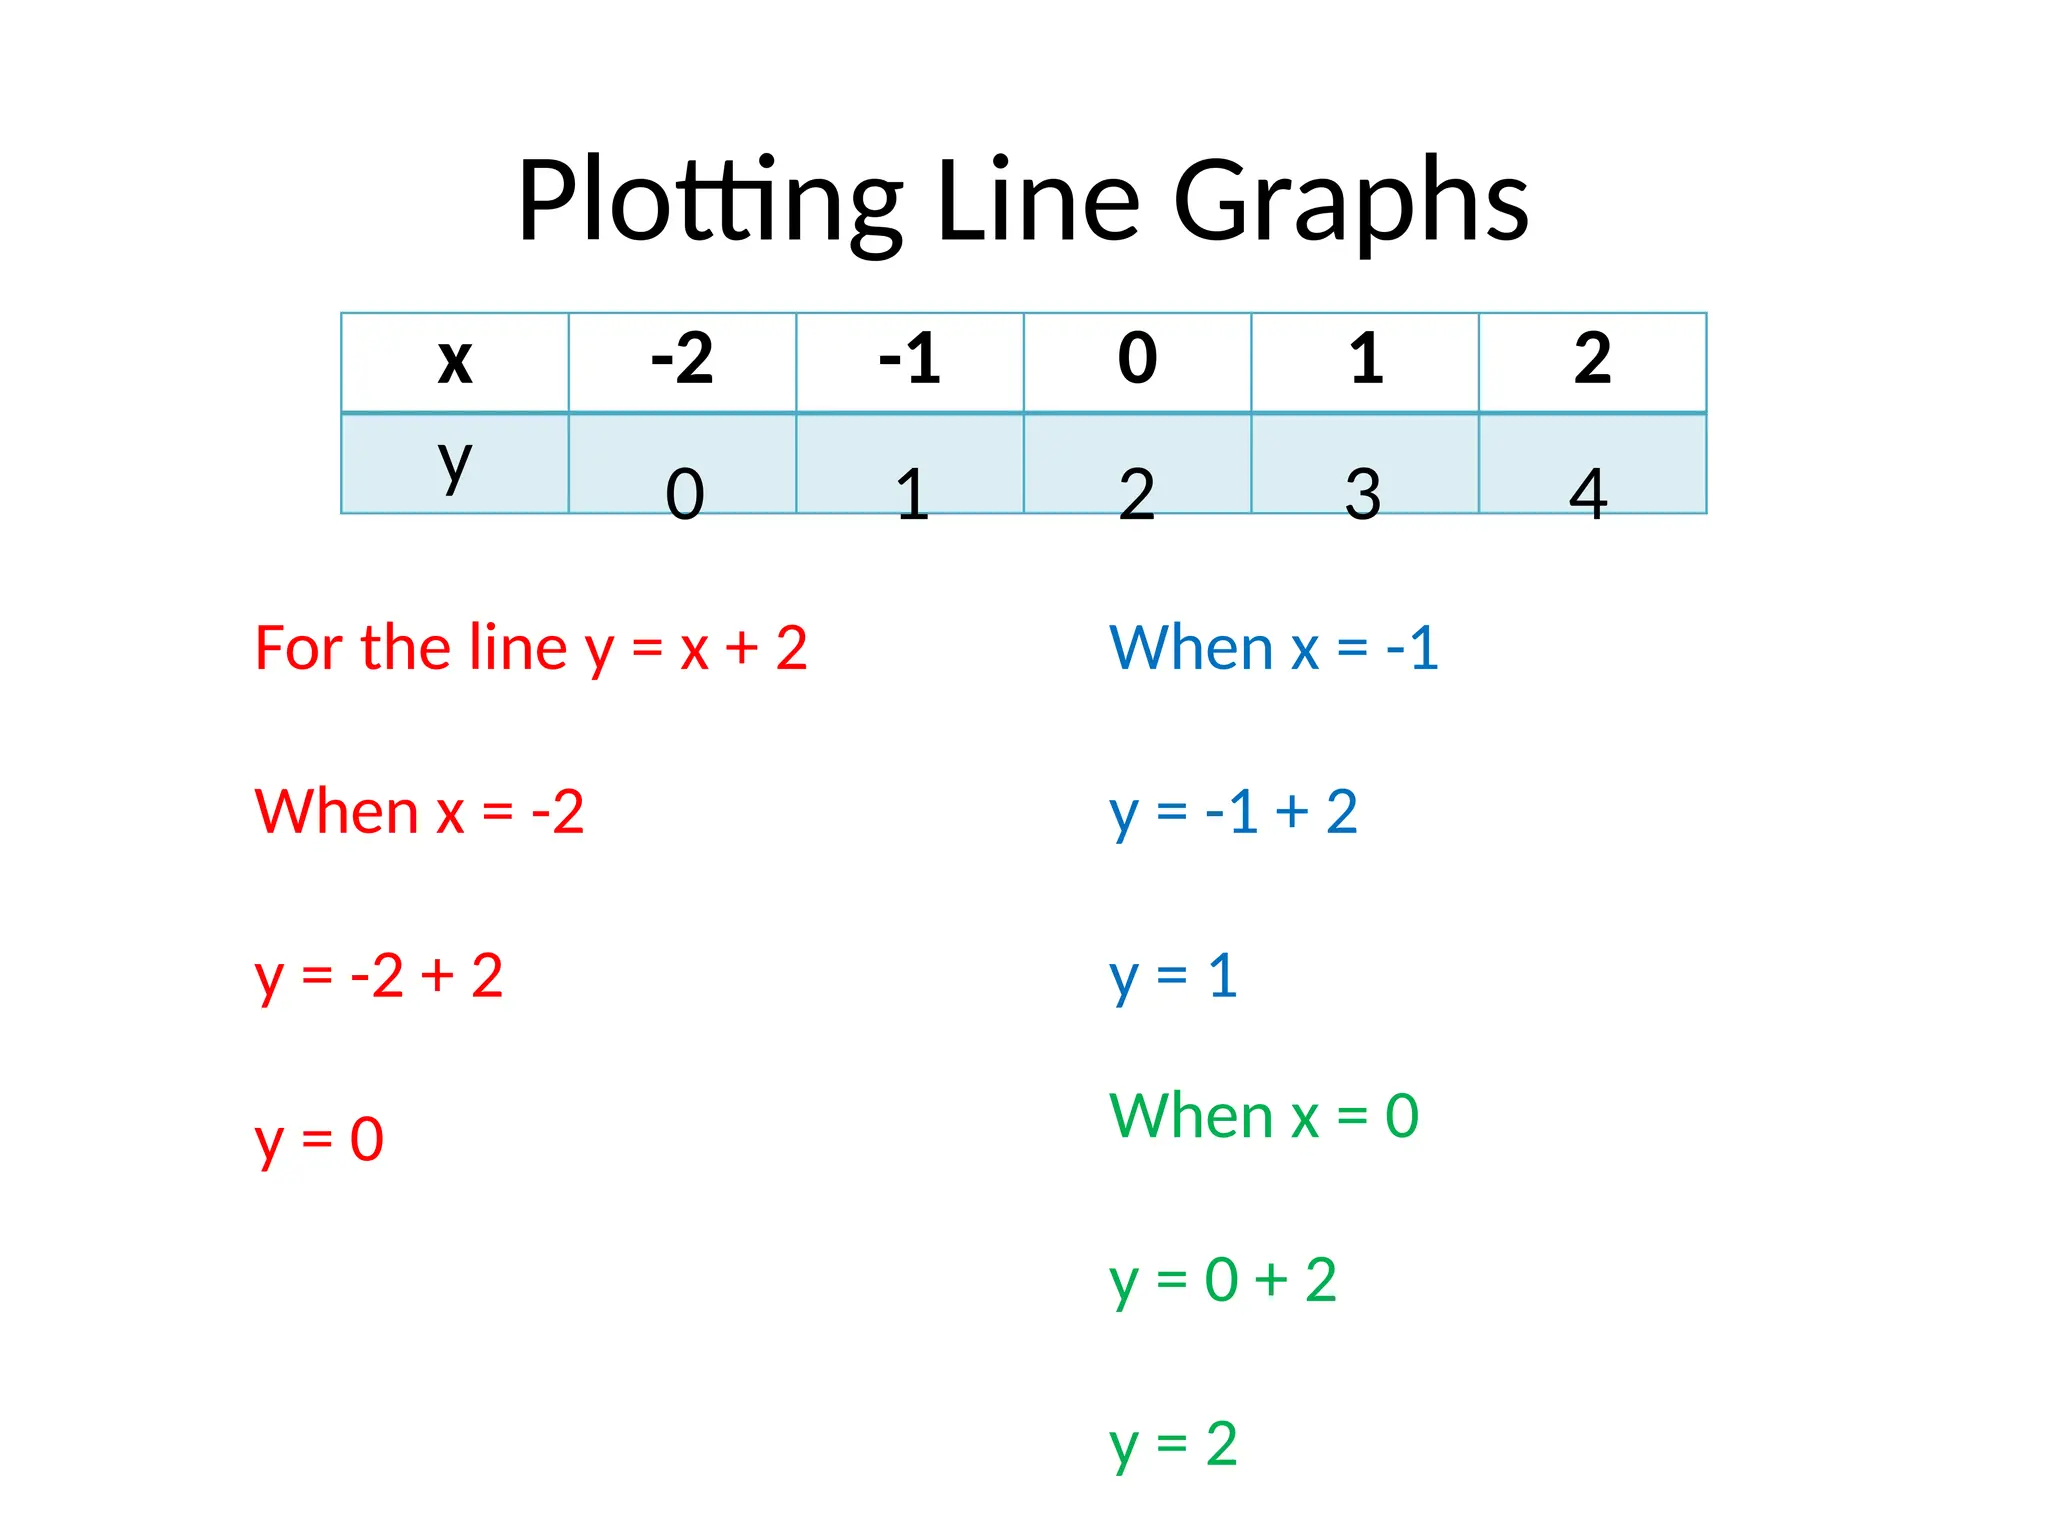
5. Plotting Line Graphs
x -2 -1 0 1 2
y
For the line y = x + 2
When x = -2
y = -2 + 2
y = 0
0
When x = -1
y = -1 + 2
y = 1
1 2 3 4
When x = 0
y = 0 + 2
y = 2
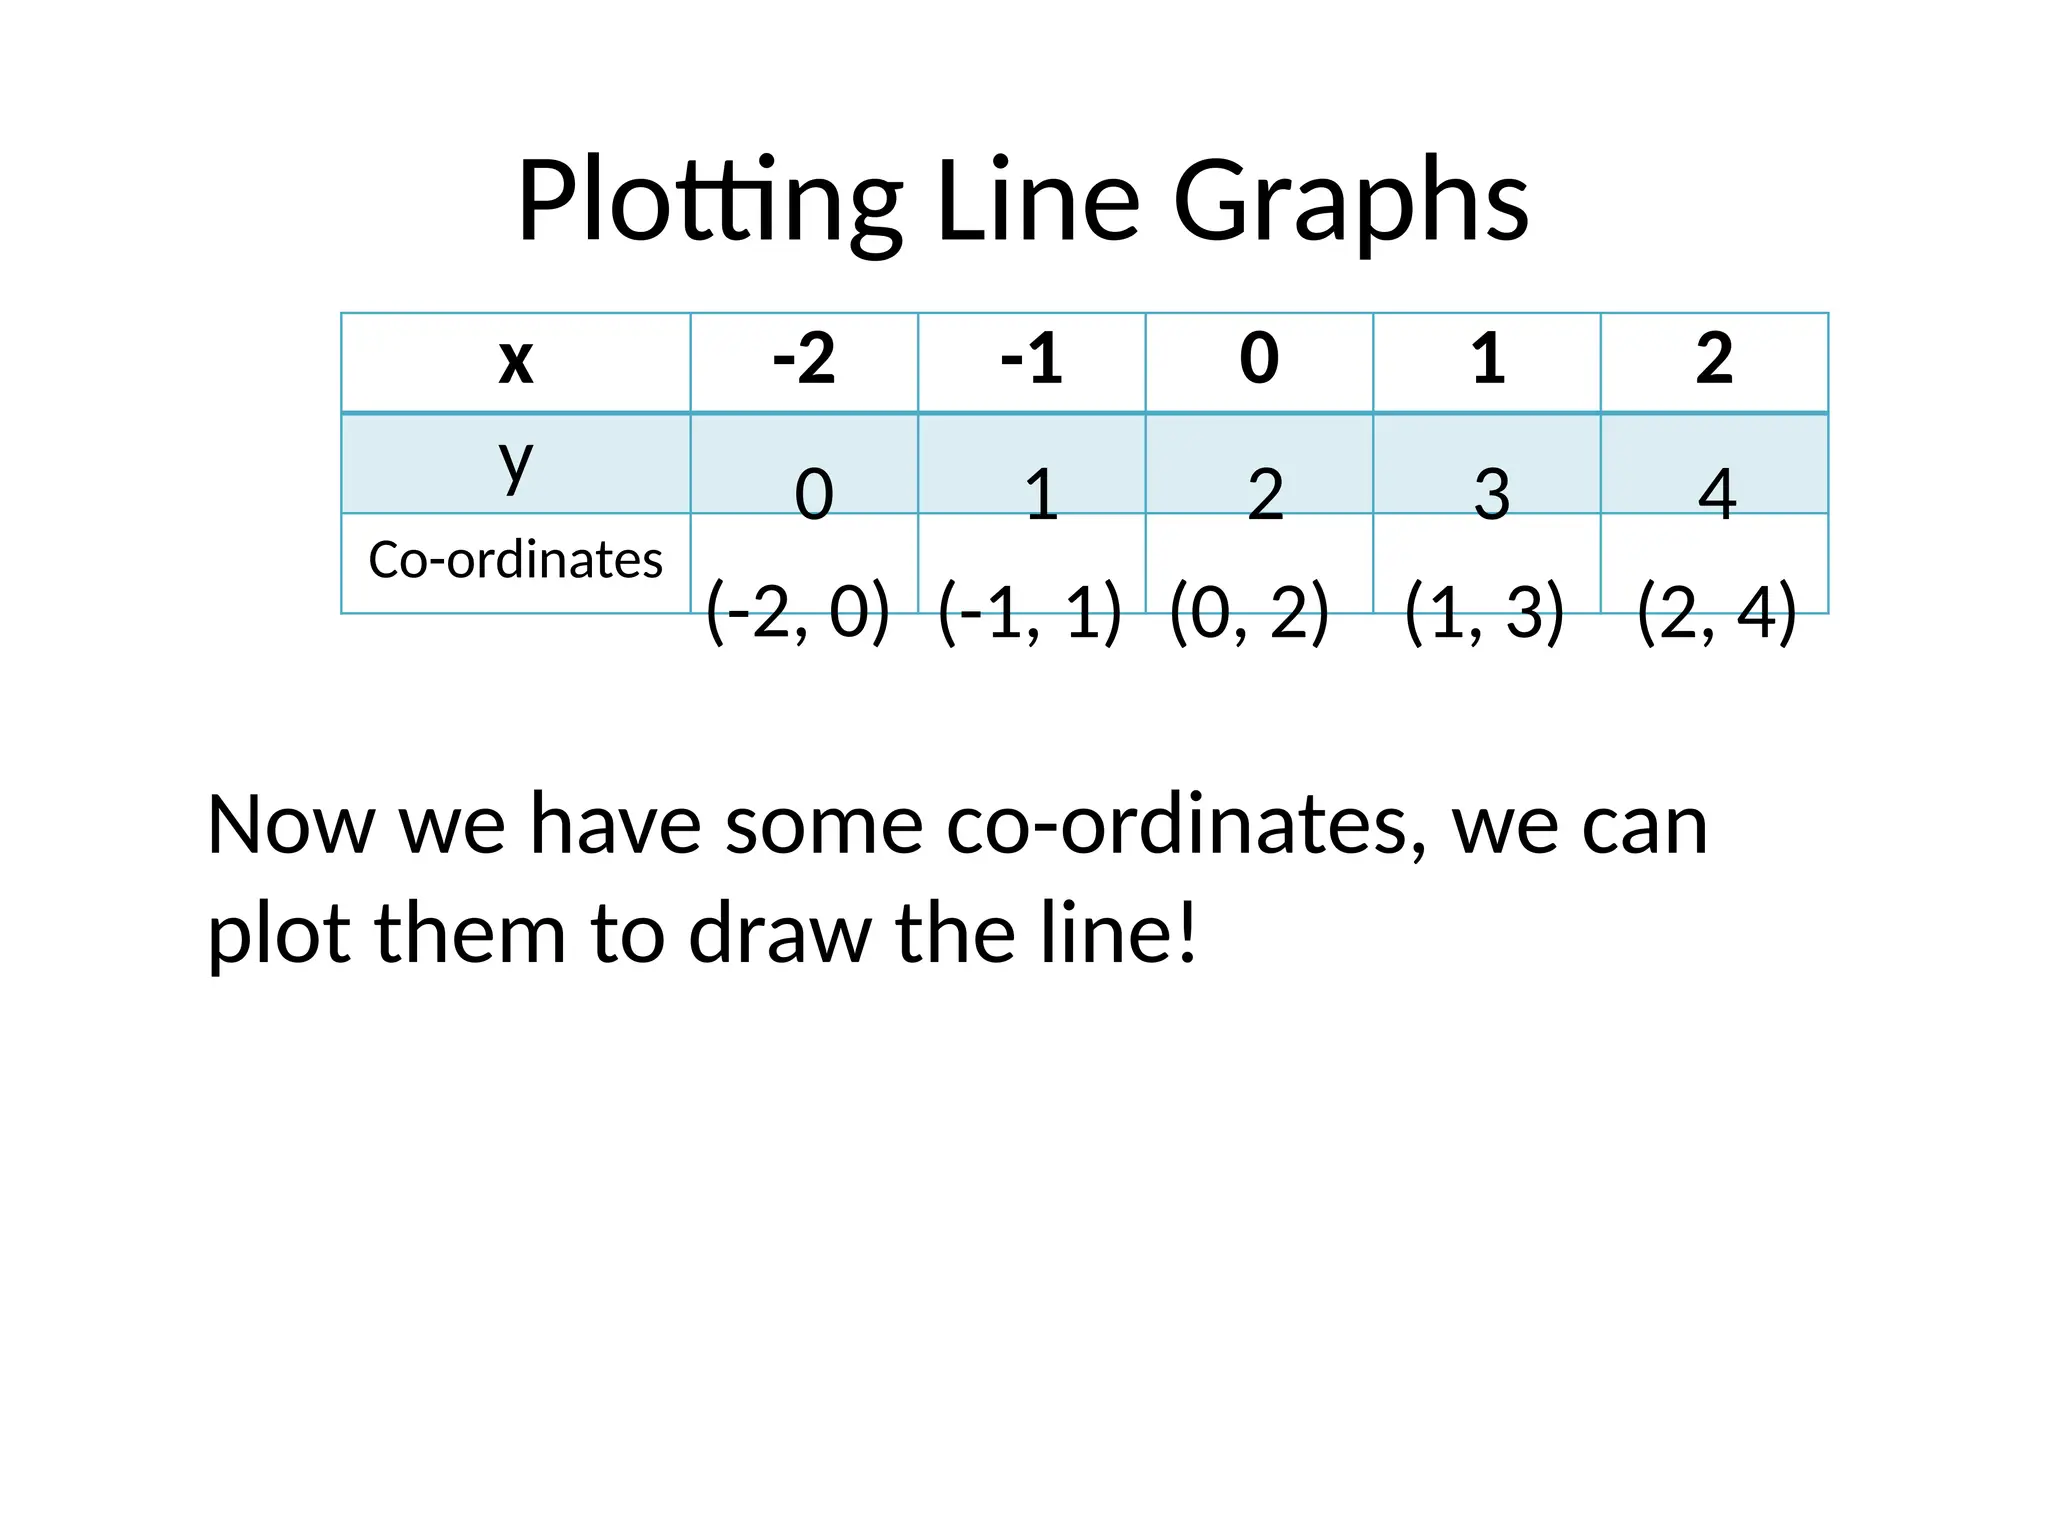
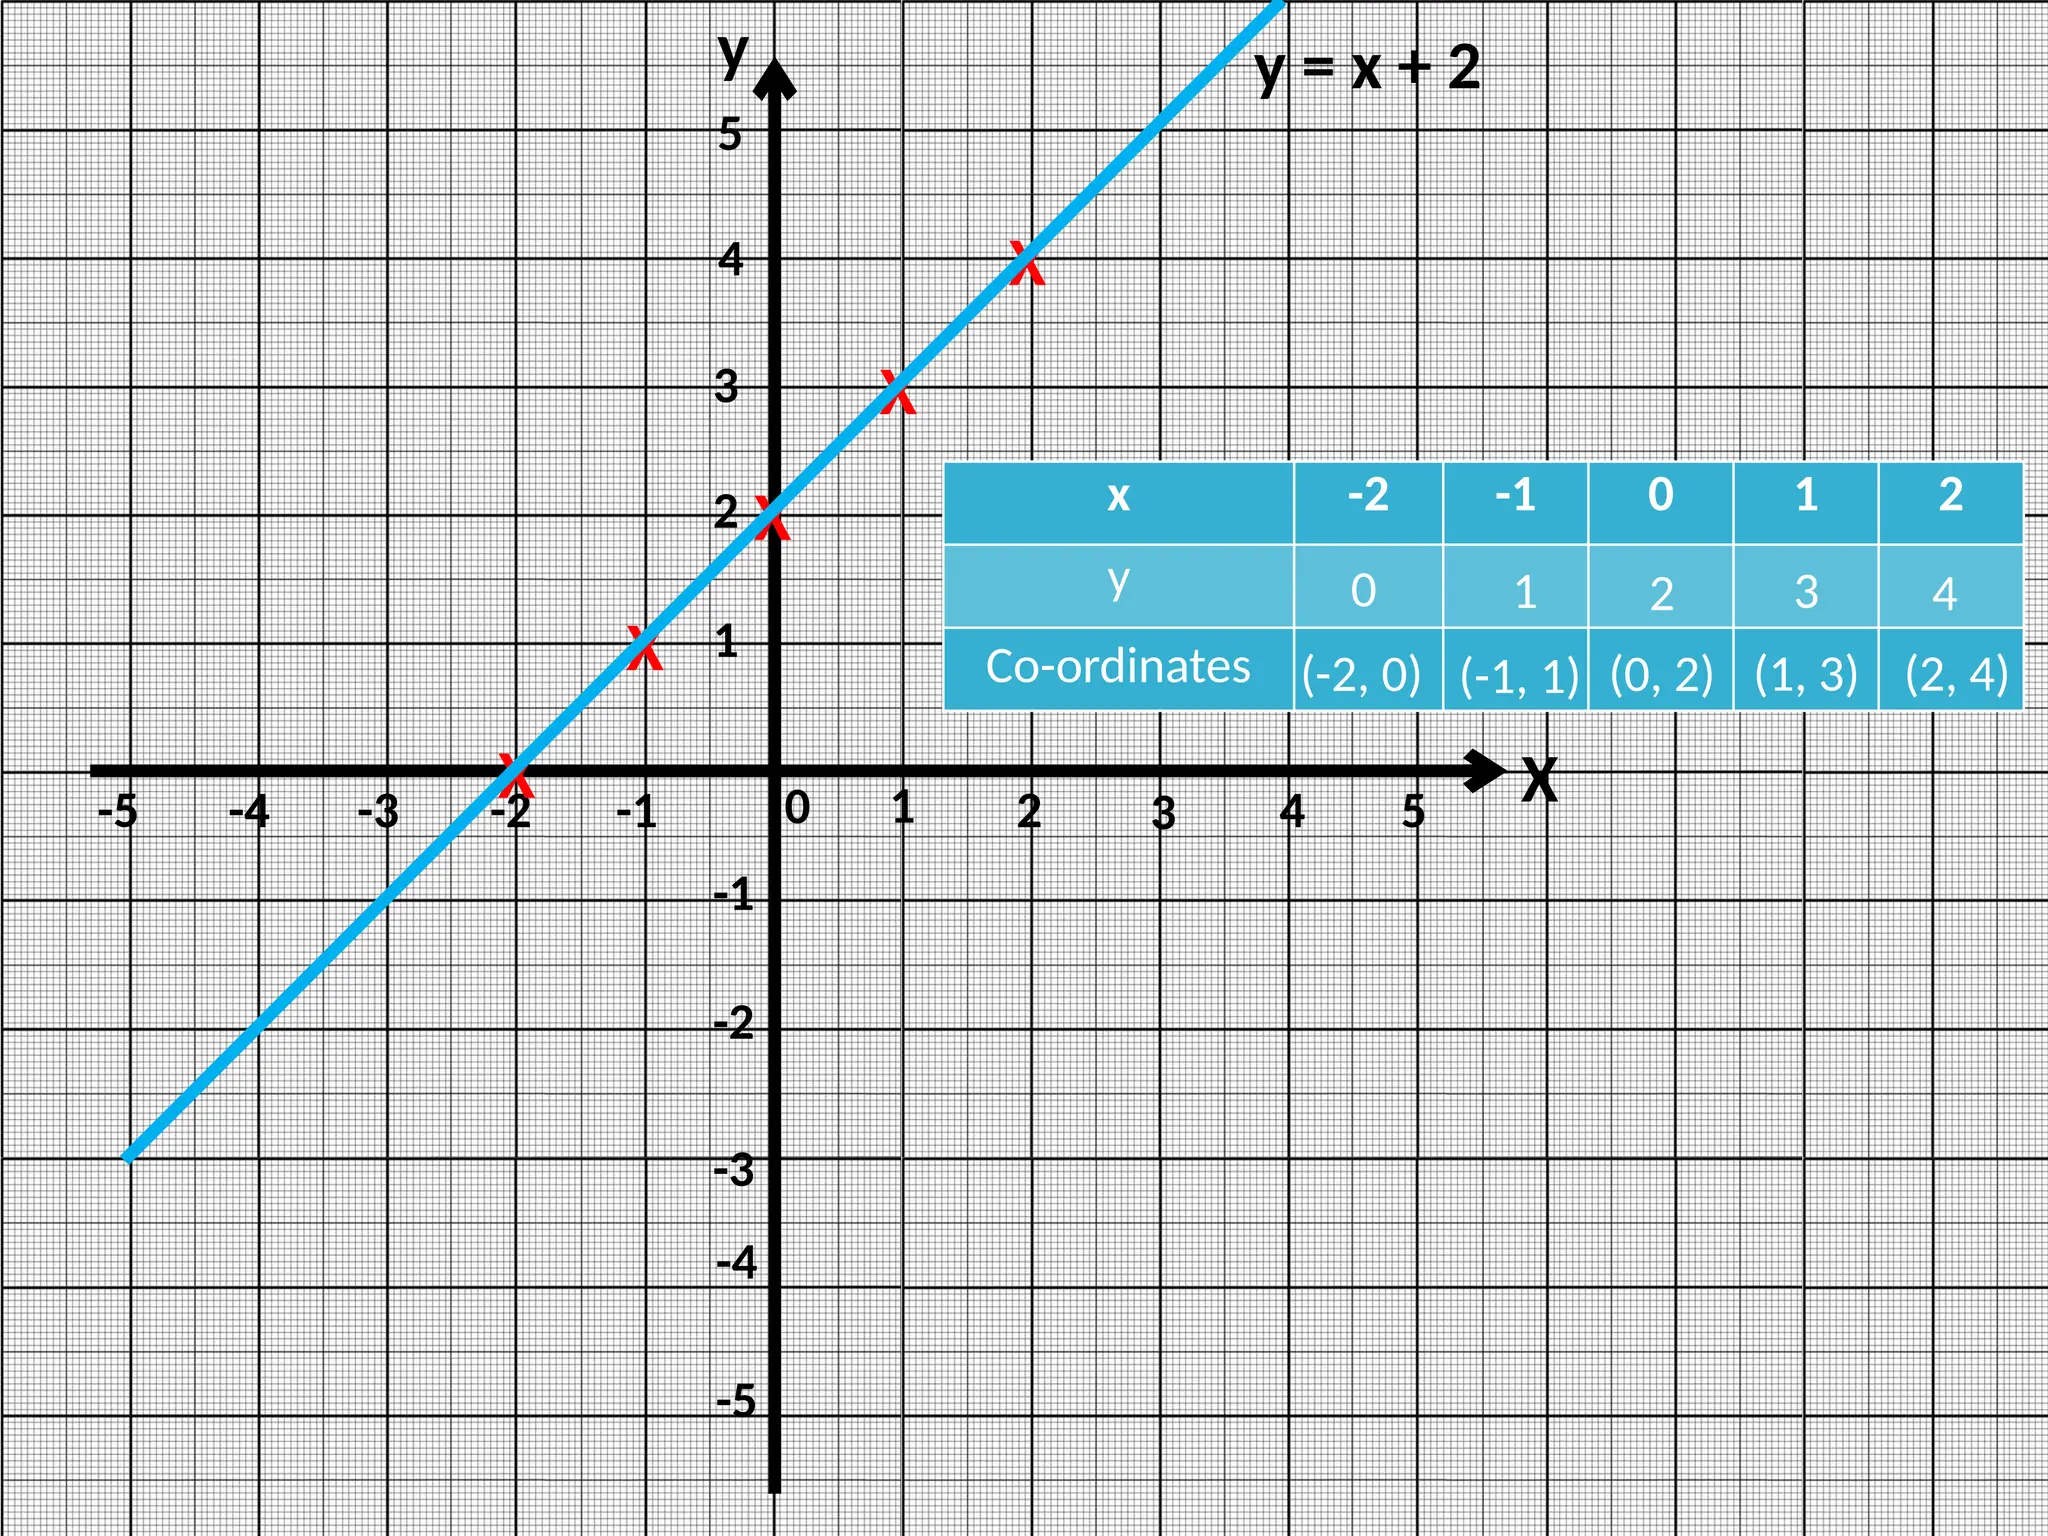
6. Plotting Line Graphs
x -2 -1 0 1 2
y
Co-ordinates
0 1 2 3 4
(-2, 0) (-1, 1) (0, 2) (1, 3) (2, 4)
Now we have some co-ordinates, we can
plot them to draw the line!
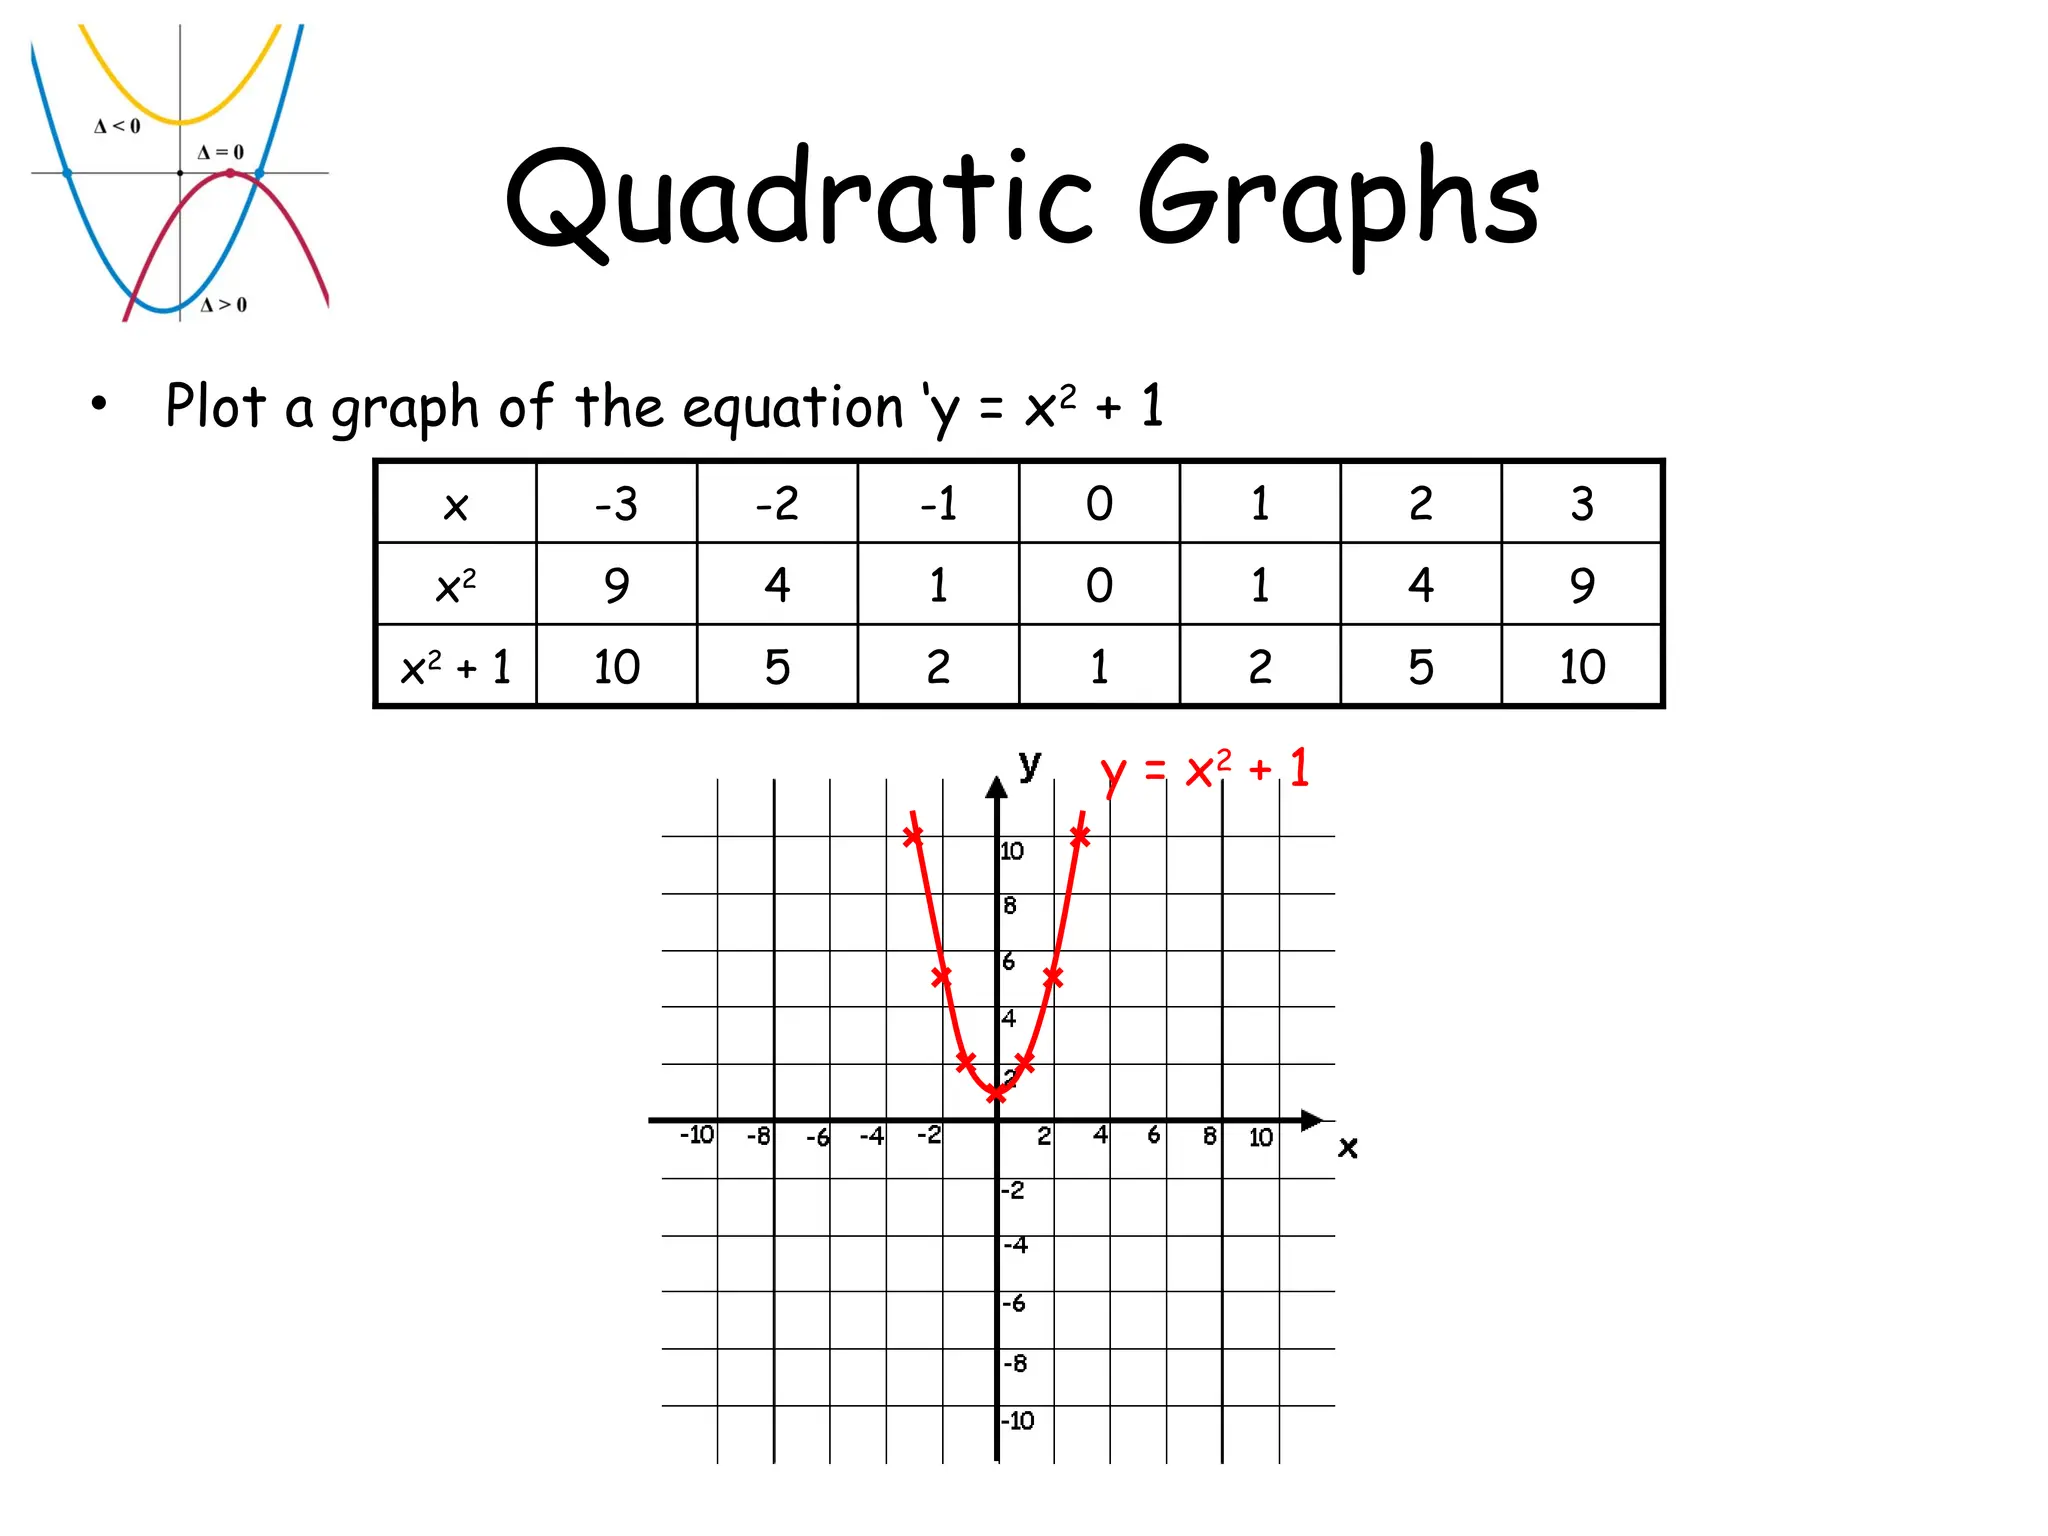
7. 8. Quadratic Graphs
• Plot a graph of the equation ‘y = x2
+ 1
5
4
2
10
2
1
2
5
10
x2
+ 1
9
1
0
1
4
9
x2
3
1
0
-1
-2
-3
x
y = x2
+ 1
9. Quadratic Graphs
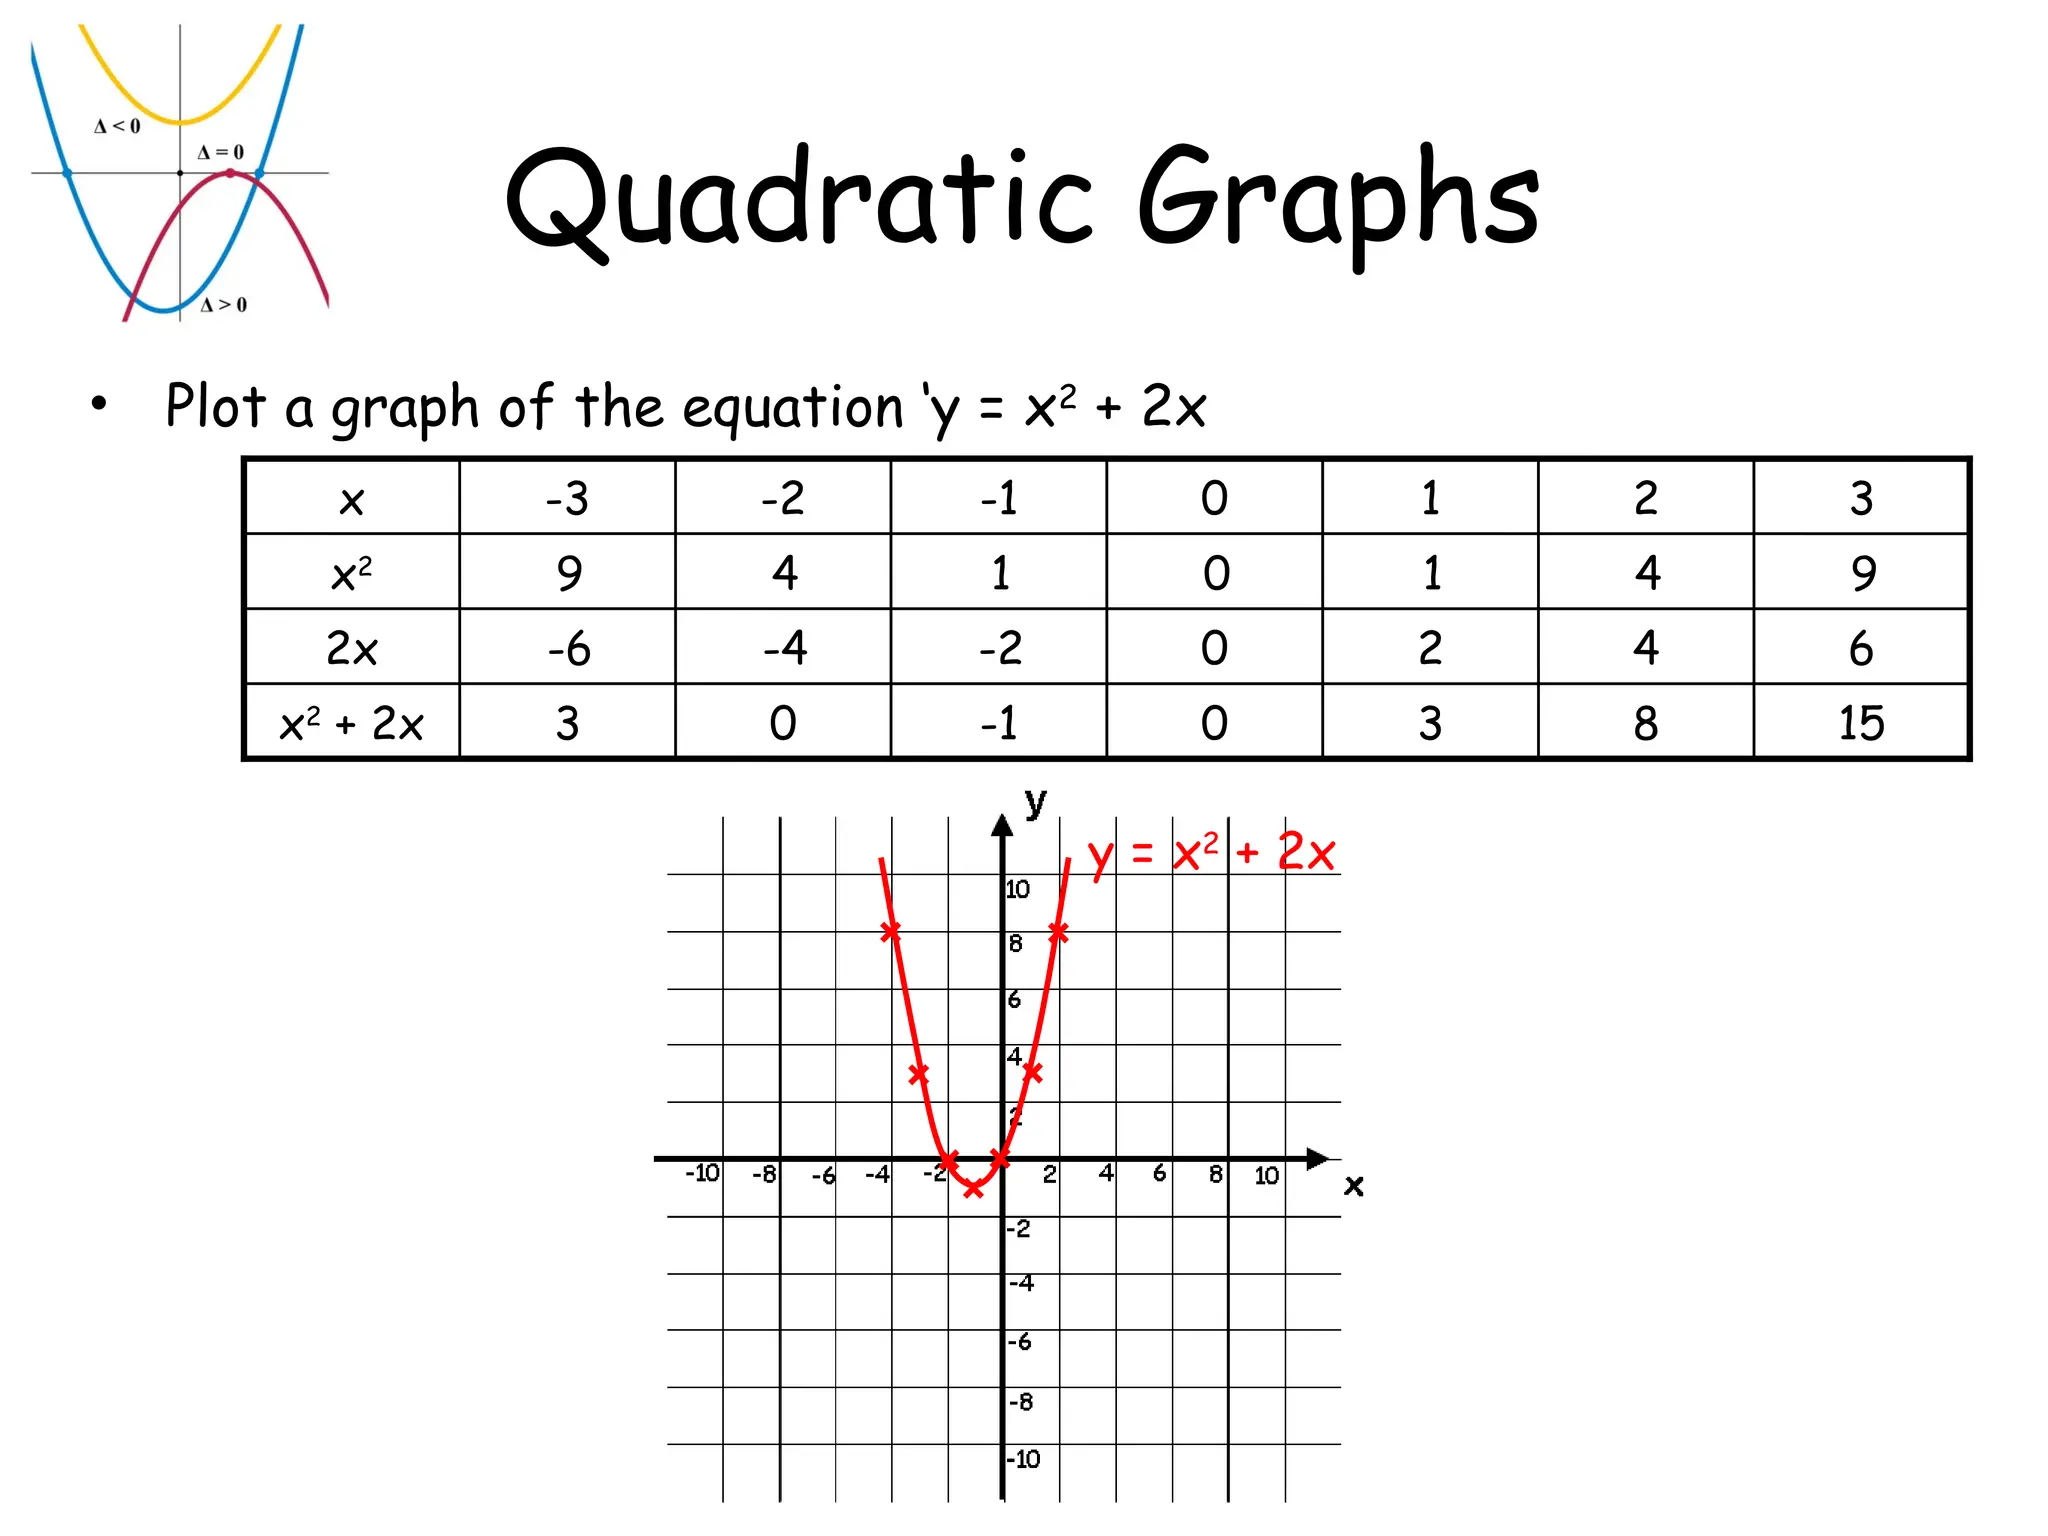
• Plot a graph of the equation ‘y = x2
+ 2x
y = x2
+ 2x
15
8
3
0
-1
0
3
x2
+ 2x
6
4
2
0
-2
-4
-6
2x
9
4
1
0
1
4
9
x2
3
2
1
0
-1
-2
-3
x
10. Quadratic Graphs
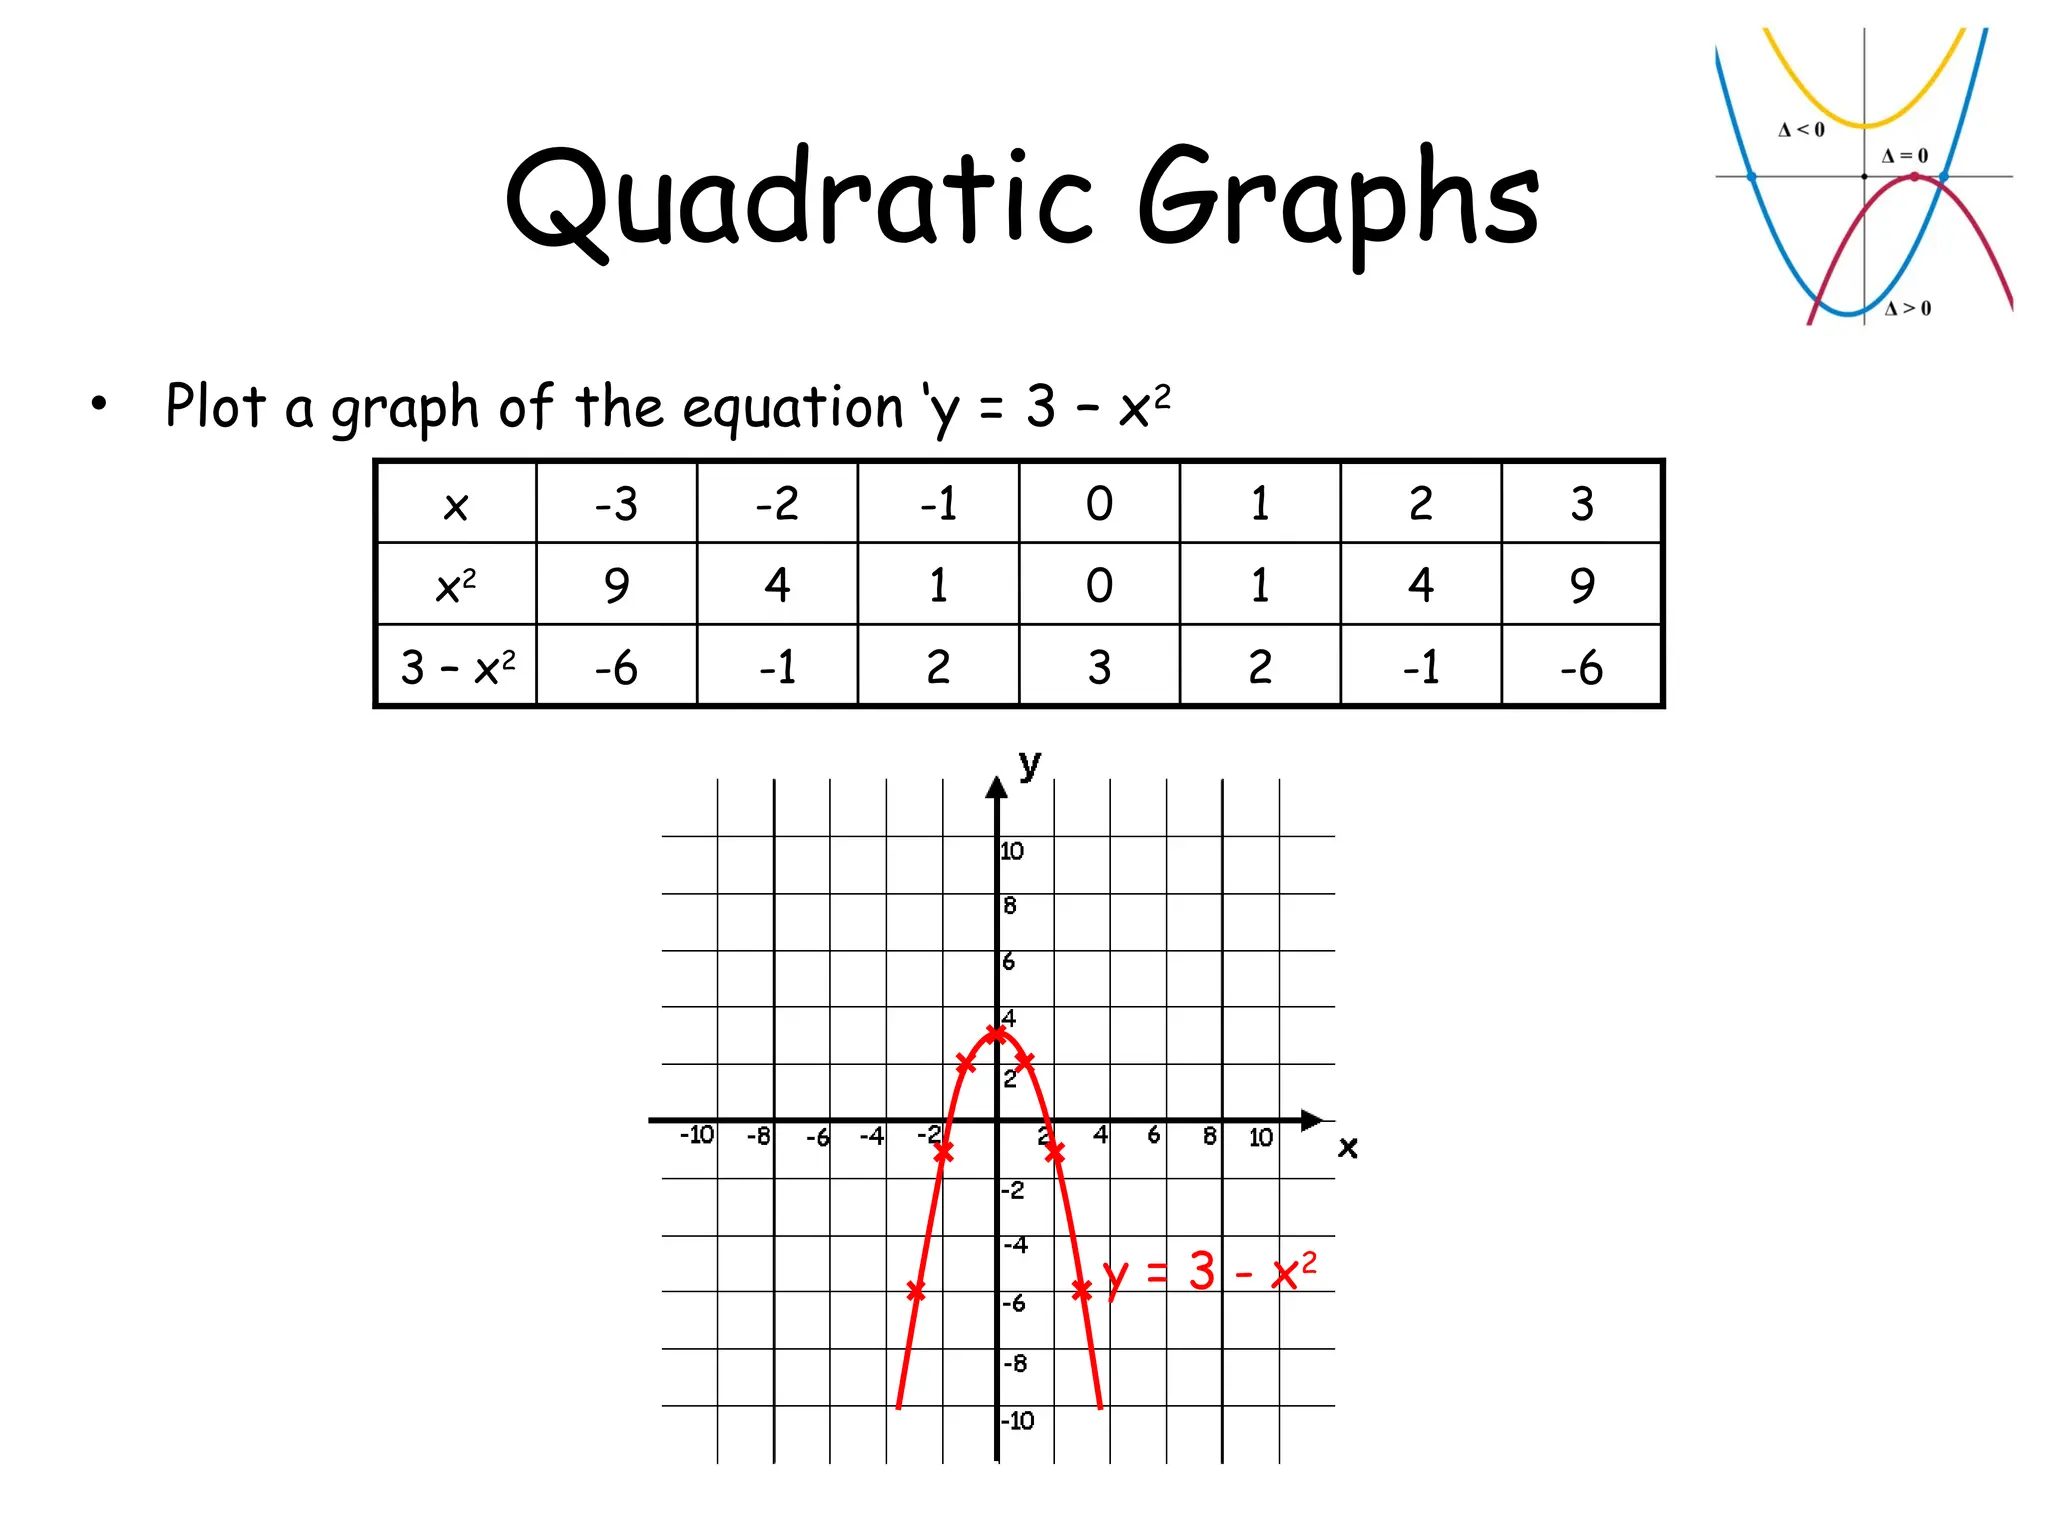
• Plot a graph of the equation ‘y = 3 – x2
-1
4
2
-6
2
3
2
-1
-6
3 – x2
9
1
0
1
4
9
x2
3
1
0
-1
-2
-3
x
y = 3 - x2
11.


![1. SIH2025-IDEA-Presentation-Format[1].pptx](https://cdn.slidesharecdn.com/ss_thumbnails/1-251204091914-b1bb69d5-thumbnail.jpg?width=640&height=640&fit=bounds)


