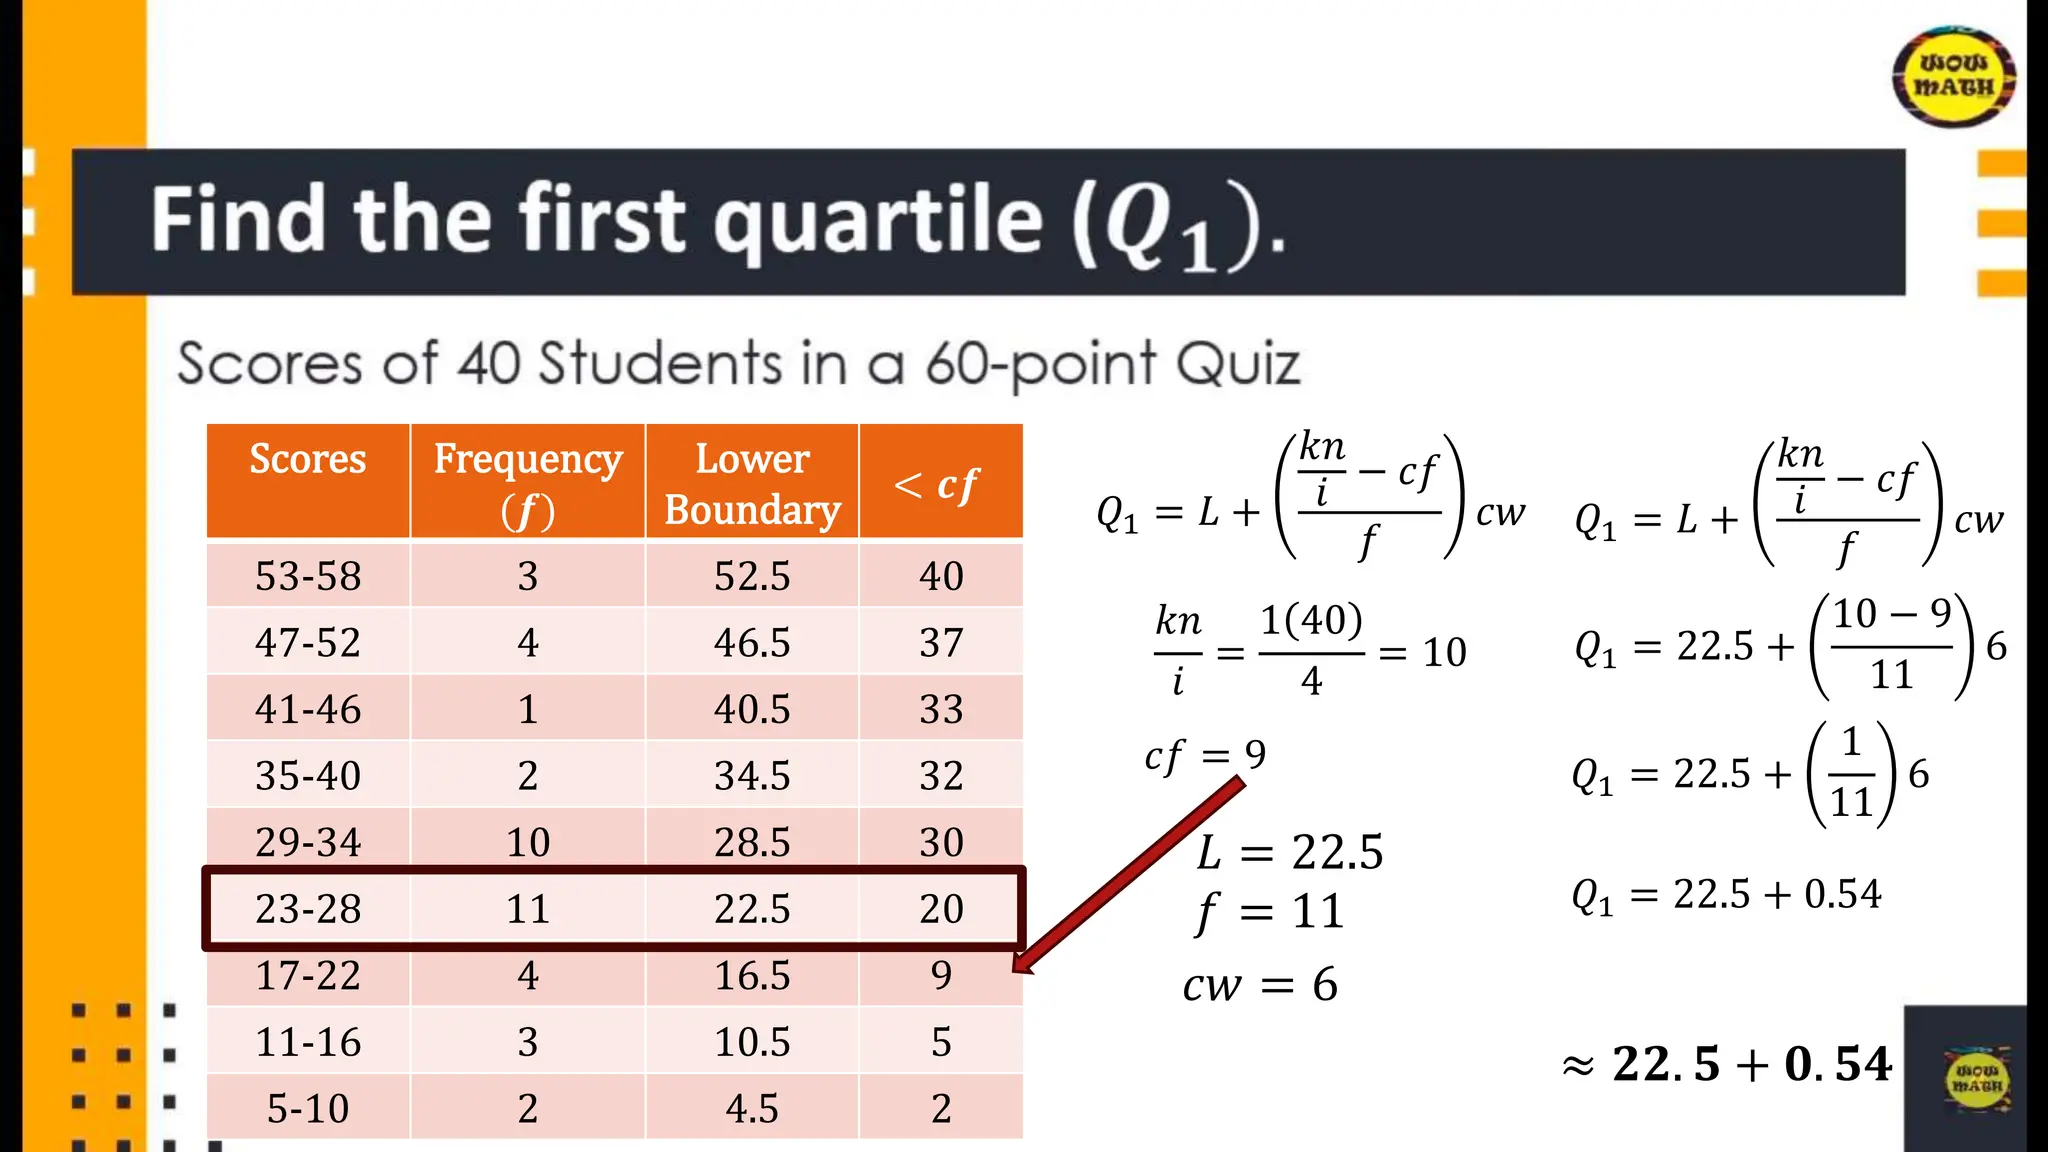
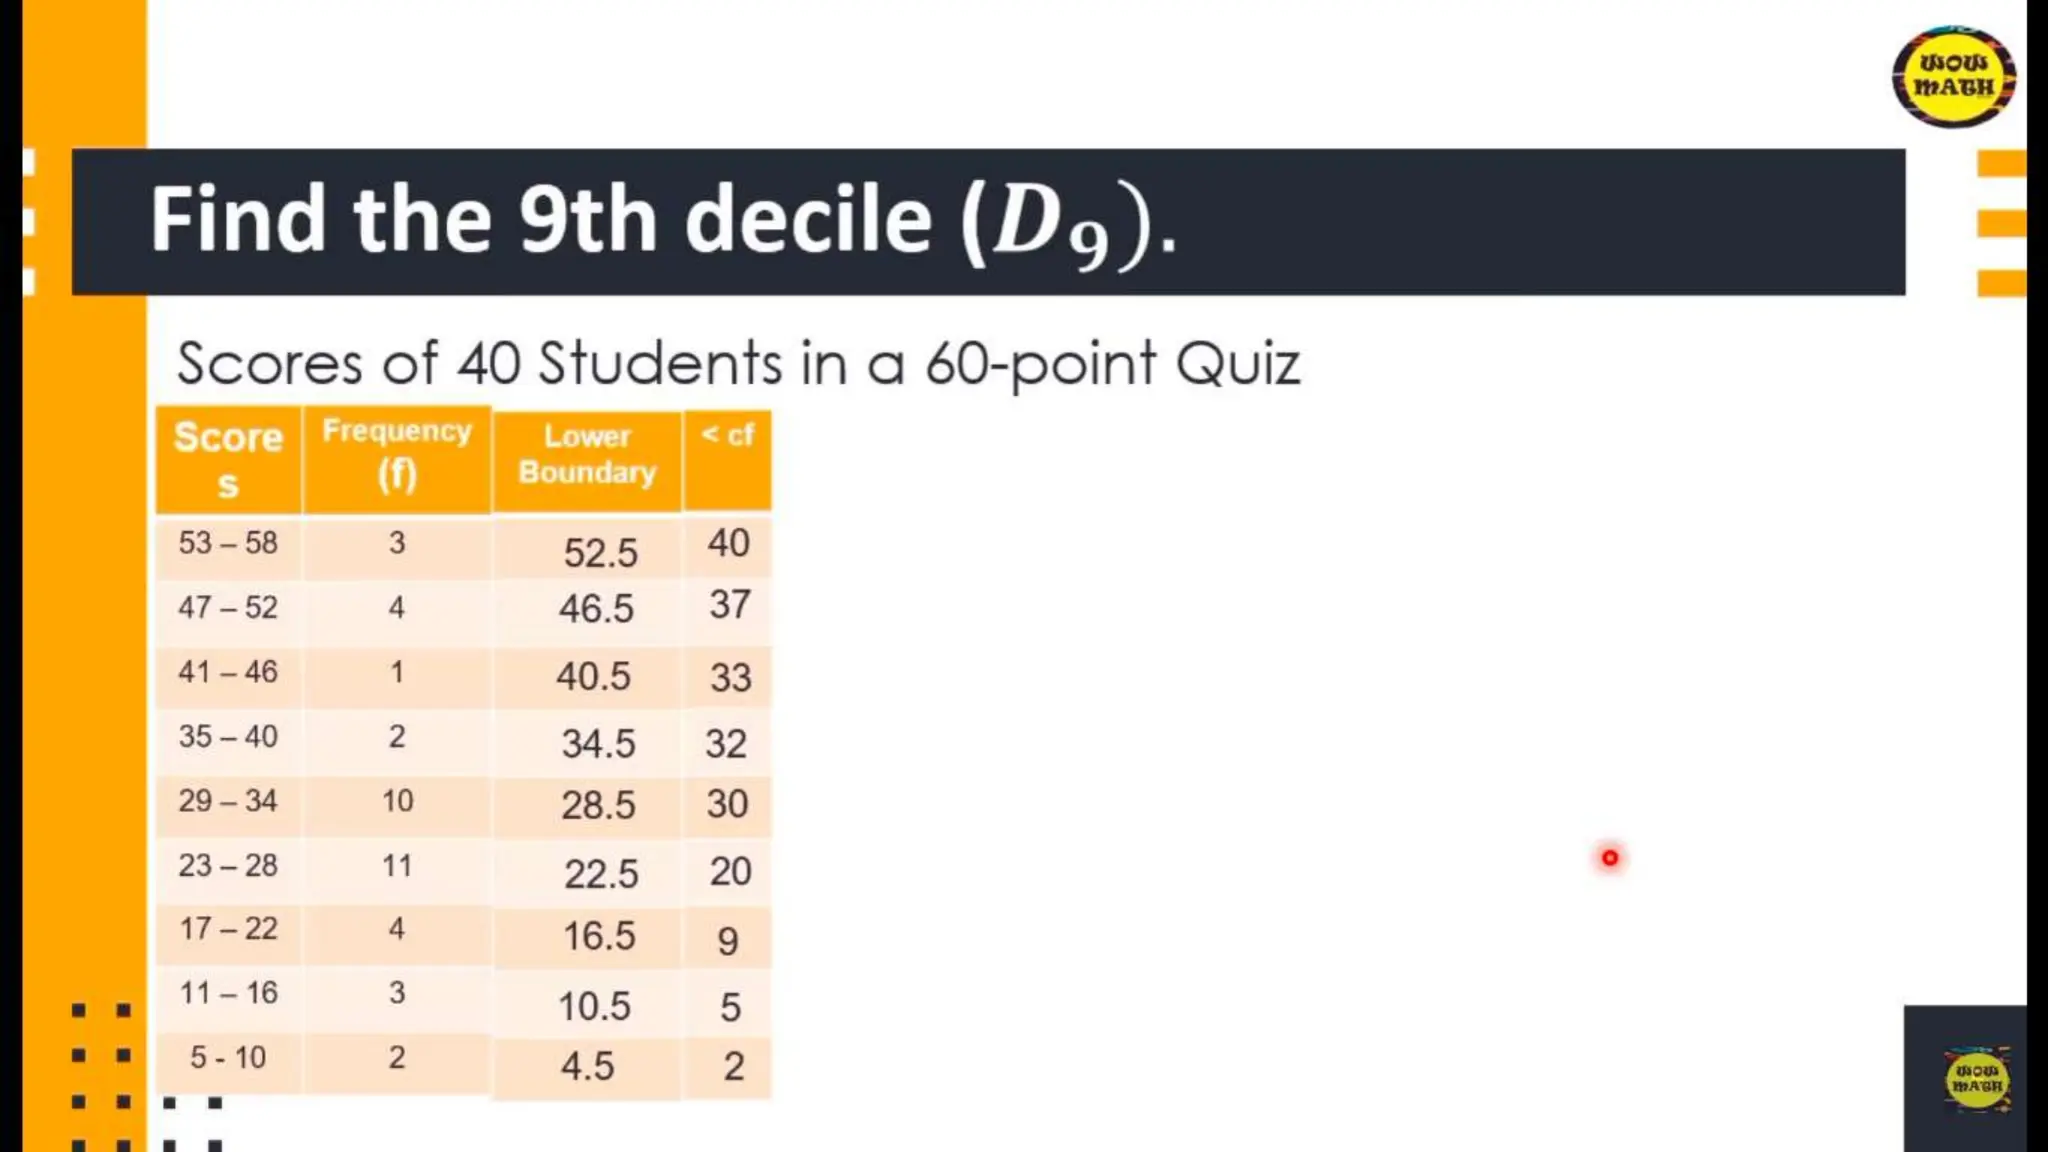
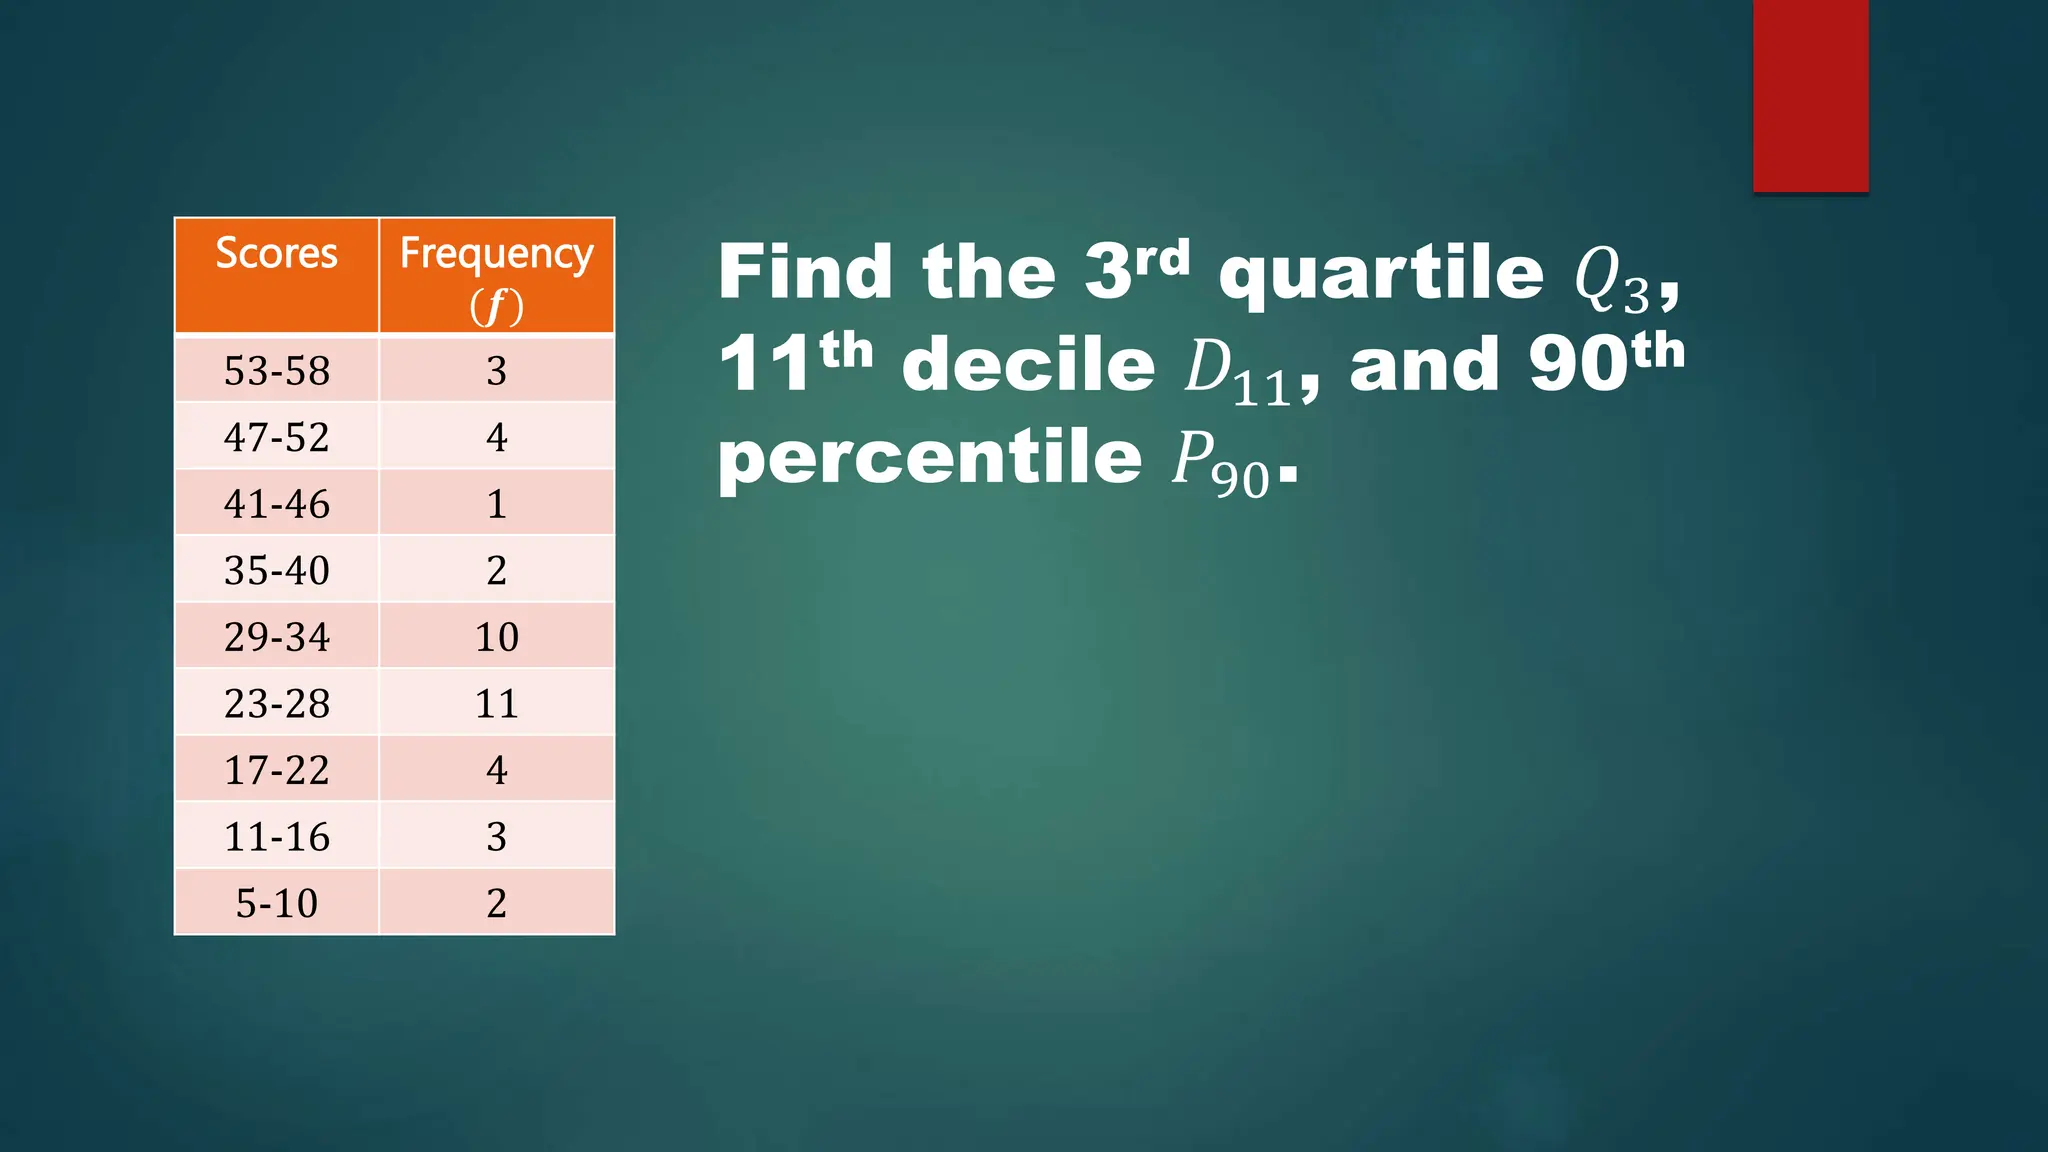
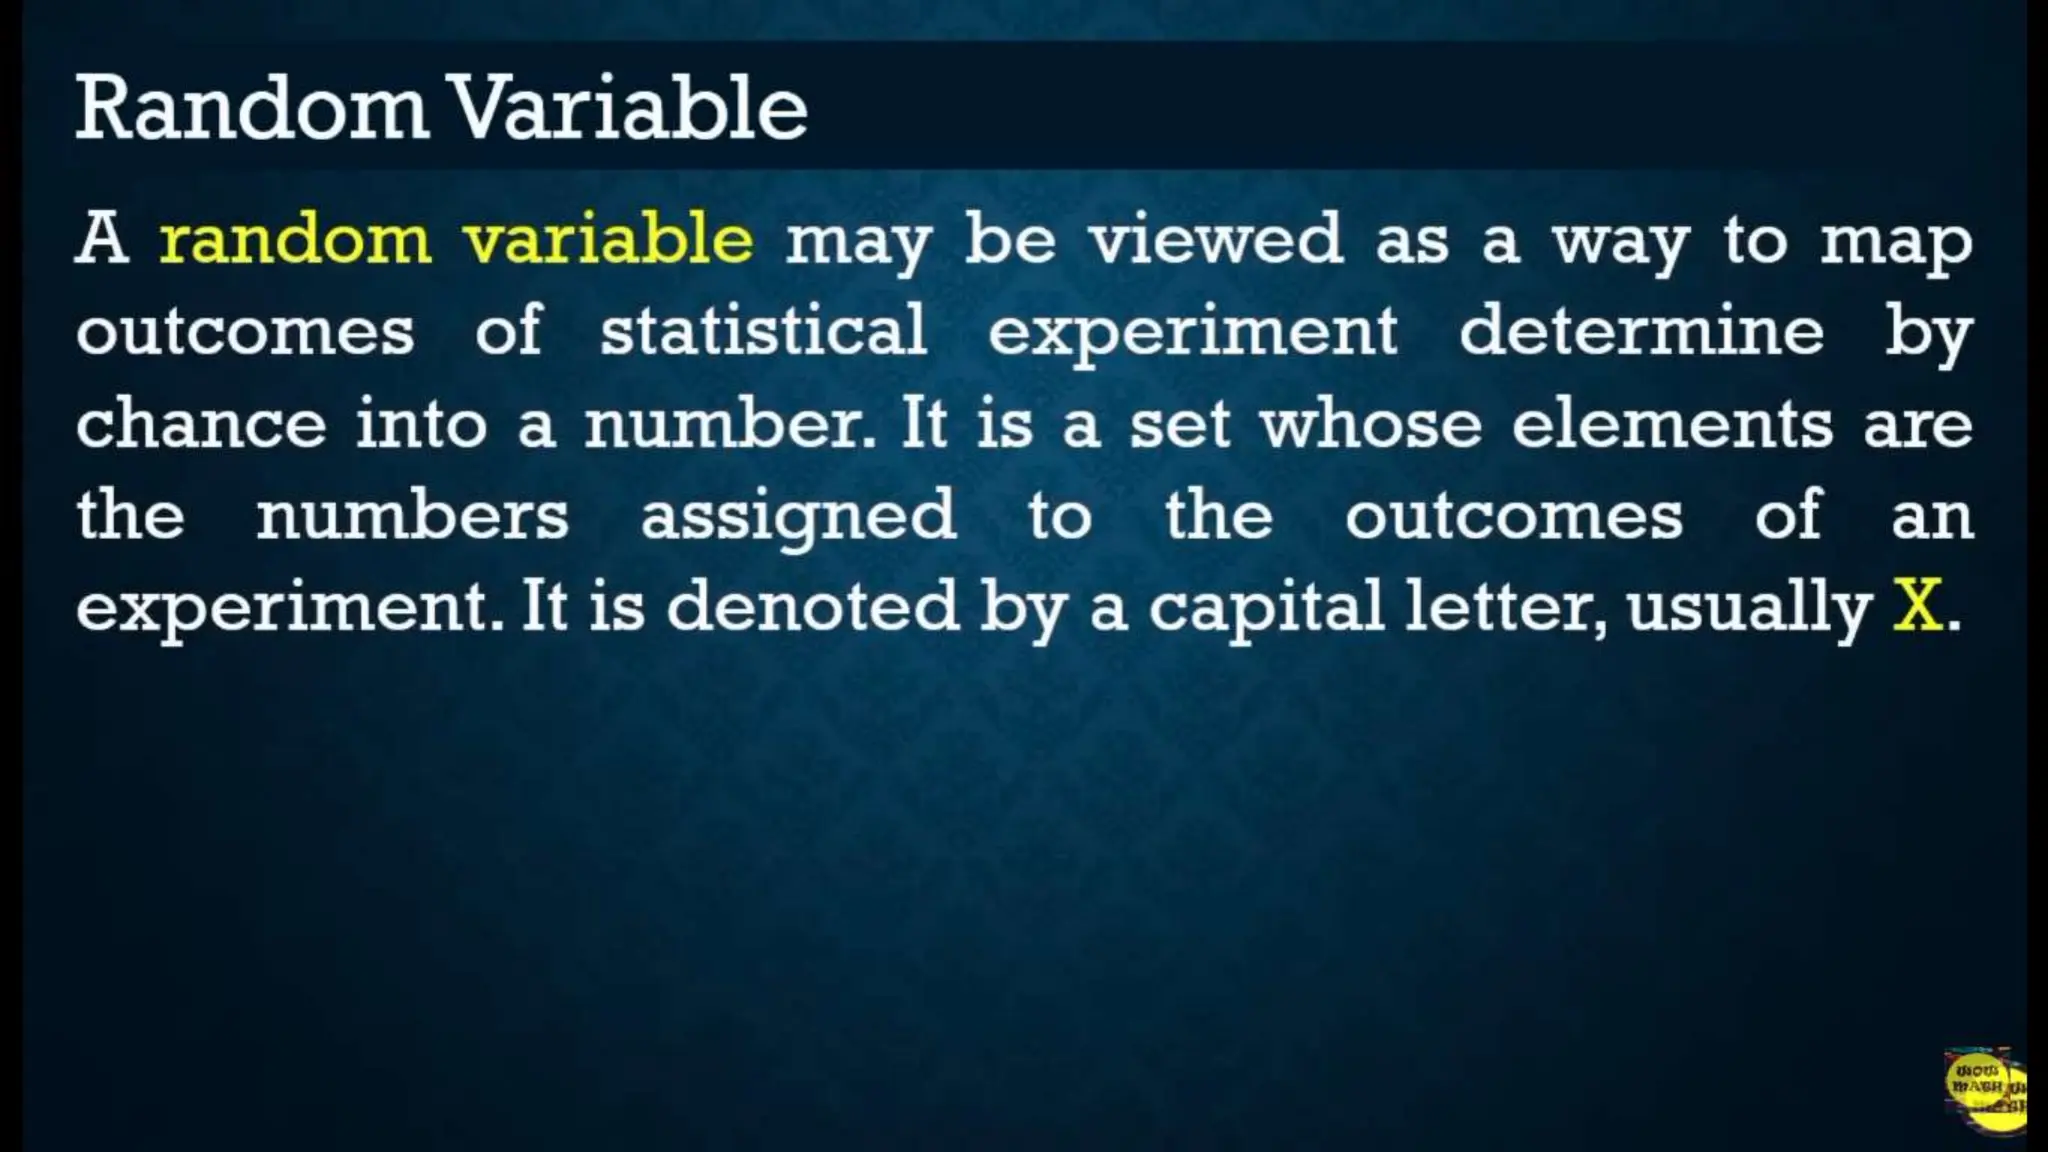
M
E
A
S U
R E
M E A S U R E
P
O S
I T
I O
N
P O S I T I O N
STATISTICS AND PROBABILITY
Measure
- is a standard unit used to express the size,
amount, or degree of something.
Position
- a position class it is all about arranging
a particular position that he/she belong.
Quartile
- the score points which divide a
distribution into four equal parts.
Decile
- a quantitative method of splitting up a set of
ranked data into 10 equally large subsections.
Percentile
- the percentile of data value from a set of data
values is a statistical measure that gives the
percentage of the data values that fall below a
given data.
For example, in a group of 20 children, Ben is the
4th tallest and 80% of the children are shorter than
you. Hence, it means that Ben is at the 80th
percentile.
𝑖 = 4 (Quartiles)
𝑖 = 10 (Deciles)
𝑖 = 100 (Percentiles)
Scores Frequency
(𝒇)
Lower
Boundary
< 𝒄𝒇
53-58 3 52.5 40
47-52 4 46.5 37
41-46 1 40.5 33
35-40 2 34.5 32
29-34 10 28.5 30
23-28 11 22.5 20
17-22 4 16.5 9
11-16 3 10.5 5
5-10 2 4.5 2
𝑄1 = 𝐿 +
𝑘𝑛
𝑖
− 𝑐𝑓
𝑓
𝑐𝑤
𝑘𝑛
𝑖
=
1 40
4
= 10
𝐿 = 22.5
𝑐𝑓 = 9
𝑓 = 11
𝑐𝑤 = 6
𝑄1 = 𝐿 +
𝑘𝑛
𝑖
− 𝑐𝑓
𝑓
𝑐𝑤
𝑄1 = 22.5 +
10 − 9
11
6
𝑄1 = 22.5 +
1
11
6
𝑄1 = 22.5 + 0.54
≈ 𝟐𝟐. 𝟓 + 𝟎. 𝟓𝟒
Scores Frequency
(𝒇)
Lower
Boundary
< 𝒄𝒇
53-58 3 52.5 40
47-52 4 46.5 37
41-46 1 40.5 33
35-40 2 34.5 32
29-34 10 28.5 30
23-28 11 22.5 20
17-22 4 16.5 9
11-16 3 10.5 5
5-10 2 4.5 2
𝑄1 = 𝐿 +
𝑘𝑛
𝑖
− 𝑐𝑓
𝑓
𝑐𝑤
𝑘𝑛
𝑖
− 𝑐𝑓 =
1 40
4
= 10
𝐿 = 22.5
𝑐𝑓 = 9
𝑓 = 11
𝑐𝑤 = 6
𝑄1 = 𝐿 +
𝑘𝑛
𝑖
− 𝑐𝑓
𝑓
𝑐𝑤
𝑄1 = 22.5 +
10 − 9
11
6
𝑄1 = 22.5 +
1
11
6
𝑄1 = 22.5 + 0.54
≈ 𝟐𝟐. 𝟓 + 𝟎. 𝟓𝟒
Scores Frequency
(𝒇)
53-58 3
47-52 4
41-46 1
35-40 2
29-34 10
23-28 11
17-22 4
11-16 3
5-10 2
Find the 3rd quartile 𝑄3,
11th decile 𝐷11, and 90th
percentile 𝑃90.
GUESS THE PICTURE
Guess the hidden word for
each photo.
GUESS THE PICTURE
MEASURE
GUESS THE PICTURE
RELATIVE
GUESS THE PICTURE
POSITION
H
T
H
T
H
T
HH
HT
TH
TT
𝑆𝑎𝑚𝑝𝑙𝑒 𝑆𝑝𝑎𝑐𝑒 = 𝐻𝐻, 𝑇𝐻, 𝐻𝑇, 𝑇𝑇
Possible
Outcomes
Value of Random
Variable 𝑥 (number
of heads)
HH 2
HT 1
TH 1
TT 0
The possible values of the random variable 𝑥 are 0, 1, 2.
𝑋 = {0,1,2}
𝑆𝑎𝑚𝑝𝑙𝑒 𝑆𝑝𝑎𝑐𝑒
= {𝐻𝐻𝐻, 𝐻𝐻𝑇, 𝐻𝑇𝐻, 𝐻𝑇𝑇,
𝑇𝐻𝐻, 𝑇𝐻𝑇, 𝑇𝑇𝐻, 𝑇𝑇𝑇}
Possible Outcomes Value of Random Variable
𝒀 (number of heads)
HHH 0
HHT 1
HTH 1
HTT 2
THH 1
THT 2
TTH 2
TTT 3
𝑌 = {0, 1, 2, 3}
𝑆𝑎𝑚𝑝𝑙𝑒 𝑆𝑝𝑎𝑐𝑒 = {𝑅𝑅, 𝑅𝐵, 𝐵𝑅, 𝐵𝐵}
Possible
Outcomes
Value of Random
Variable 𝒛 (number
of heads)
RR 0
RB 1
BR 1
BB 2
𝑍 = {0, 1, 2}
a. 𝑥: number of even number outcomes in a roll of a die.
𝑋 = {2, 4, 6}
b. 𝑦: weight (in mg) of a powder that does not exceed 80mg.
0 mg ≤ 𝑦 ≤ 80 mg
c. 𝑧: scores of a student in a 10-item test.
𝑍 = {0, 1, 2, 3, 4, 5, 6, 7, 8, 9, 10}
0 1 2 3 4 5
0 0 0 0 0 0 0
1 0 1 2 3 4 5
2 0 2 4 6 8 10
3 0 3 6 9 12 15
4 0 4 8 12 16 20
5 0 5 10 15 20 25
𝑍 = {0, 1, 2, 3, 4, 6, 8, 9, 10, 12, 15, 16, 20, 25}
GRADE11-STATISTICS -AND PROBABILITY.pptx

GRADE11-STATISTICS -AND PROBABILITY.pptx

  • 2.
  • 3.
    M E AS U R E
  • 4.
  • 5.
    P O SI T I O N
  • 6.
  • 7.
    Measure - is astandard unit used to express the size, amount, or degree of something. Position - a position class it is all about arranging a particular position that he/she belong.
  • 8.
    Quartile - the scorepoints which divide a distribution into four equal parts. Decile - a quantitative method of splitting up a set of ranked data into 10 equally large subsections.
  • 9.
    Percentile - the percentileof data value from a set of data values is a statistical measure that gives the percentage of the data values that fall below a given data. For example, in a group of 20 children, Ben is the 4th tallest and 80% of the children are shorter than you. Hence, it means that Ben is at the 80th percentile.
  • 10.
    𝑖 = 4(Quartiles) 𝑖 = 10 (Deciles) 𝑖 = 100 (Percentiles)
  • 11.
    Scores Frequency (𝒇) Lower Boundary < 𝒄𝒇 53-583 52.5 40 47-52 4 46.5 37 41-46 1 40.5 33 35-40 2 34.5 32 29-34 10 28.5 30 23-28 11 22.5 20 17-22 4 16.5 9 11-16 3 10.5 5 5-10 2 4.5 2 𝑄1 = 𝐿 + 𝑘𝑛 𝑖 − 𝑐𝑓 𝑓 𝑐𝑤 𝑘𝑛 𝑖 = 1 40 4 = 10 𝐿 = 22.5 𝑐𝑓 = 9 𝑓 = 11 𝑐𝑤 = 6 𝑄1 = 𝐿 + 𝑘𝑛 𝑖 − 𝑐𝑓 𝑓 𝑐𝑤 𝑄1 = 22.5 + 10 − 9 11 6 𝑄1 = 22.5 + 1 11 6 𝑄1 = 22.5 + 0.54 ≈ 𝟐𝟐. 𝟓 + 𝟎. 𝟓𝟒
  • 12.
    Scores Frequency (𝒇) Lower Boundary < 𝒄𝒇 53-583 52.5 40 47-52 4 46.5 37 41-46 1 40.5 33 35-40 2 34.5 32 29-34 10 28.5 30 23-28 11 22.5 20 17-22 4 16.5 9 11-16 3 10.5 5 5-10 2 4.5 2 𝑄1 = 𝐿 + 𝑘𝑛 𝑖 − 𝑐𝑓 𝑓 𝑐𝑤 𝑘𝑛 𝑖 − 𝑐𝑓 = 1 40 4 = 10 𝐿 = 22.5 𝑐𝑓 = 9 𝑓 = 11 𝑐𝑤 = 6 𝑄1 = 𝐿 + 𝑘𝑛 𝑖 − 𝑐𝑓 𝑓 𝑐𝑤 𝑄1 = 22.5 + 10 − 9 11 6 𝑄1 = 22.5 + 1 11 6 𝑄1 = 22.5 + 0.54 ≈ 𝟐𝟐. 𝟓 + 𝟎. 𝟓𝟒
  • 13.
    Scores Frequency (𝒇) Lower Boundary < 𝒄𝒇 53-583 52.5 40 47-52 4 46.5 37 41-46 1 40.5 33 35-40 2 34.5 32 29-34 10 28.5 30 23-28 11 22.5 20 17-22 4 16.5 9 11-16 3 10.5 5 5-10 2 4.5 2 𝑄1 = 𝐿 + 𝑘𝑛 𝑖 − 𝑐𝑓 𝑓 𝑐𝑤 𝑘𝑛 𝑖 − 𝑐𝑓 = 1 40 4 = 10 𝐿 = 22.5 𝑐𝑓 = 9 𝑓 = 11 𝑐𝑤 = 6 𝑄1 = 𝐿 + 𝑘𝑛 𝑖 − 𝑐𝑓 𝑓 𝑐𝑤 𝑄1 = 22.5 + 10 − 9 11 6 𝑄1 = 22.5 + 1 11 6 𝑄1 = 22.5 + 0.54 ≈ 𝟐𝟐. 𝟓 + 𝟎. 𝟓𝟒
  • 14.
    Scores Frequency (𝒇) 53-58 3 47-524 41-46 1 35-40 2 29-34 10 23-28 11 17-22 4 11-16 3 5-10 2 Find the 3rd quartile 𝑄3, 11th decile 𝐷11, and 90th percentile 𝑃90.
  • 15.
    GUESS THE PICTURE Guessthe hidden word for each photo.
  • 16.
  • 17.
  • 18.
  • 54.
    H T H T H T HH HT TH TT 𝑆𝑎𝑚𝑝𝑙𝑒 𝑆𝑝𝑎𝑐𝑒 =𝐻𝐻, 𝑇𝐻, 𝐻𝑇, 𝑇𝑇 Possible Outcomes Value of Random Variable 𝑥 (number of heads) HH 2 HT 1 TH 1 TT 0 The possible values of the random variable 𝑥 are 0, 1, 2. 𝑋 = {0,1,2}
  • 55.
    𝑆𝑎𝑚𝑝𝑙𝑒 𝑆𝑝𝑎𝑐𝑒 = {𝐻𝐻𝐻,𝐻𝐻𝑇, 𝐻𝑇𝐻, 𝐻𝑇𝑇, 𝑇𝐻𝐻, 𝑇𝐻𝑇, 𝑇𝑇𝐻, 𝑇𝑇𝑇} Possible Outcomes Value of Random Variable 𝒀 (number of heads) HHH 0 HHT 1 HTH 1 HTT 2 THH 1 THT 2 TTH 2 TTT 3 𝑌 = {0, 1, 2, 3}
  • 56.
    𝑆𝑎𝑚𝑝𝑙𝑒 𝑆𝑝𝑎𝑐𝑒 ={𝑅𝑅, 𝑅𝐵, 𝐵𝑅, 𝐵𝐵} Possible Outcomes Value of Random Variable 𝒛 (number of heads) RR 0 RB 1 BR 1 BB 2 𝑍 = {0, 1, 2}
  • 57.
    a. 𝑥: numberof even number outcomes in a roll of a die. 𝑋 = {2, 4, 6} b. 𝑦: weight (in mg) of a powder that does not exceed 80mg. 0 mg ≤ 𝑦 ≤ 80 mg c. 𝑧: scores of a student in a 10-item test. 𝑍 = {0, 1, 2, 3, 4, 5, 6, 7, 8, 9, 10}
  • 58.
    0 1 23 4 5 0 0 0 0 0 0 0 1 0 1 2 3 4 5 2 0 2 4 6 8 10 3 0 3 6 9 12 15 4 0 4 8 12 16 20 5 0 5 10 15 20 25 𝑍 = {0, 1, 2, 3, 4, 6, 8, 9, 10, 12, 15, 16, 20, 25}