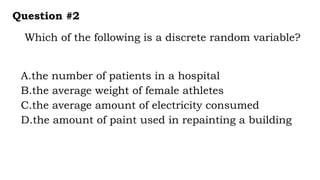
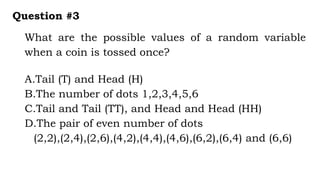
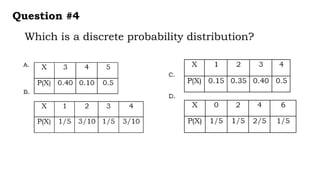
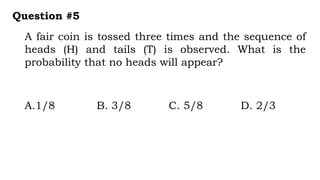
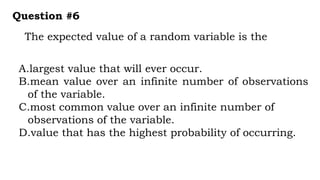
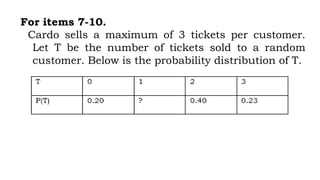
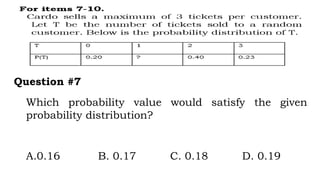
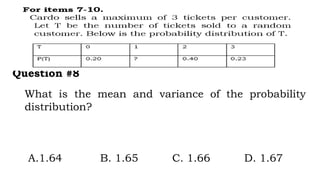
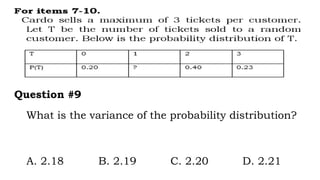
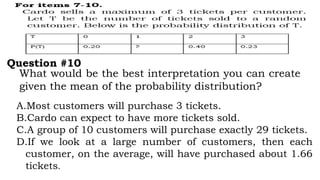
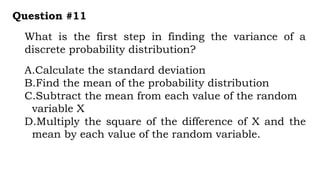
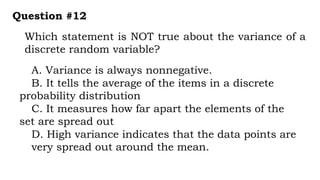
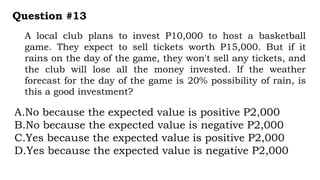
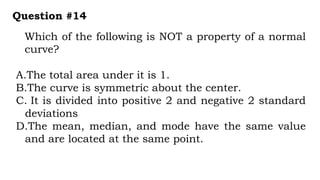
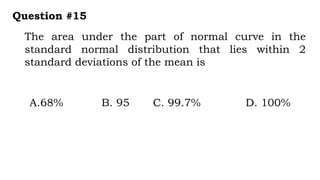
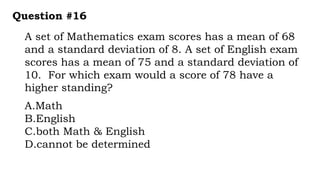
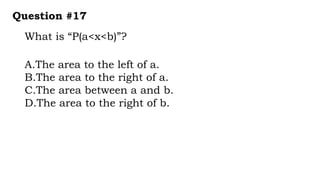
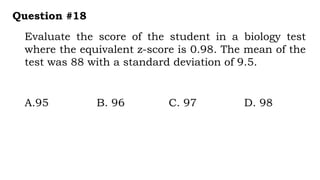
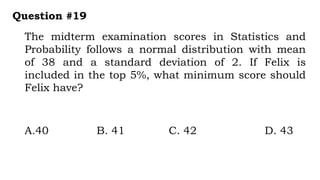
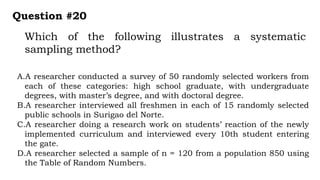
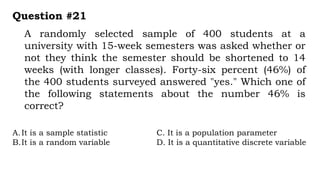
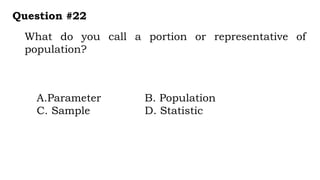
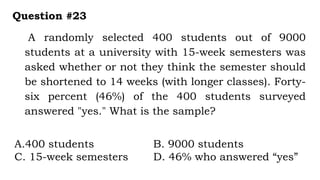
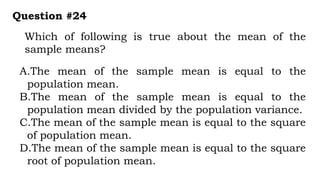
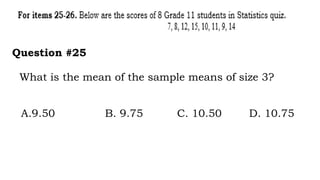
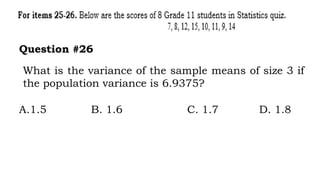
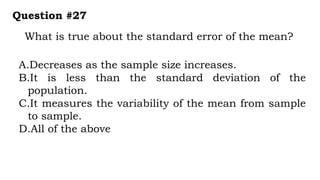
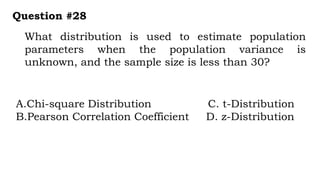
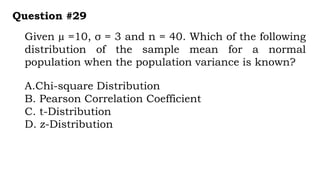
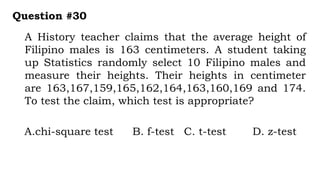
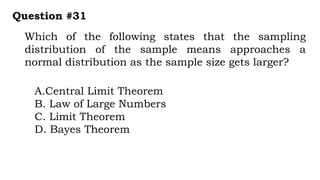
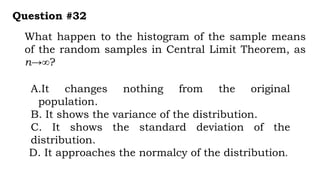
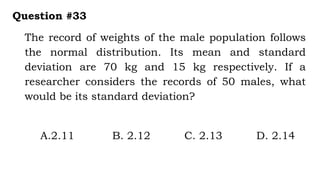
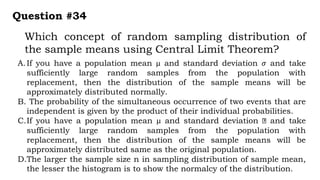
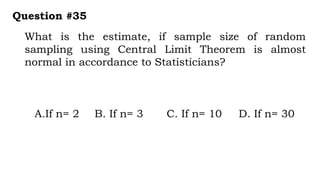
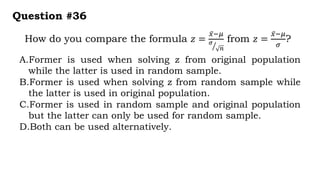
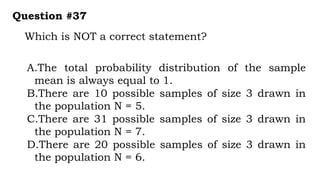
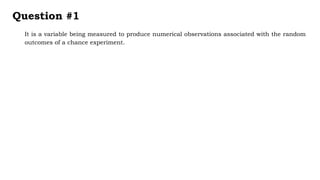
This document contains a review for a statistics and probability exam for senior high school students. It includes 34 multiple choice questions covering topics like random variables, probability distributions, the central limit theorem, hypothesis testing, and sampling. The questions assess understanding of key concepts in statistics such as means, variances, standard deviations, z-scores, t-tests, and the normal distribution.
This Mathematics Learner's module discusses about the basic concepts of Probability and its strategies. It also teaches includes some examples about Probability.
As we have learned in the previous lesson, Statistics is a science that studies data. Hence to teach Statistics, real data set is recommend to use. In this lesson, we present an activity where the students will be asked to provide some data that will be submitted for consolidation by the teacher for future lessons. Data on heights and weights, for instance, will be used for calculating Body Mass Index in the integrative lesson. Students will also be given the perspective that the data they provided is part of a bigger group of data as the same data will be asked from much larger groups (the entire class, all Grade 11 students in school, all Grade 11 students in the district). The contextualization of data will also be discussed.
1. US Census statistics show that college graduates make more than $.docxelliotkimberlee
1. US Census statistics show that college graduates make more than $254,000 more intheir lifetime than non-college graduates. If you were to question the validity ofthis observation, what would be your basis for doing so?
A. Definition of a college graduate
B. Work lifestyles of the population
C. Defining “lifetime”
D. How the Census was taken
2. The average age in a sample of 190 students at City College is 22. As a result of this sample, it can be concluded that the average age of all the students at City College
A. must be more than 22, since the population is always larger than the sample
B. must be less than 22, since the sample is only a part of the population
C. could not be 22
D. could be larger, smaller, or equal to 22
3. Since a sample is a subset of the population, the sample mean
A. is always smaller than the mean of the population
B. is always larger than the mean of the population
C. must be equal to the mean of the population
D. can be larger, smaller, or equal to the mean of the population
Use the following situation for Questions 4-7. Michael, Inc., a manufacturer ofelectric defibrillators, is a firm that makes 50 types of electric defibrillators . Thetable below shows the price distribution of the defibrillators .
Price (In $) Number of Defibrillators
100 – 130 8
140 - 170 12
180 - 210 20
220 - 250 10
TOTAL 761.22
Select from the following choices for Questions 4-7. Use letter only in the blank.
A. 32 B. 50% C. 20 D. 30 E. 16% F. 10 G. 60% H. 50
4. How many defibrillators have a price of at least $180?__ D. _____
5. What percentage of the defibrillators has a price of at least $180? ___%___
6. What percentage of the defibrillators has a price of less than $140? ___ E. __
7. How many defibrillators cost at least $140 but no more than $210? __ A. ____
8. Temperature is an example ofa quantitative variable
A. a qualitative variable
B. a quantitative variable
C. either a quantitative or qualitative variable
D. neither a quantitative nor qualitative variable
Use the following situation for Questions 9 and 10.
The following frequency distribution shows the frequency of outbreaks of the11 virus (statistics flu) for the following households in a small rural community.
Households 1134 406 168 41 25 12 : 1786
Outbreaks 0 1 2 3 4 5
9.
Use the frequency distribution to construct a probability distribution by filling in
the blanks below.
x 0 1 2 3 4 5
P(x) P(0) = P(1) = P(2) = P(3) = P(4) = P(5) =
10. Compute the mean and the standard deviation and select from the following the appropriate interpretation of the results (select best response)
A. A household on the average has 0.9 outbreaks with a standard deviation of.6 outbreaks
B. A household on the average has 0.6 outbreaks with a standard deviation of12 outbreaks
C. A household on the average has 0.9 outbreaks with a standard deviation of.9 outbreaks
D. A household on the average has 0.6 outbreaks with a standard deviation of.9 outbreaks
Use the following situ.
Statistics
Summer 2019
Name: Cindy Charles
Multiple choice section:
1. A researcher is interested in studying the eating behavior of a rats and selects a group of 25 rats to be tested in a research study. The group of 25 rates is an example of a
a. sample
.
b. statistic
c. population
d. parameter
2. A researcher uses an anonymous survey to investigate the study habits of the American college students. The entire group of American college students is an example of a
a. sample
.
b. statistic
c. population
d. parameter
3. A characteristic, usually a numerical value, that describes a sample is called a
a. sample
.
b. statistic
c. population
d. parameter
4. Determining the class standing for the graduating seniors at a high school would involve measurement on a(n) ____________ scale of measurement.
a. nominal
.
b. ordinal
c. interval
d. ratio
5. A researcher conducts a study to determine whether moderate doses of St. John’s Wort have any effect on memory in college students. For this study, with is the independent variable?
a. the amount of St. John’s Wort given to each participant.
b. the memory score for each participant
c. the group of college students
d. cannot answer without more information.
6. When we are interested in simply looking at the association or relationship between two contiguous variables as they exist naturally , the following research method is likely to be helpful:
a. correlational
b. experimental
c. quasi-experimental
d. non-parametric
7. In an experiment looking at the effect of eating varied levels of multiple portions of ice cream, daily, on blood serum cholesterol levels (HDL)
a. eating ice cream is the independent variable (IV) and HDL is the dependent variable (DV).
b. ice cream, the DV and HDL, the IV
c. neither, this is a correlational study
d. ice cream and HDL are both independent variables
8. “Girl, boy, girl, girl, boy, boy, boy, girl. So, there’s 4 girls and 4 boys.” Our enumerator is employing which of the following scales
a. ratio
b. sex differential
c. interval
d. nominal
9. “I came in first place in the “Best Statistics Professor” category. That clearly shows I am much better at this than most other professors on campus.”
a. This is a reasonable conclusion, since first place in Statistics must be a higher rating than, say, third place in Multicultural Education.
b. The speaker mistakenly attributes arithmetic characteristics to ordinal data.
c. The statement has absolutely no meaning, since we do not know the number of other professors on campus or teaching statistics. It represents an example of the absolute or ratio scale.
d. The interval scale applies here, because voters used a relative standar.
Part 1 Please circle the correct answer.1. Which of t.docxherbertwilson5999
Part 1: Please circle the correct answer.
1. Which of the following is most sensitive to outliers?
a. interquartile range b.standard deviation. c. median
d. mode
2. James and George took a math exam. George’s percentile score on the exam was 80; James’s
percentile score was 40 on the same test. We know that
a) George correctly answered twice as many questions than James. b) They both scored better than 40 of their classmates.
c) George correctly answered more questions than James. d) James did not pass the test.
3. Find the mean and standard deviation for a binomial experiment where n 260,
p 0.675 .
a) 260 , b) 260 ,
7.55
57.04
c) 175.50 ,
7.55
d) 97.50 ,
e) 175.50 ,
13.25
9.19
4. If we were to create a box plot, which of the following statement(s) would be true?
A. The median would be located somewhere within the box.
B. The median value would be larger than the third quartile value (Q3) C. The median would always be centered in the middle of the box.
D. The median would indicate where the 50th percentile would be.
a) A and B
b) All of them. c) A and D
d) C and D.
e) None of them.
5. Which of these statements are false?
a. There is a strong linear relationship between gender and height because we found a correlation of .55.
b. Plant height and leaf height were found to be negatively correlated because the correlation coefficient is -1.41.
c. Since the correlation between X and Y is 0, this means there is no relationship whatsoever between these two variables.
d. All of the above.
e. None of the above.
6. Some methods may be used to make a confidence interval wider or narrower. Circle the two
methods that would decrease the width of a confidence interval for a mean, if all else stays the same.
a. Increase the sample size. b. decrease the sample size.
c. increase the level of confidence. d. decrease the level of confidence.
7. Two researchers are going to take a sample of data from the same population of physics students. Researcher A will select a random sample of students from among all students taking physics. Researcher B's sample will consist only of the students in her class. Both researchers will construct a 95% confidence interval for the mean score on the physics final exam using their own sample data. Which researcher's method has a 95% chance of capturing the true mean of the population of all students taking physics?
a. Both methods have a 95% chance of capturing the true mean b. Researcher A
c. Research B
d. Neither
8. A 98% confidence interval indicates that:
a. 98% of the intervals constructed using this process based on samples from this population will include the population mean
b. 98% of the time the interval will include the sample mean
c. 98% of the possible population means will be included by the interval
9. A one-tailed hypothesis test is performed using a 0.10 level of significance. .
1) Those methods involving the collection, presentation, and chara.docxdorishigh
1) Those methods involving the collection, presentation, and characterization of a set of data in order to properly describe the various features of that set of data are called
A) statistical inference.
B) the scientific method.
C) sampling.
D) descriptive statistics.
Answer: D
2) Which of the following is NOT an element of descriptive statistical problems?
A) an inference made about the population based on the sample
B) the population or sample of interest
C) tables, graphs, or numerical summary tools
D) identification of patterns in the data
Answer: A
3) Most analysts focus on the cost of tuition as the way to measure the cost of a college education. But incidentals, such as textbook costs, are rarely considered. A researcher at Drummand University wanted to estimate the textbook costs of first-year students at Drummand. To do so, she monitored the textbook cost of 250 first-year students and found that their average textbook cost was $600 per semester. Identify the population of interest to the researcher.
A) all Drummand University students
B) all college students
C) all first-year Drummand University students
D) the 250 students that were monitored
Answer: C
4) Researchers are concerned that the weight of the average American school child is increasing, implying, among other things, that children's clothing should be manufactured and marketed in larger sizes. If X is the weight of school children sampled in a nationwide study, then X is an example of
A) a categorical random variable.
B) a discrete random variable.
C) a continuous random variable.
D) a parameter.
Answer: C
5) The chancellor of a major university was concerned about alcohol abuse on her campus and wanted to find out the proportion of students at her university who visited campus bars on the weekend before the final exam week. Her assistant took a random sample of 250 students. The answer on "whether you visited campus bars on the weekend before the final exam week" from students in the sample is an example of
A) a categorical random variable.
B) a discrete random variable.
C) a continuous random variable.
D) a parameter.
Answer: A
6) The British Airways Internet site provides a questionnaire instrument that can be answered electronically. Which of the four methods of data collection is involved when people complete the questionnaire?
A) published sources
B) experimentation
C) surveying
D) observation
Answer: C
7) A professor of economics at a small Texas university wanted to determine what year in school students were taking his tough economics course. Shown below is a pie chart of the results. What percentage of the class took the course prior to reaching their senior year?
A) 14%
B) 44%
C) 54%
D) 86%
Answer: D
8) One of the developing countries is experiencing a baby boom, with the number of births rising for the fifth year in a row, according to a BBC News report. Which of the following is best for displaying this data?
A) a Pareto chart
B) a two-way cl ...
QNT 351 Final Exam Answers 2015 versionvincenzwhaley
QNT 351 Final Exam Answers
1) The main purpose of descriptive statistics is to
A. summarize data in a useful and informative manner
B. make inferences about a population
C. determine if the data adequately represents the population
D. gather or collect data
2) The general process of gathering, organizing, summarizing, analyzing, and interpreting data is called
A. statistics
B. descriptive statistics
C. inferential statistics
D. levels of measurement
3) The performance of personal and business investments is measured as a percentage, return on investment. What type of variable is return on investment?
A. Qualitative
B. Continuous
C. Attribute
D. Discrete
4) What type of variable is the number of robberies reported in your city?
A. Attribute
B. Continuous
C. Discrete
D. Qualitative
5) What level of measurement is the number of auto accidents reported in a given month?
A. Nominal
B. Ordinal
C. Interval
D. Ratio
6) The names of
QNT 351 Final Exam Answers 2015 versioncelestiaorias
QNT 351 Final Exam Answers
1) The main purpose of descriptive statistics is to
A. summarize data in a useful and informative manner
B. make inferences about a population
C. determine if the data adequately represents the population
D. gather or collect data
2) The general process of gathering, organizing, summarizing, analyzing, and interpreting data is called
A. statistics
B. descriptive statistics
C. inferential statistics
D. levels of measurement
3) The performance of personal and business investments is measured as a percentage, return on investment. What type of variable is return on investment?
A. Qualitative
B. Continuous
C. Attribute
D. Discrete
4) What type of variable is the number of robberies reported in your city?
A. Attribute
B. Continuous
C. Discrete
D. Qualitative
5) What level of measurement is the number of auto accidents reported in a given month?
A. Nominal
B. Ordinal
C. Interval
D. Ratio
6) The names of
QNT 351 Final Exam Answers 2015 versionmahallbethena
QNT 351 Final Exam Answers
1) The main purpose of descriptive statistics is to
A. summarize data in a useful and informative manner
B. make inferences about a population
C. determine if the data adequately represents the population
D. gather or collect data
2) The general process of gathering, organizing, summarizing, analyzing, and interpreting data is called
A. statistics
B. descriptive statistics
C. inferential statistics
D. levels of measurement
3) The performance of personal and business investments is measured as a percentage, return on investment. What type of variable is return on investment?
A. Qualitative
B. Continuous
C. Attribute
D. Discrete
4) What type of variable is the number of robberies reported in your city?
A. Attribute
B. Continuous
C. Discrete
D. Qualitative
5) What level of measurement is the number of auto accidents reported in a given month?
A. Nominal
B. Ordinal
C. Interval
D. Ratio
6) The names of
How to Add Chatter in the odoo 17 ERP ModuleCeline George
In Odoo, the chatter is like a chat tool that helps you work together on records. You can leave notes and track things, making it easier to talk with your team and partners. Inside chatter, all communication history, activity, and changes will be displayed.
Biological screening of herbal drugs: Introduction and Need for
Phyto-Pharmacological Screening, New Strategies for evaluating
Natural Products, In vitro evaluation techniques for Antioxidants, Antimicrobial and Anticancer drugs. In vivo evaluation techniques
for Anti-inflammatory, Antiulcer, Anticancer, Wound healing, Antidiabetic, Hepatoprotective, Cardio protective, Diuretics and
Antifertility, Toxicity studies as per OECD guidelines
Safalta Digital marketing institute in Noida, provide complete applications that encompass a huge range of virtual advertising and marketing additives, which includes search engine optimization, virtual communication advertising, pay-per-click on marketing, content material advertising, internet analytics, and greater. These university courses are designed for students who possess a comprehensive understanding of virtual marketing strategies and attributes.Safalta Digital Marketing Institute in Noida is a first choice for young individuals or students who are looking to start their careers in the field of digital advertising. The institute gives specialized courses designed and certification.
for beginners, providing thorough training in areas such as SEO, digital communication marketing, and PPC training in Noida. After finishing the program, students receive the certifications recognised by top different universitie, setting a strong foundation for a successful career in digital marketing.
Strategies for Effective Upskilling is a presentation by Chinwendu Peace in a Your Skill Boost Masterclass organisation by the Excellence Foundation for South Sudan on 08th and 09th June 2024 from 1 PM to 3 PM on each day.
Exploiting Artificial Intelligence for Empowering Researchers and Faculty, In...Dr. Vinod Kumar Kanvaria
Exploiting Artificial Intelligence for Empowering Researchers and Faculty,
International FDP on Fundamentals of Research in Social Sciences
at Integral University, Lucknow, 06.06.2024
By Dr. Vinod Kumar Kanvaria
Executive Directors Chat Leveraging AI for Diversity, Equity, and InclusionTechSoup
Let’s explore the intersection of technology and equity in the final session of our DEI series. Discover how AI tools, like ChatGPT, can be used to support and enhance your nonprofit's DEI initiatives. Participants will gain insights into practical AI applications and get tips for leveraging technology to advance their DEI goals.
This presentation was provided by Steph Pollock of The American Psychological Association’s Journals Program, and Damita Snow, of The American Society of Civil Engineers (ASCE), for the initial session of NISO's 2024 Training Series "DEIA in the Scholarly Landscape." Session One: 'Setting Expectations: a DEIA Primer,' was held June 6, 2024.
MATATAG CURRICULUM: ASSESSING THE READINESS OF ELEM. PUBLIC SCHOOL TEACHERS I...NelTorrente
In this research, it concludes that while the readiness of teachers in Caloocan City to implement the MATATAG Curriculum is generally positive, targeted efforts in professional development, resource distribution, support networks, and comprehensive preparation can address the existing gaps and ensure successful curriculum implementation.
3. It is a variable being measured to produce numerical
observations associated with the random outcomes of
a chance experiment.
Question #1
A. fixed variable C. independent variable
B. dependent variable D. random variable
4. Which of the following is a discrete random variable?
Question #2
A.the number of patients in a hospital
B.the average weight of female athletes
C.the average amount of electricity consumed
D.the amount of paint used in repainting a building
5. What are the possible values of a random variable
when a coin is tossed once?
Question #3
A.Tail (T) and Head (H)
B.The number of dots 1,2,3,4,5,6
C.Tail and Tail (TT), and Head and Head (HH)
D.The pair of even number of dots
(2,2),(2,4),(2,6),(4,2),(4,4),(4,6),(6,2),(6,4) and (6,6)
6. Which is a discrete probability distribution?
Question #4
7. A fair coin is tossed three times and the sequence of
heads (H) and tails (T) is observed. What is the
probability that no heads will appear?
Question #5
A.1/8 B. 3/8 C. 5/8 D. 2/3
8. The expected value of a random variable is the
Question #6
A.largest value that will ever occur.
B.mean value over an infinite number of observations
of the variable.
C.most common value over an infinite number of
observations of the variable.
D.value that has the highest probability of occurring.
9. For items 7-10.
Cardo sells a maximum of 3 tickets per customer.
Let T be the number of tickets sold to a random
customer. Below is the probability distribution of T.
10. Which probability value would satisfy the given
probability distribution?
Question #7
A.0.16 B. 0.17 C. 0.18 D. 0.19
11. What is the mean and variance of the probability
distribution?
Question #8
A.1.64 B. 1.65 C. 1.66 D. 1.67
12. What is the variance of the probability distribution?
Question #9
A. 2.18 B. 2.19 C. 2.20 D. 2.21
13. What would be the best interpretation you can create
given the mean of the probability distribution?
Question #10
A.Most customers will purchase 3 tickets.
B.Cardo can expect to have more tickets sold.
C.A group of 10 customers will purchase exactly 29 tickets.
D.If we look at a large number of customers, then each
customer, on the average, will have purchased about 1.66
tickets.
14. What is the first step in finding the variance of a
discrete probability distribution?
Question #11
A.Calculate the standard deviation
B.Find the mean of the probability distribution
C.Subtract the mean from each value of the random
variable X
D.Multiply the square of the difference of X and the
mean by each value of the random variable.
15. Which statement is NOT true about the variance of a
discrete random variable?
Question #12
A. Variance is always nonnegative.
B. It tells the average of the items in a discrete
probability distribution
C. It measures how far apart the elements of the
set are spread out
D. High variance indicates that the data points are
very spread out around the mean.
16. A local club plans to invest P10,000 to host a basketball
game. They expect to sell tickets worth P15,000. But if it
rains on the day of the game, they won't sell any tickets, and
the club will lose all the money invested. If the weather
forecast for the day of the game is 20% possibility of rain, is
this a good investment?
Question #13
A.No because the expected value is positive P2,000
B.No because the expected value is negative P2,000
C.Yes because the expected value is positive P2,000
D.Yes because the expected value is negative P2,000
17. Which of the following is NOT a property of a normal
curve?
Question #14
A.The total area under it is 1.
B.The curve is symmetric about the center.
C. It is divided into positive 2 and negative 2 standard
deviations
D.The mean, median, and mode have the same value
and are located at the same point.
18. The area under the part of normal curve in the
standard normal distribution that lies within 2
standard deviations of the mean is
Question #15
A.68% B. 95 C. 99.7% D. 100%
19. A set of Mathematics exam scores has a mean of 68
and a standard deviation of 8. A set of English exam
scores has a mean of 75 and a standard deviation of
10. For which exam would a score of 78 have a
higher standing?
Question #16
A.Math
B.English
C.both Math & English
D.cannot be determined
20. What is “P(a<x<b)”?
Question #17
A.The area to the left of a.
B.The area to the right of a.
C.The area between a and b.
D.The area to the right of b.
21. Evaluate the score of the student in a biology test
where the equivalent z-score is 0.98. The mean of the
test was 88 with a standard deviation of 9.5.
Question #18
A.95 B. 96 C. 97 D. 98
22. The midterm examination scores in Statistics and
Probability follows a normal distribution with mean
of 38 and a standard deviation of 2. If Felix is
included in the top 5%, what minimum score should
Felix have?
Question #19
A.40 B. 41 C. 42 D. 43
23. Which of the following illustrates a systematic
sampling method?
Question #20
A.A researcher conducted a survey of 50 randomly selected workers from
each of these categories: high school graduate, with undergraduate
degrees, with master’s degree, and with doctoral degree.
B.A researcher interviewed all freshmen in each of 15 randomly selected
public schools in Surigao del Norte.
C.A researcher doing a research work on students’ reaction of the newly
implemented curriculum and interviewed every 10th student entering
the gate.
D.A researcher selected a sample of n = 120 from a population 850 using
the Table of Random Numbers.
24. A randomly selected sample of 400 students at a
university with 15-week semesters was asked whether or
not they think the semester should be shortened to 14
weeks (with longer classes). Forty-six percent (46%) of
the 400 students surveyed answered "yes." Which one of
the following statements about the number 46% is
correct?
Question #21
A.It is a sample statistic C. It is a population parameter
B.It is a random variable D. It is a quantitative discrete variable
25. What do you call a portion or representative of
population?
Question #22
A.Parameter B. Population
C. Sample D. Statistic
26. A randomly selected 400 students out of 9000
students at a university with 15-week semesters was
asked whether or not they think the semester should
be shortened to 14 weeks (with longer classes). Forty-
six percent (46%) of the 400 students surveyed
answered "yes." What is the sample?
Question #23
A.400 students B. 9000 students
C. 15-week semesters D. 46% who answered “yes”
27. Which of following is true about the mean of the
sample means?
Question #24
A.The mean of the sample mean is equal to the
population mean.
B.The mean of the sample mean is equal to the
population mean divided by the population variance.
C.The mean of the sample mean is equal to the square
of population mean.
D.The mean of the sample mean is equal to the square
root of population mean.
28. What is the mean of the sample means of size 3?
Question #25
A.9.50 B. 9.75 C. 10.50 D. 10.75
29. What is the variance of the sample means of size 3 if
the population variance is 6.9375?
Question #26
A.1.5 B. 1.6 C. 1.7 D. 1.8
30. What is true about the standard error of the mean?
Question #27
A.Decreases as the sample size increases.
B.It is less than the standard deviation of the
population.
C.It measures the variability of the mean from sample
to sample.
D.All of the above
31. What distribution is used to estimate population
parameters when the population variance is
unknown, and the sample size is less than 30?
Question #28
A.Chi-square Distribution C. t-Distribution
B.Pearson Correlation Coefficient D. z-Distribution
32. Given µ =10, σ = 3 and n = 40. Which of the following
distribution of the sample mean for a normal
population when the population variance is known?
Question #29
A.Chi-square Distribution
B. Pearson Correlation Coefficient
C. t-Distribution
D. z-Distribution
33. A History teacher claims that the average height of
Filipino males is 163 centimeters. A student taking
up Statistics randomly select 10 Filipino males and
measure their heights. Their heights in centimeter
are 163,167,159,165,162,164,163,160,169 and 174.
To test the claim, which test is appropriate?
Question #30
A.chi-square test B. f-test C. t-test D. z-test
34. Which of the following states that the sampling
distribution of the sample means approaches a
normal distribution as the sample size gets larger?
Question #31
A.Central Limit Theorem
B. Law of Large Numbers
C. Limit Theorem
D. Bayes Theorem
35. What happen to the histogram of the sample means
of the random samples in Central Limit Theorem, as
n→∞?
Question #32
A.It changes nothing from the original
population.
B. It shows the variance of the distribution.
C. It shows the standard deviation of the
distribution.
D. It approaches the normalcy of the distribution.
36. The record of weights of the male population follows
the normal distribution. Its mean and standard
deviation are 70 kg and 15 kg respectively. If a
researcher considers the records of 50 males, what
would be its standard deviation?
Question #33
A.2.11 B. 2.12 C. 2.13 D. 2.14
37. Which concept of random sampling distribution of
the sample means using Central Limit Theorem?
Question #34
A.If you have a population mean µ and standard deviation 𝜎 and take
sufficiently large random samples from the population with
replacement, then the distribution of the sample means will be
approximately distributed normally.
B. The probability of the simultaneous occurrence of two events that are
independent is given by the product of their individual probabilities.
C.If you have a population mean µ and standard deviation and take
sufficiently large random samples from the population with
replacement, then the distribution of the sample means will be
approximately distributed same as the original population.
D.The larger the sample size n in sampling distribution of sample mean,
the lesser the histogram is to show the normalcy of the distribution.
38. What is the estimate, if sample size of random
sampling using Central Limit Theorem is almost
normal in accordance to Statisticians?
Question #35
A.If n= 2 B. If n= 3 C. If n= 10 D. If n= 30
39. How do you compare the formula 𝑧 =
𝑥−𝜇
𝜎
𝑛
from 𝑧 =
𝑥−𝜇
𝜎
?
Question #36
A.Former is used when solving z from original population
while the latter is used in random sample.
B.Former is used when solving z from random sample while
the latter is used in original population.
C.Former is used in random sample and original population
but the latter can only be used for random sample.
D.Both can be used alternatively.
40. Which is NOT a correct statement?
Question #37
A.The total probability distribution of the sample
mean is always equal to 1.
B.There are 10 possible samples of size 3 drawn in
the population N = 5.
C.There are 31 possible samples of size 3 drawn in
the population N = 7.
D.There are 20 possible samples of size 3 drawn in
the population N = 6.
41. It is a variable being measured to produce numerical observations associated with the random
outcomes of a chance experiment.
Question #1
42. It is a variable being measured to produce numerical observations associated with the random
outcomes of a chance experiment.
Question #1
43. It is a variable being measured to produce numerical observations associated with the random
outcomes of a chance experiment.
Question #1
44. It is a variable being measured to produce numerical observations associated with the random
outcomes of a chance experiment.
Question #1
45. It is a variable being measured to produce numerical observations associated with the random
outcomes of a chance experiment.
Question #1
46. It is a variable being measured to produce numerical observations associated with the random
outcomes of a chance experiment.
Question #1
47. It is a variable being measured to produce numerical observations associated with the random
outcomes of a chance experiment.
Question #1
48. It is a variable being measured to produce numerical observations associated with the random
outcomes of a chance experiment.
Question #1
49. It is a variable being measured to produce numerical observations associated with the random
outcomes of a chance experiment.
Question #1
50. It is a variable being measured to produce numerical observations associated with the random
outcomes of a chance experiment.
Question #1
51. It is a variable being measured to produce numerical observations associated with the random
outcomes of a chance experiment.
Question #1