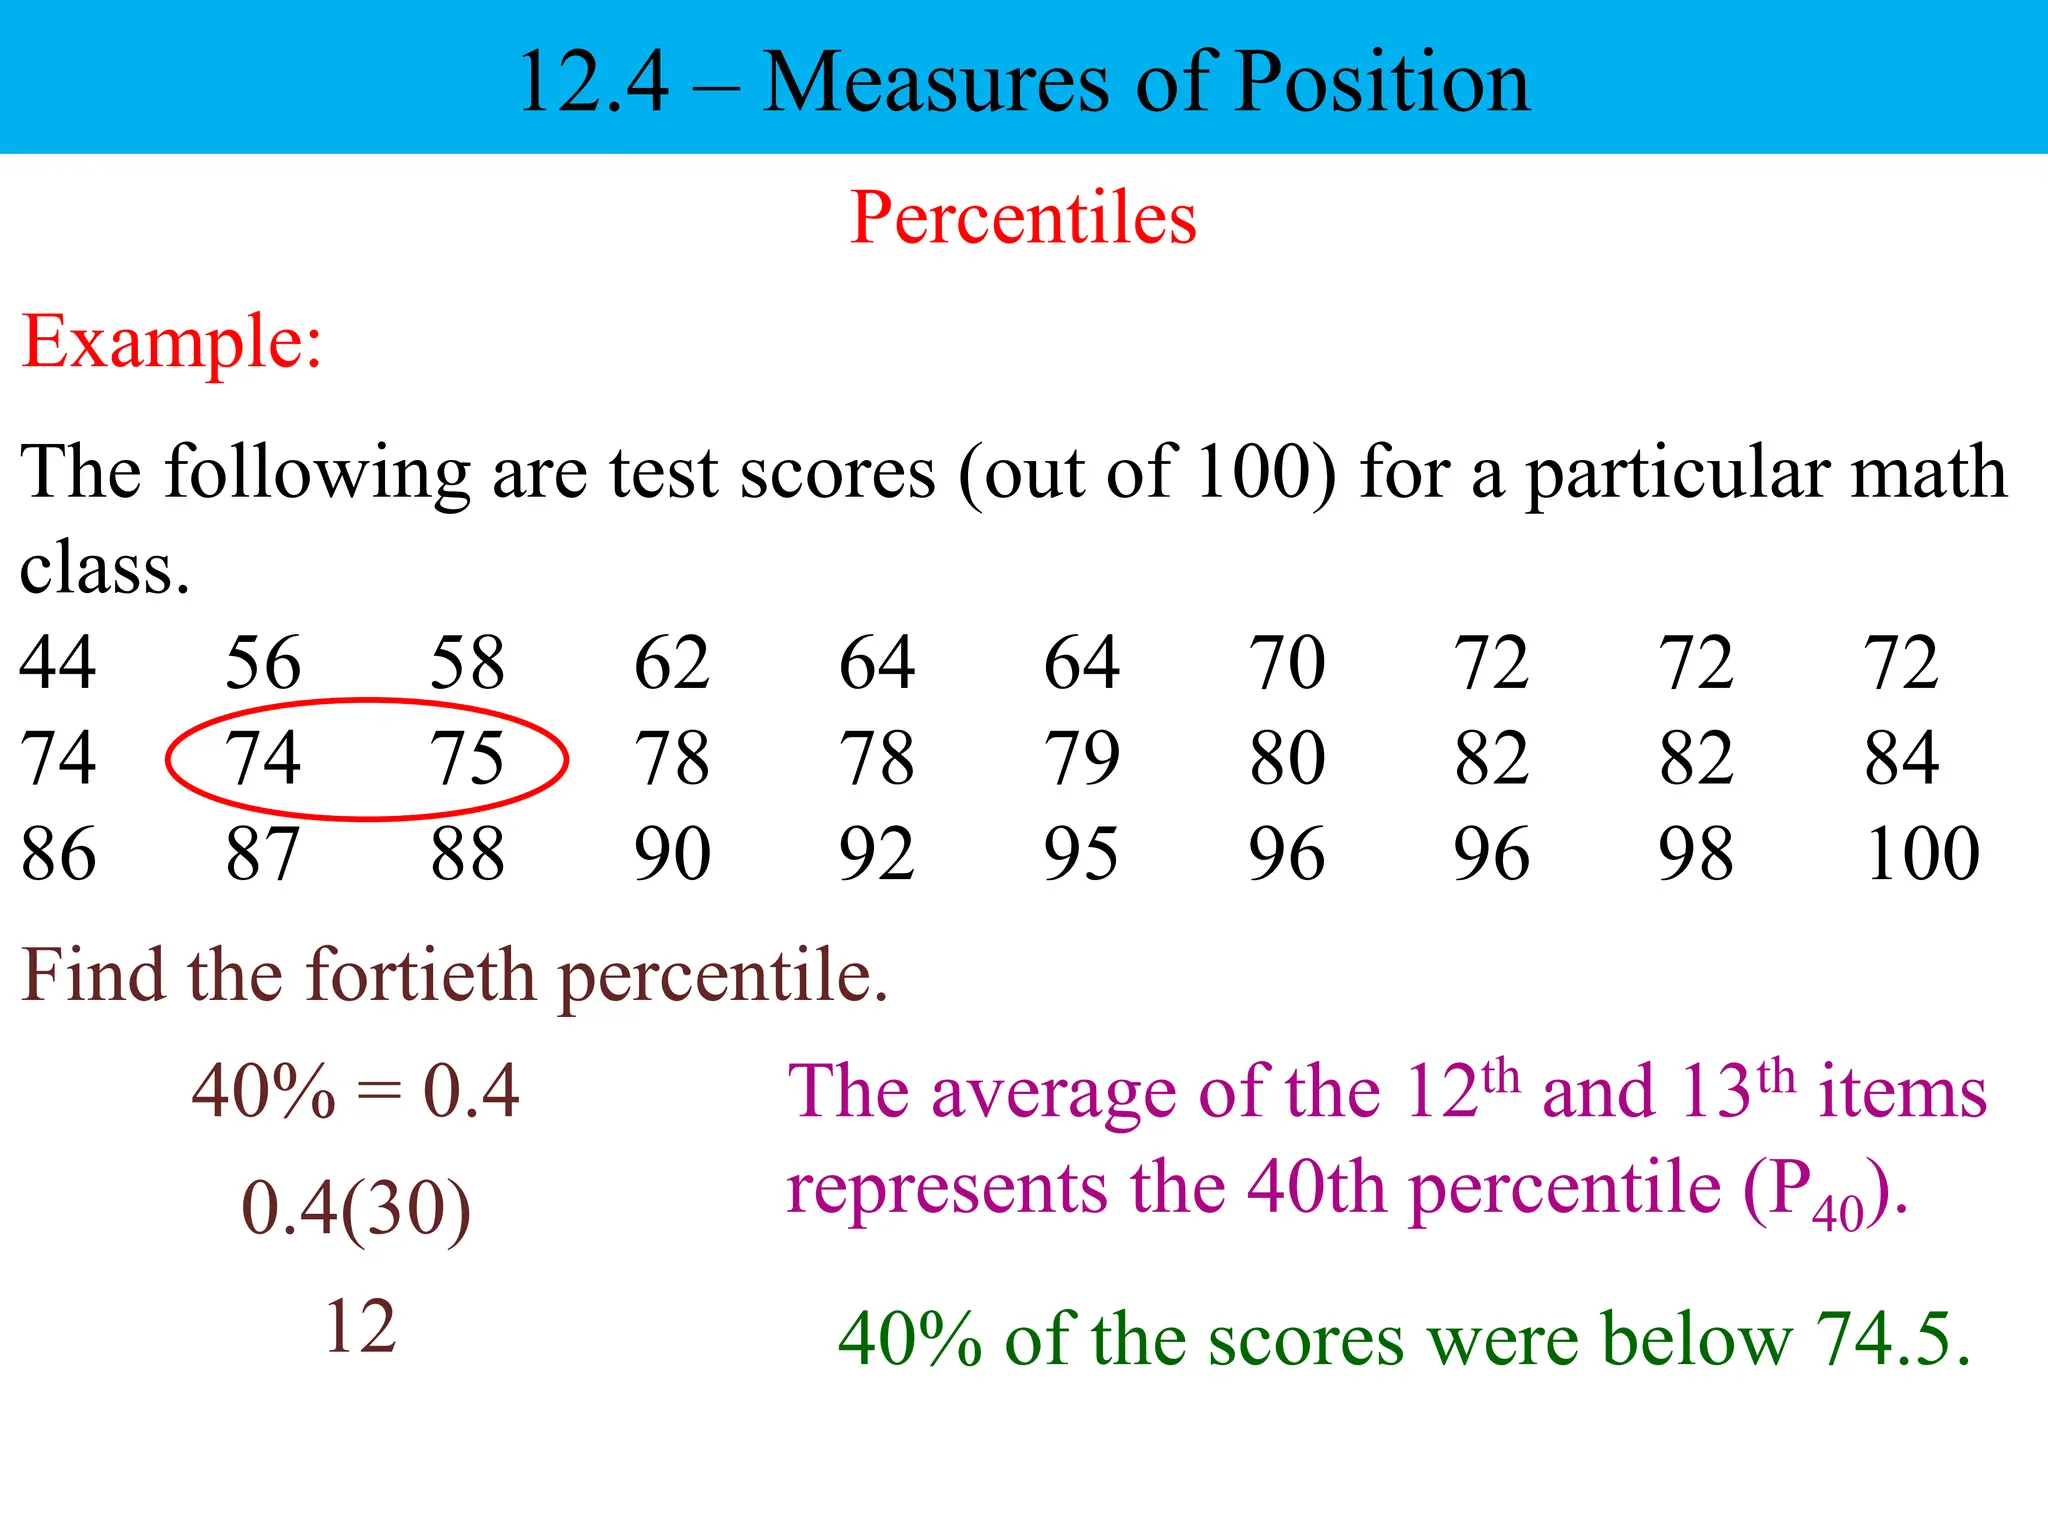
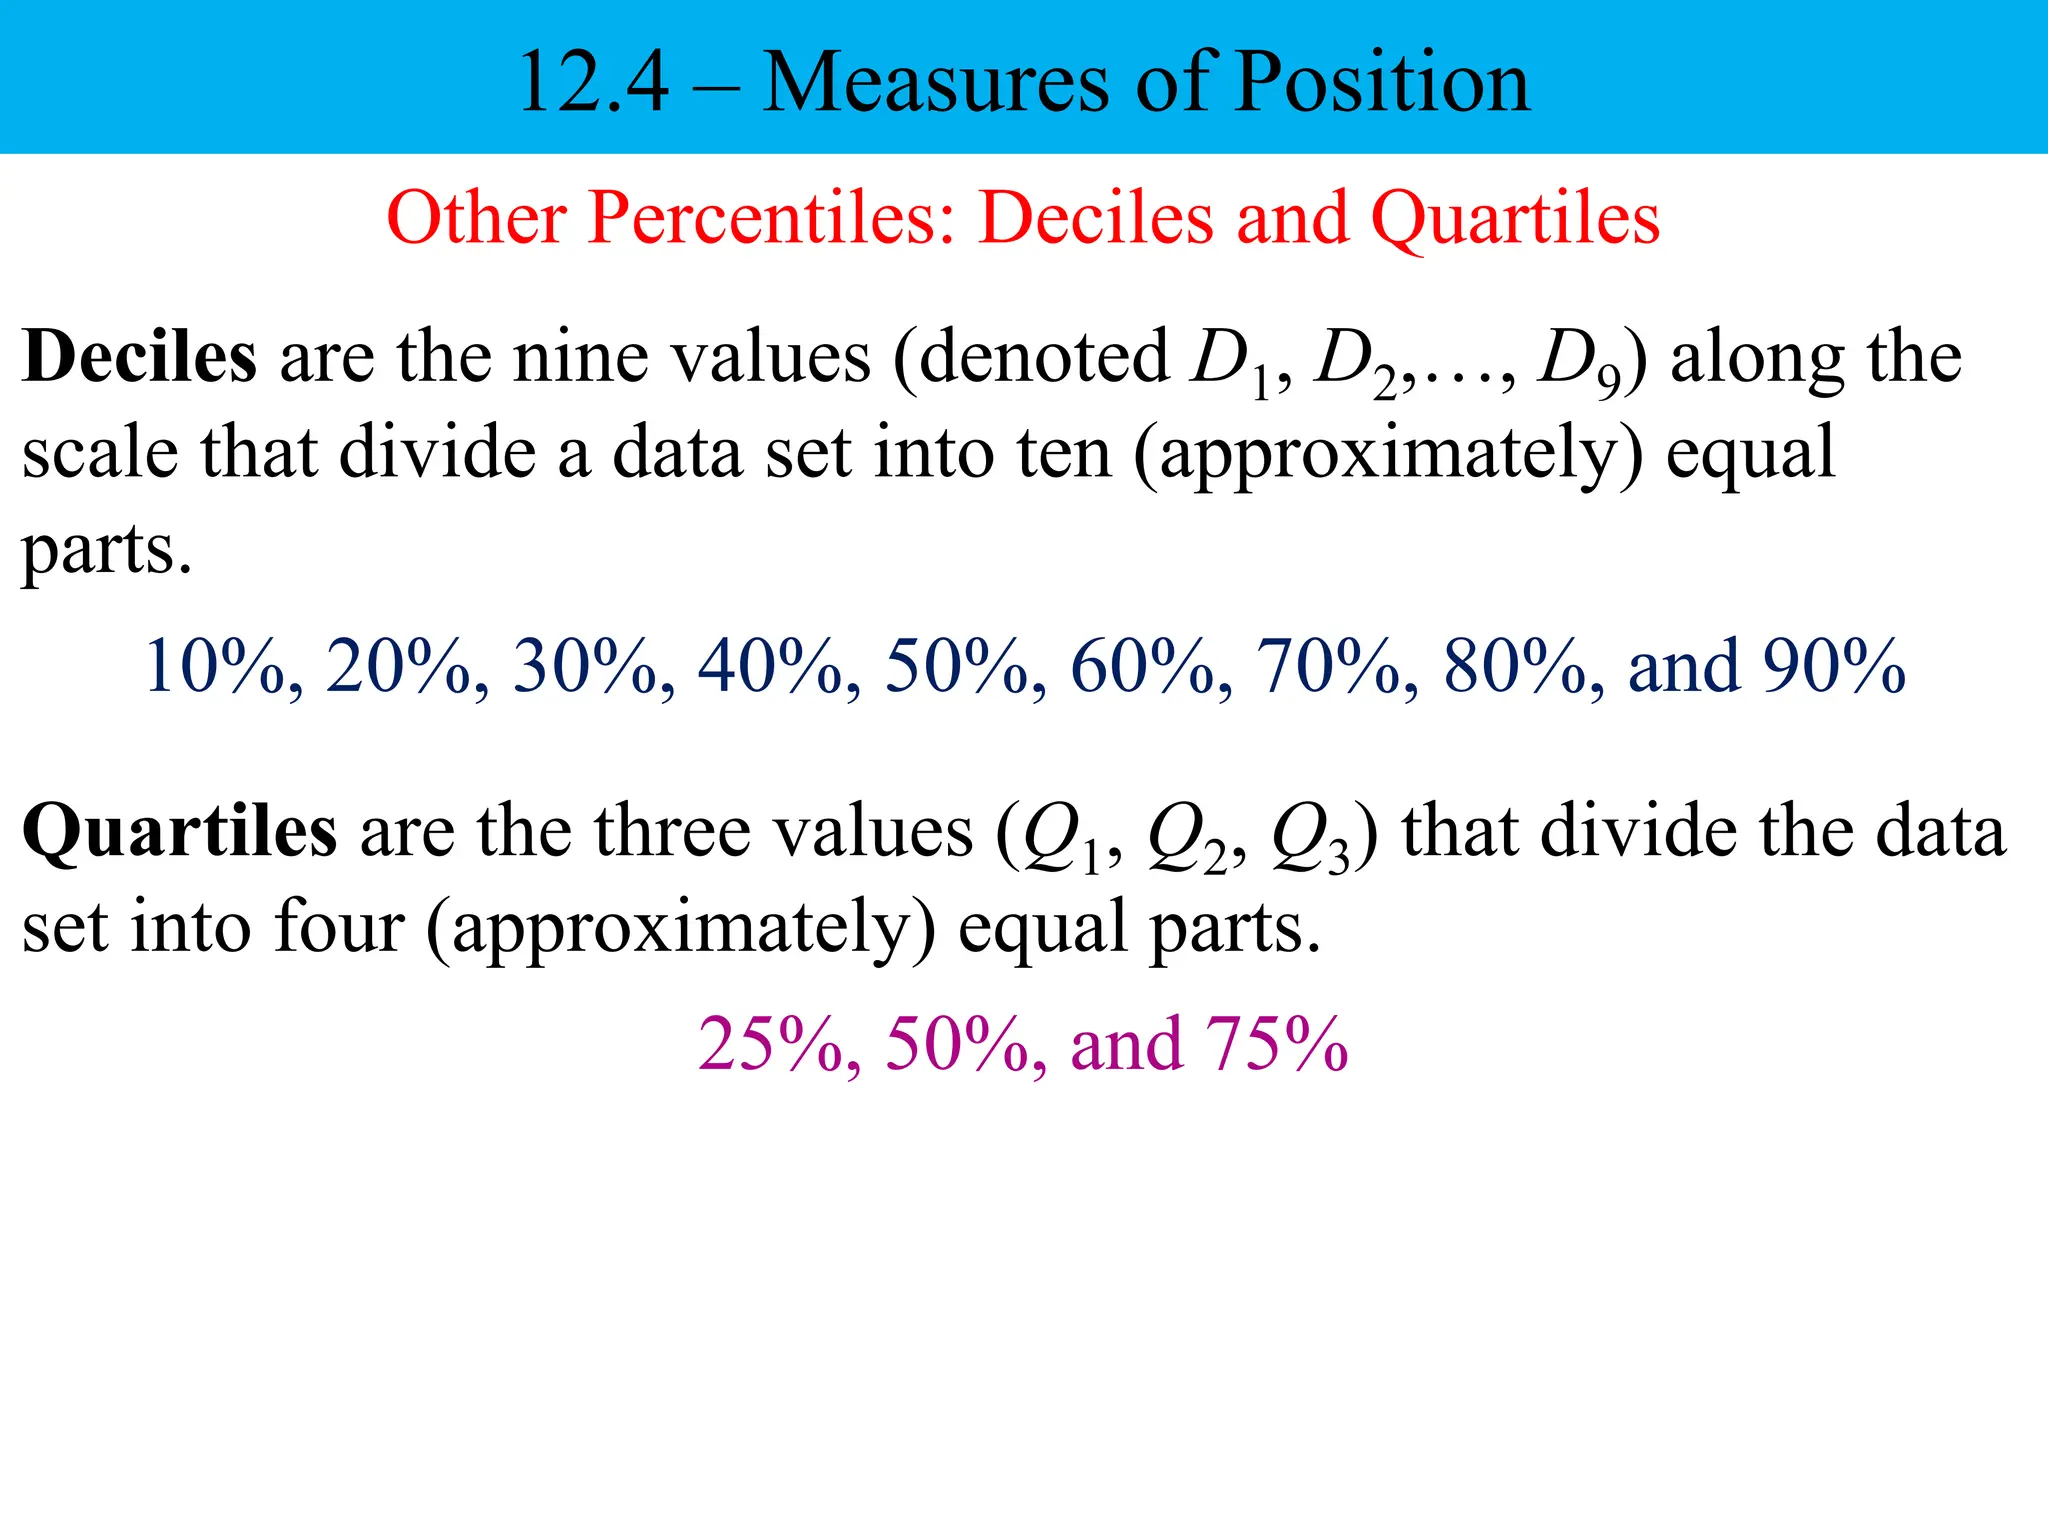
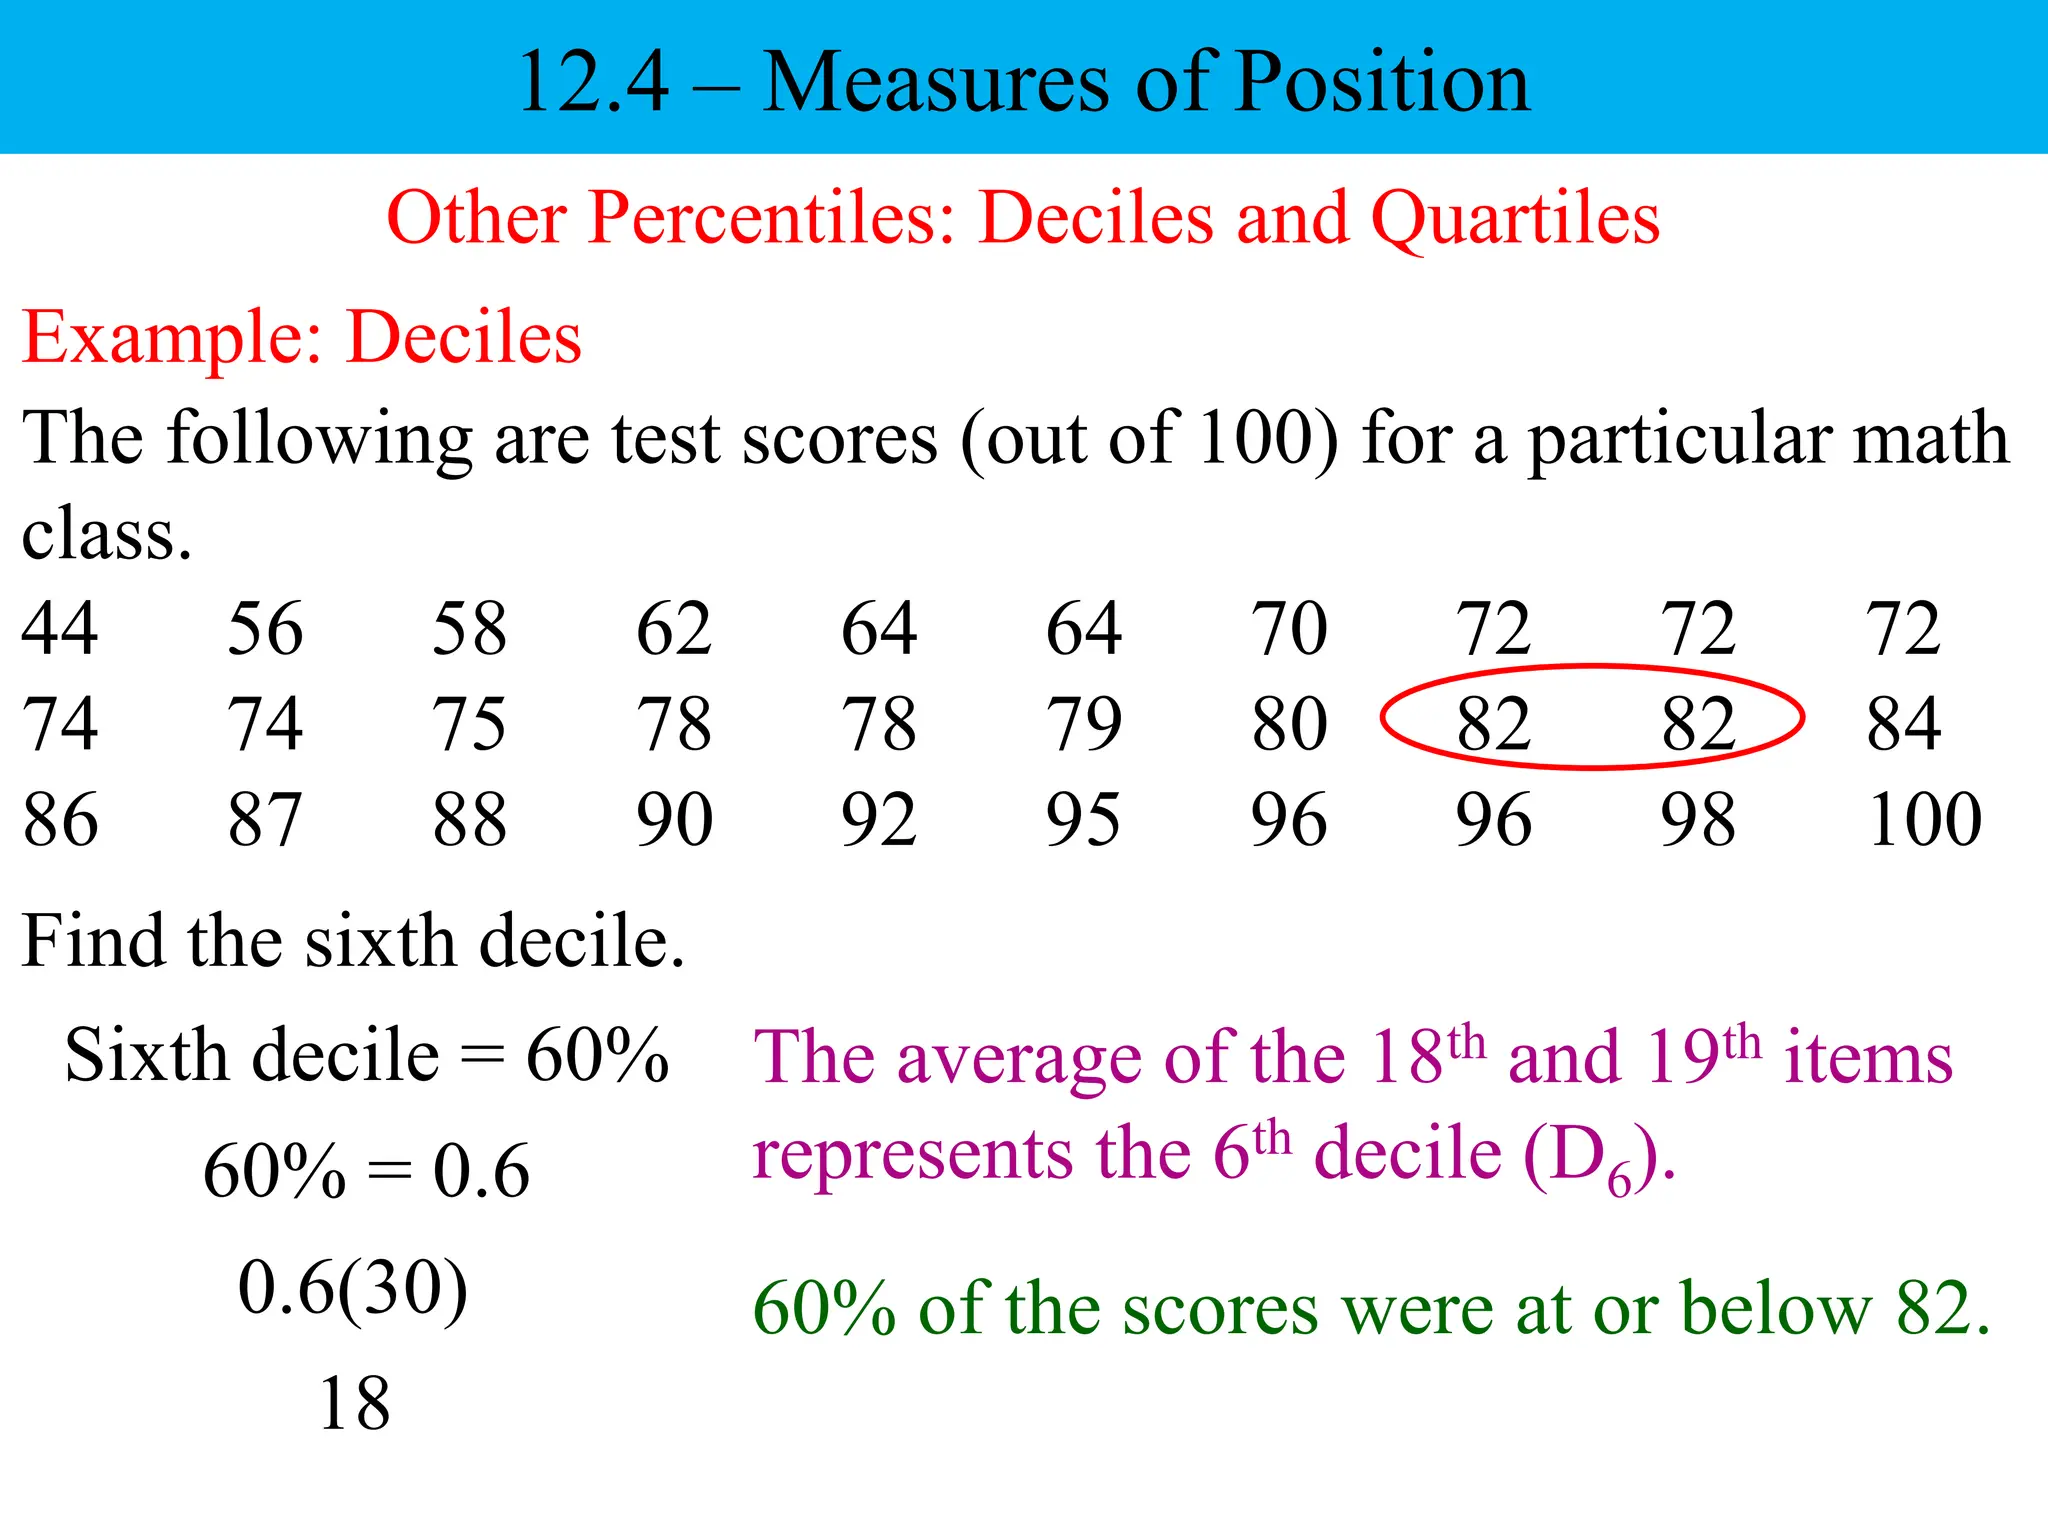
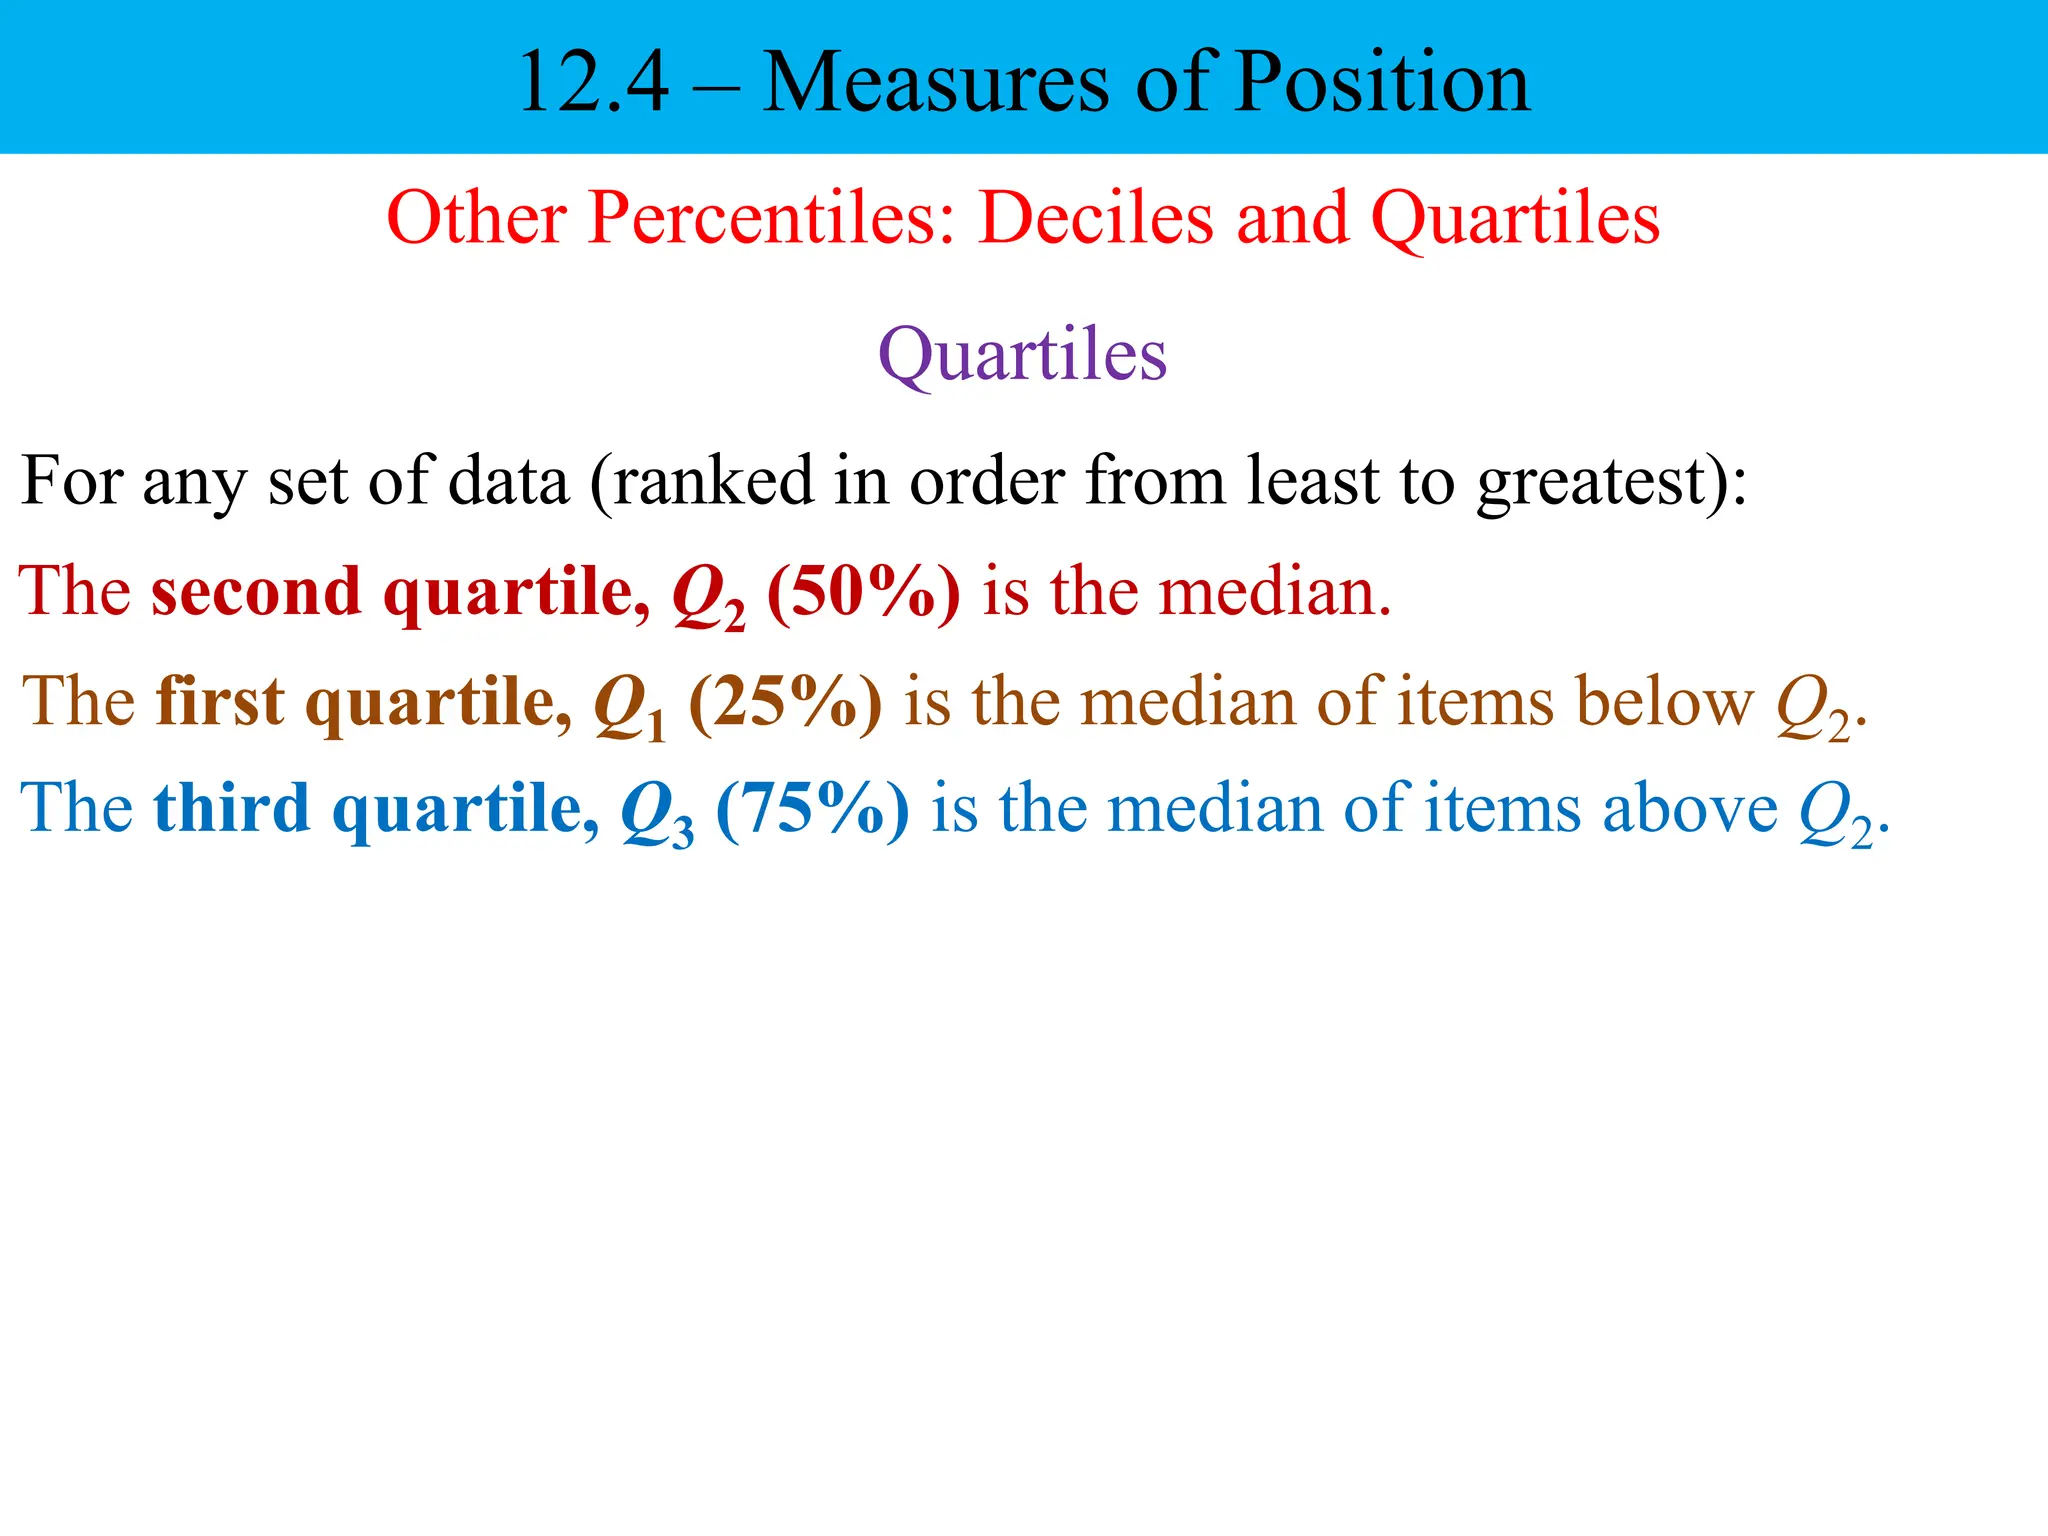
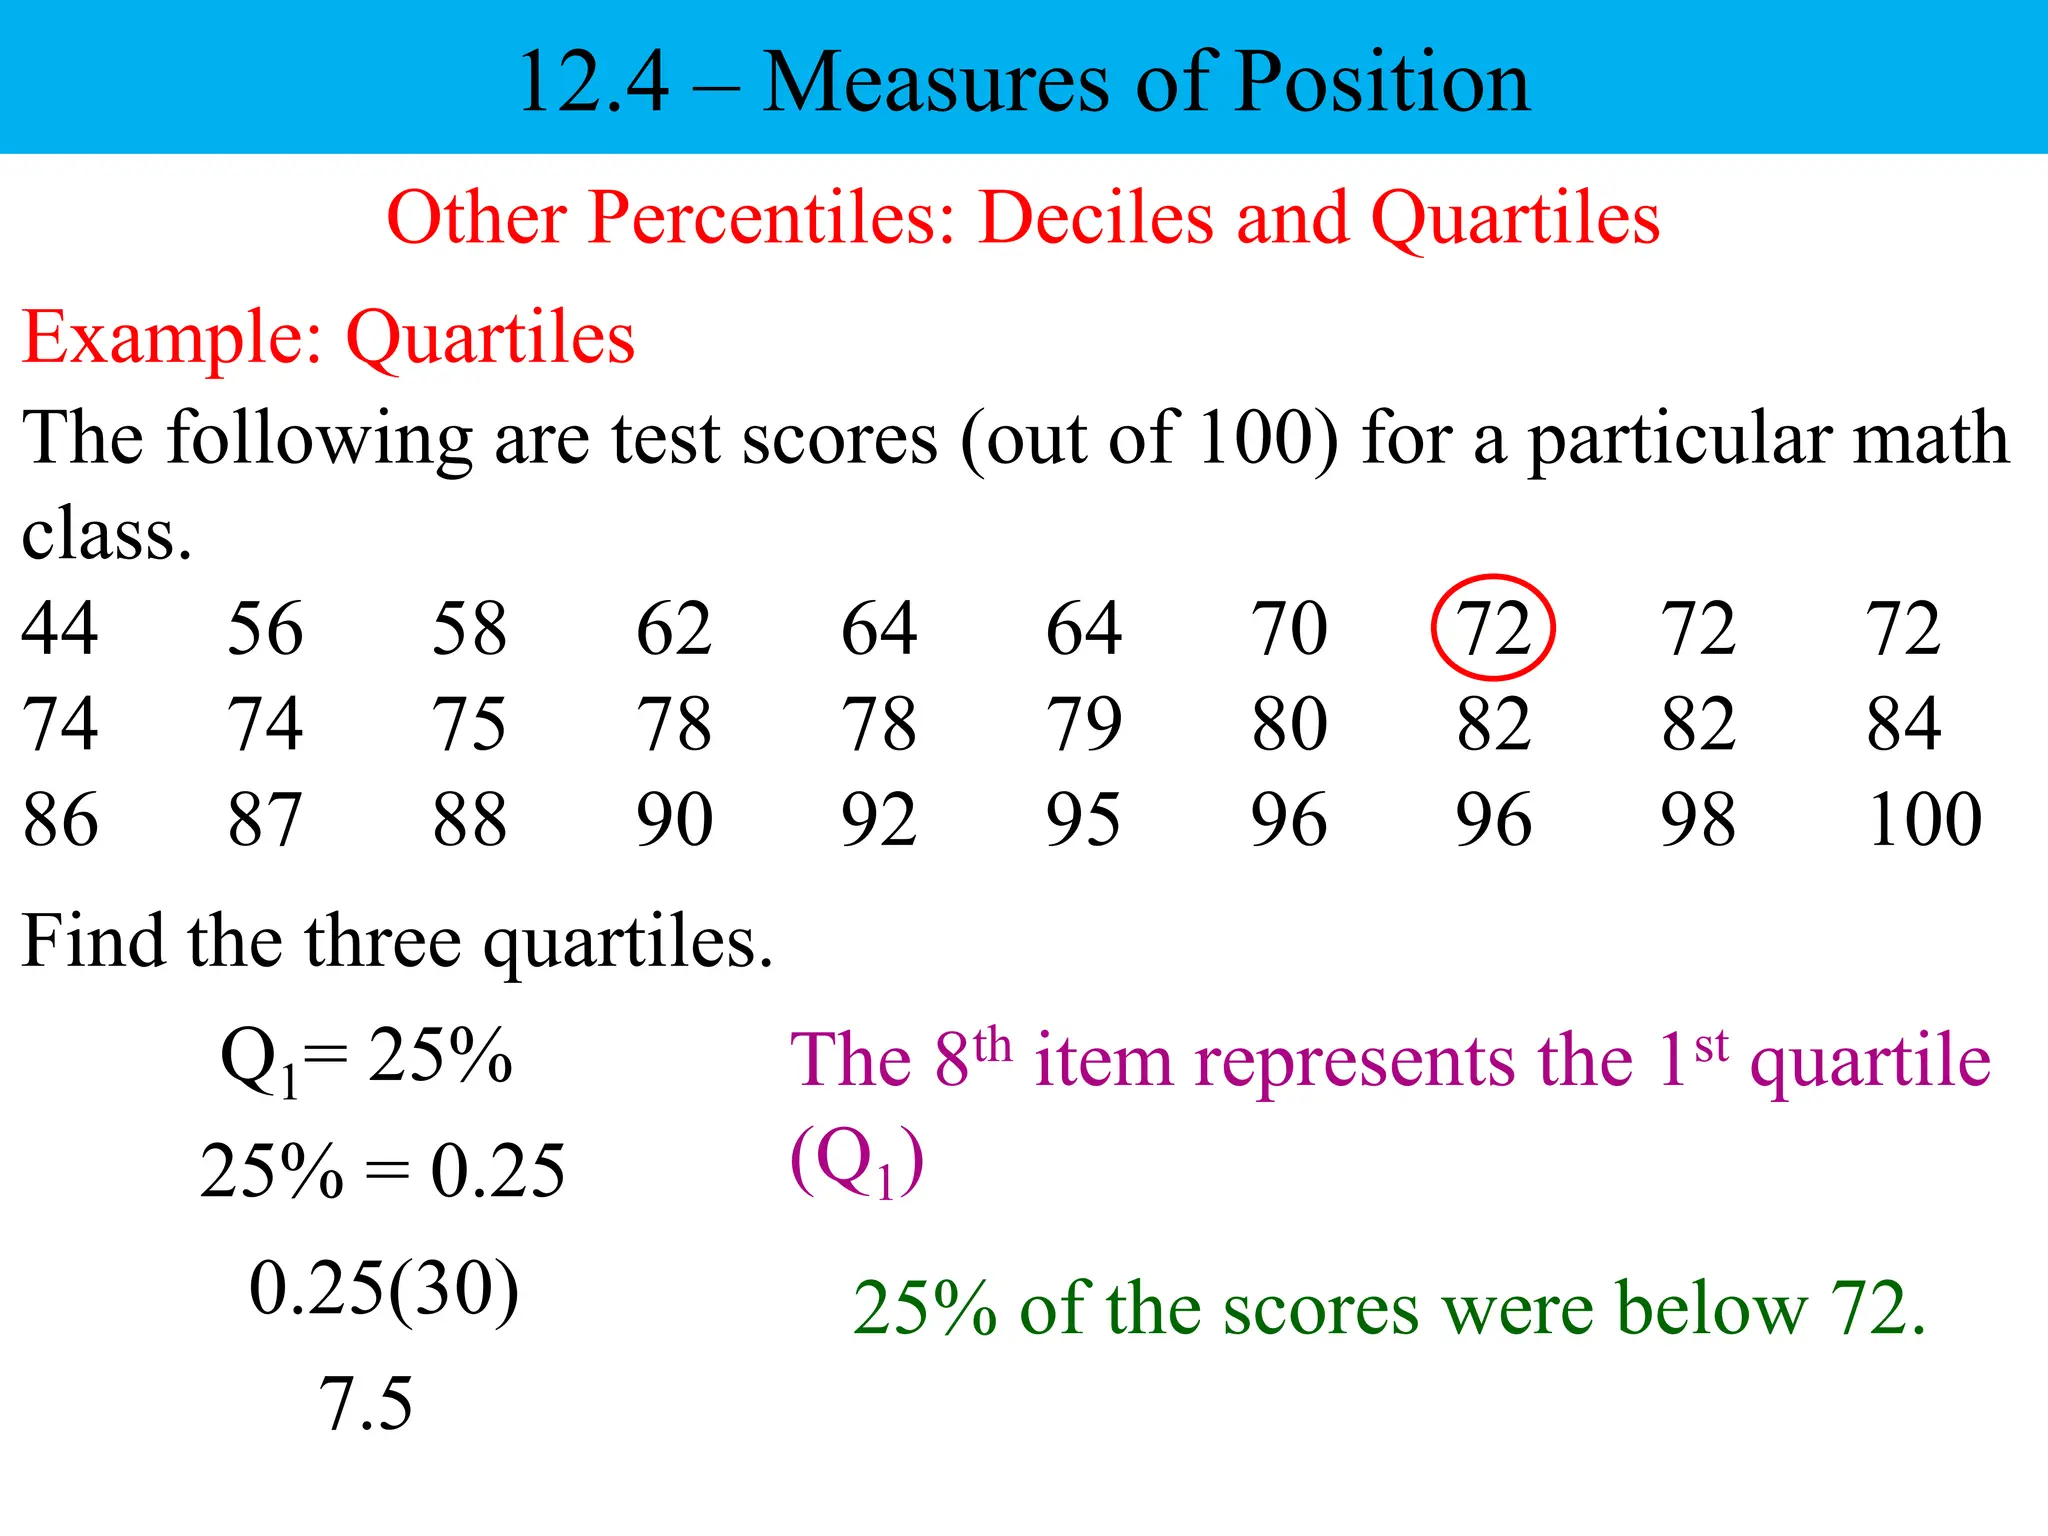
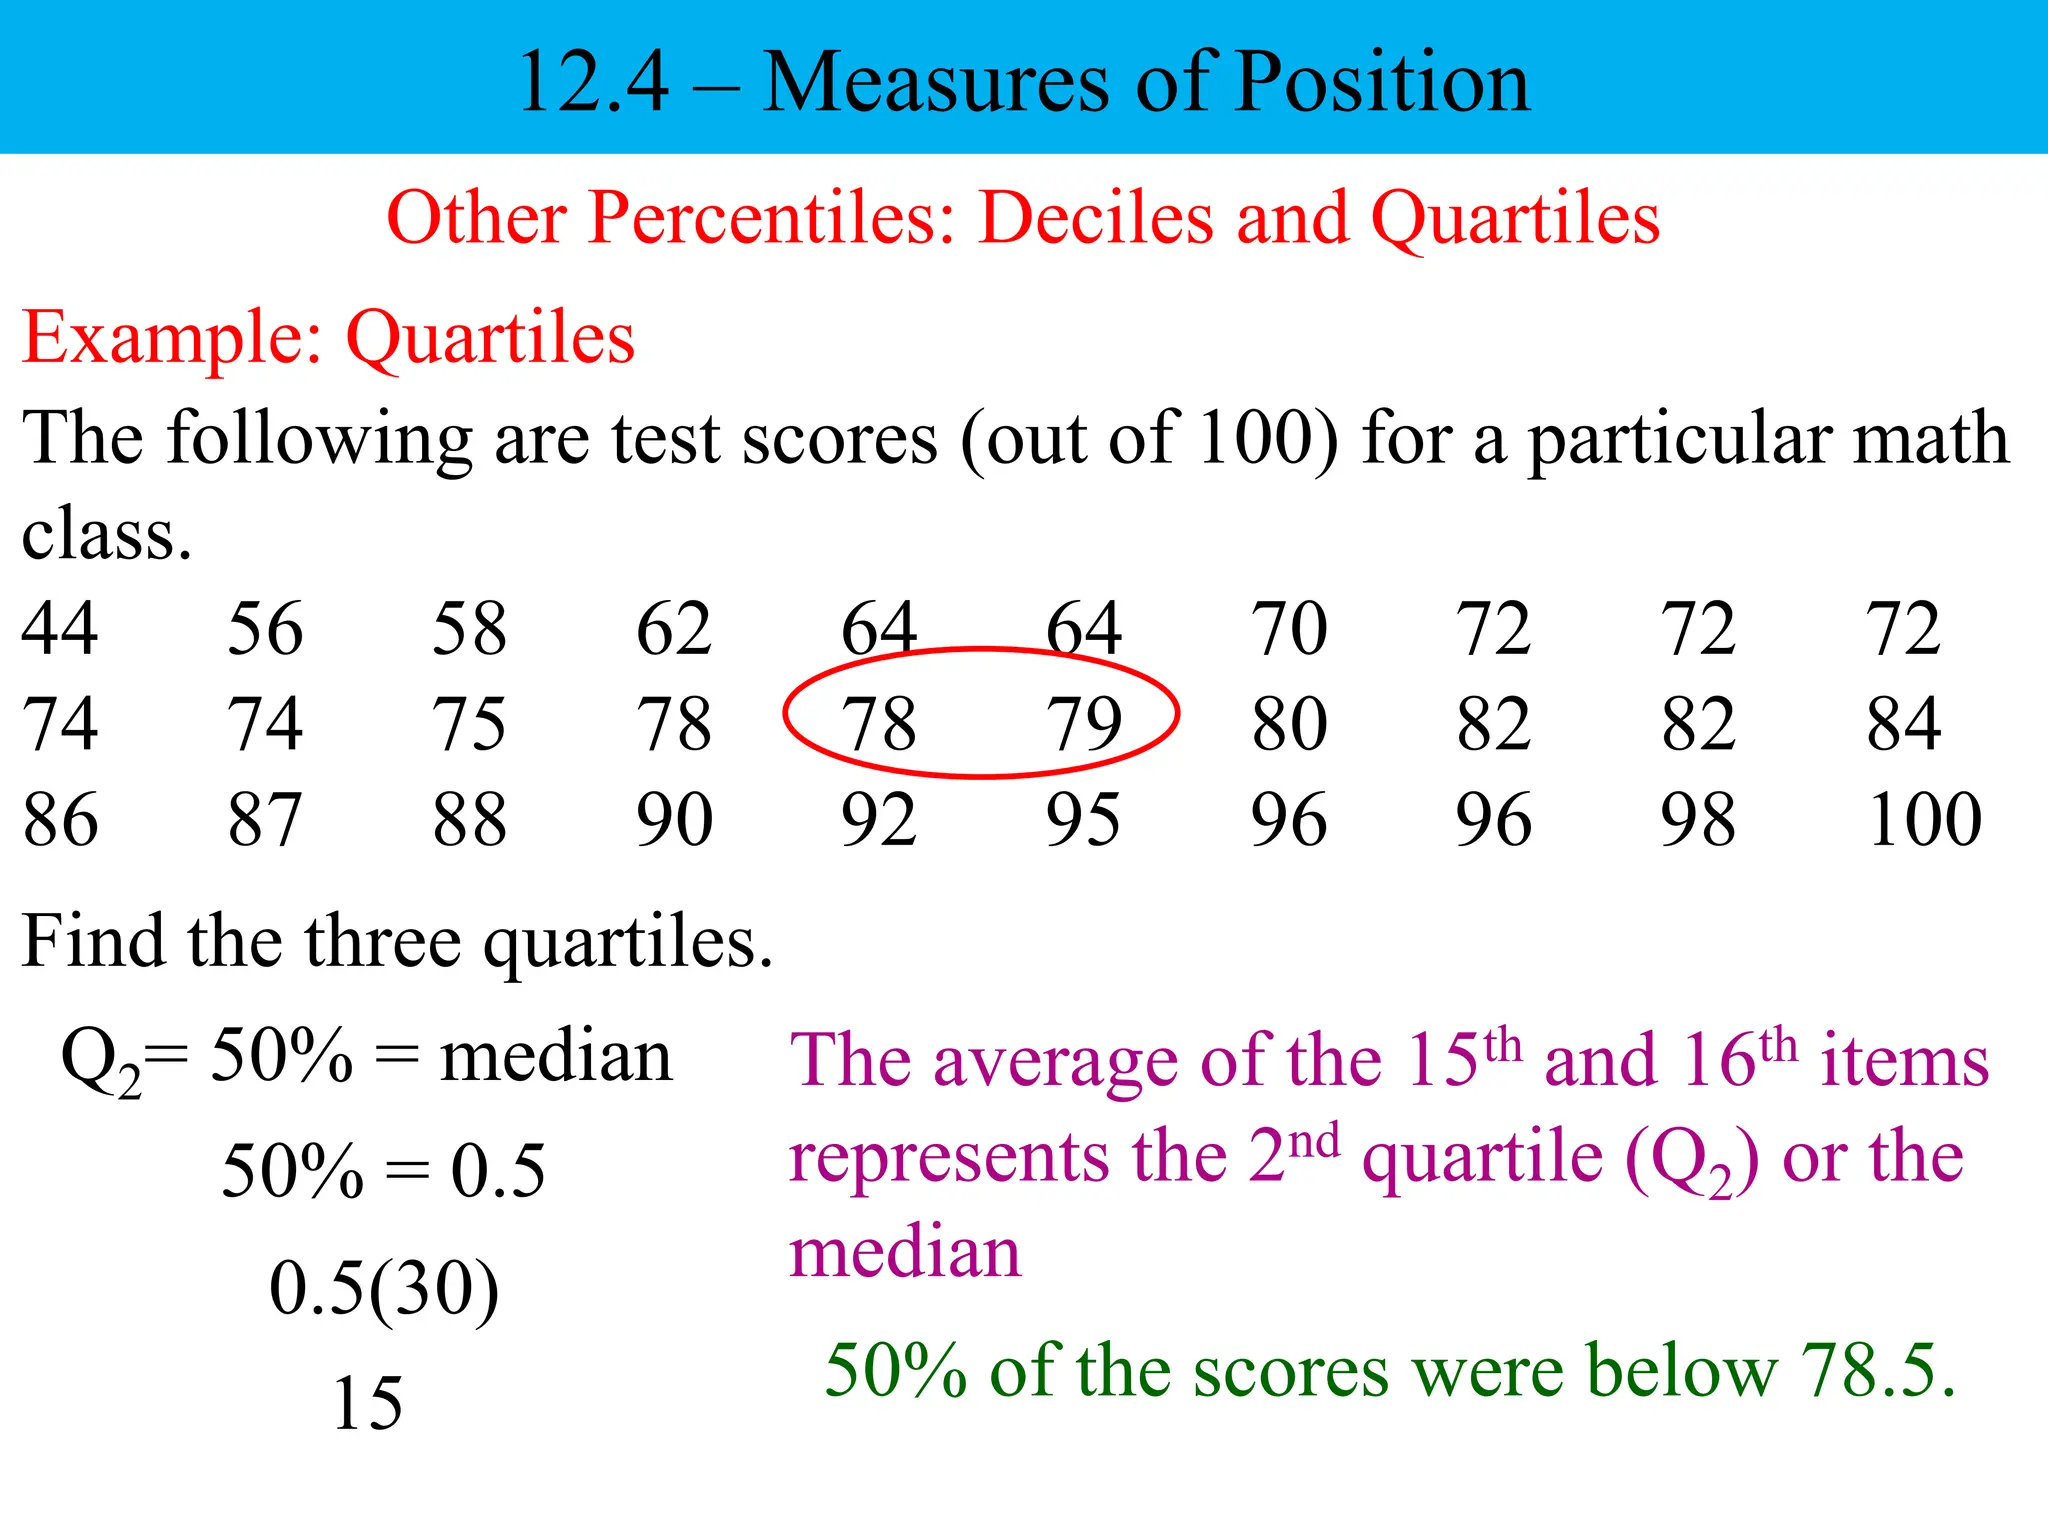
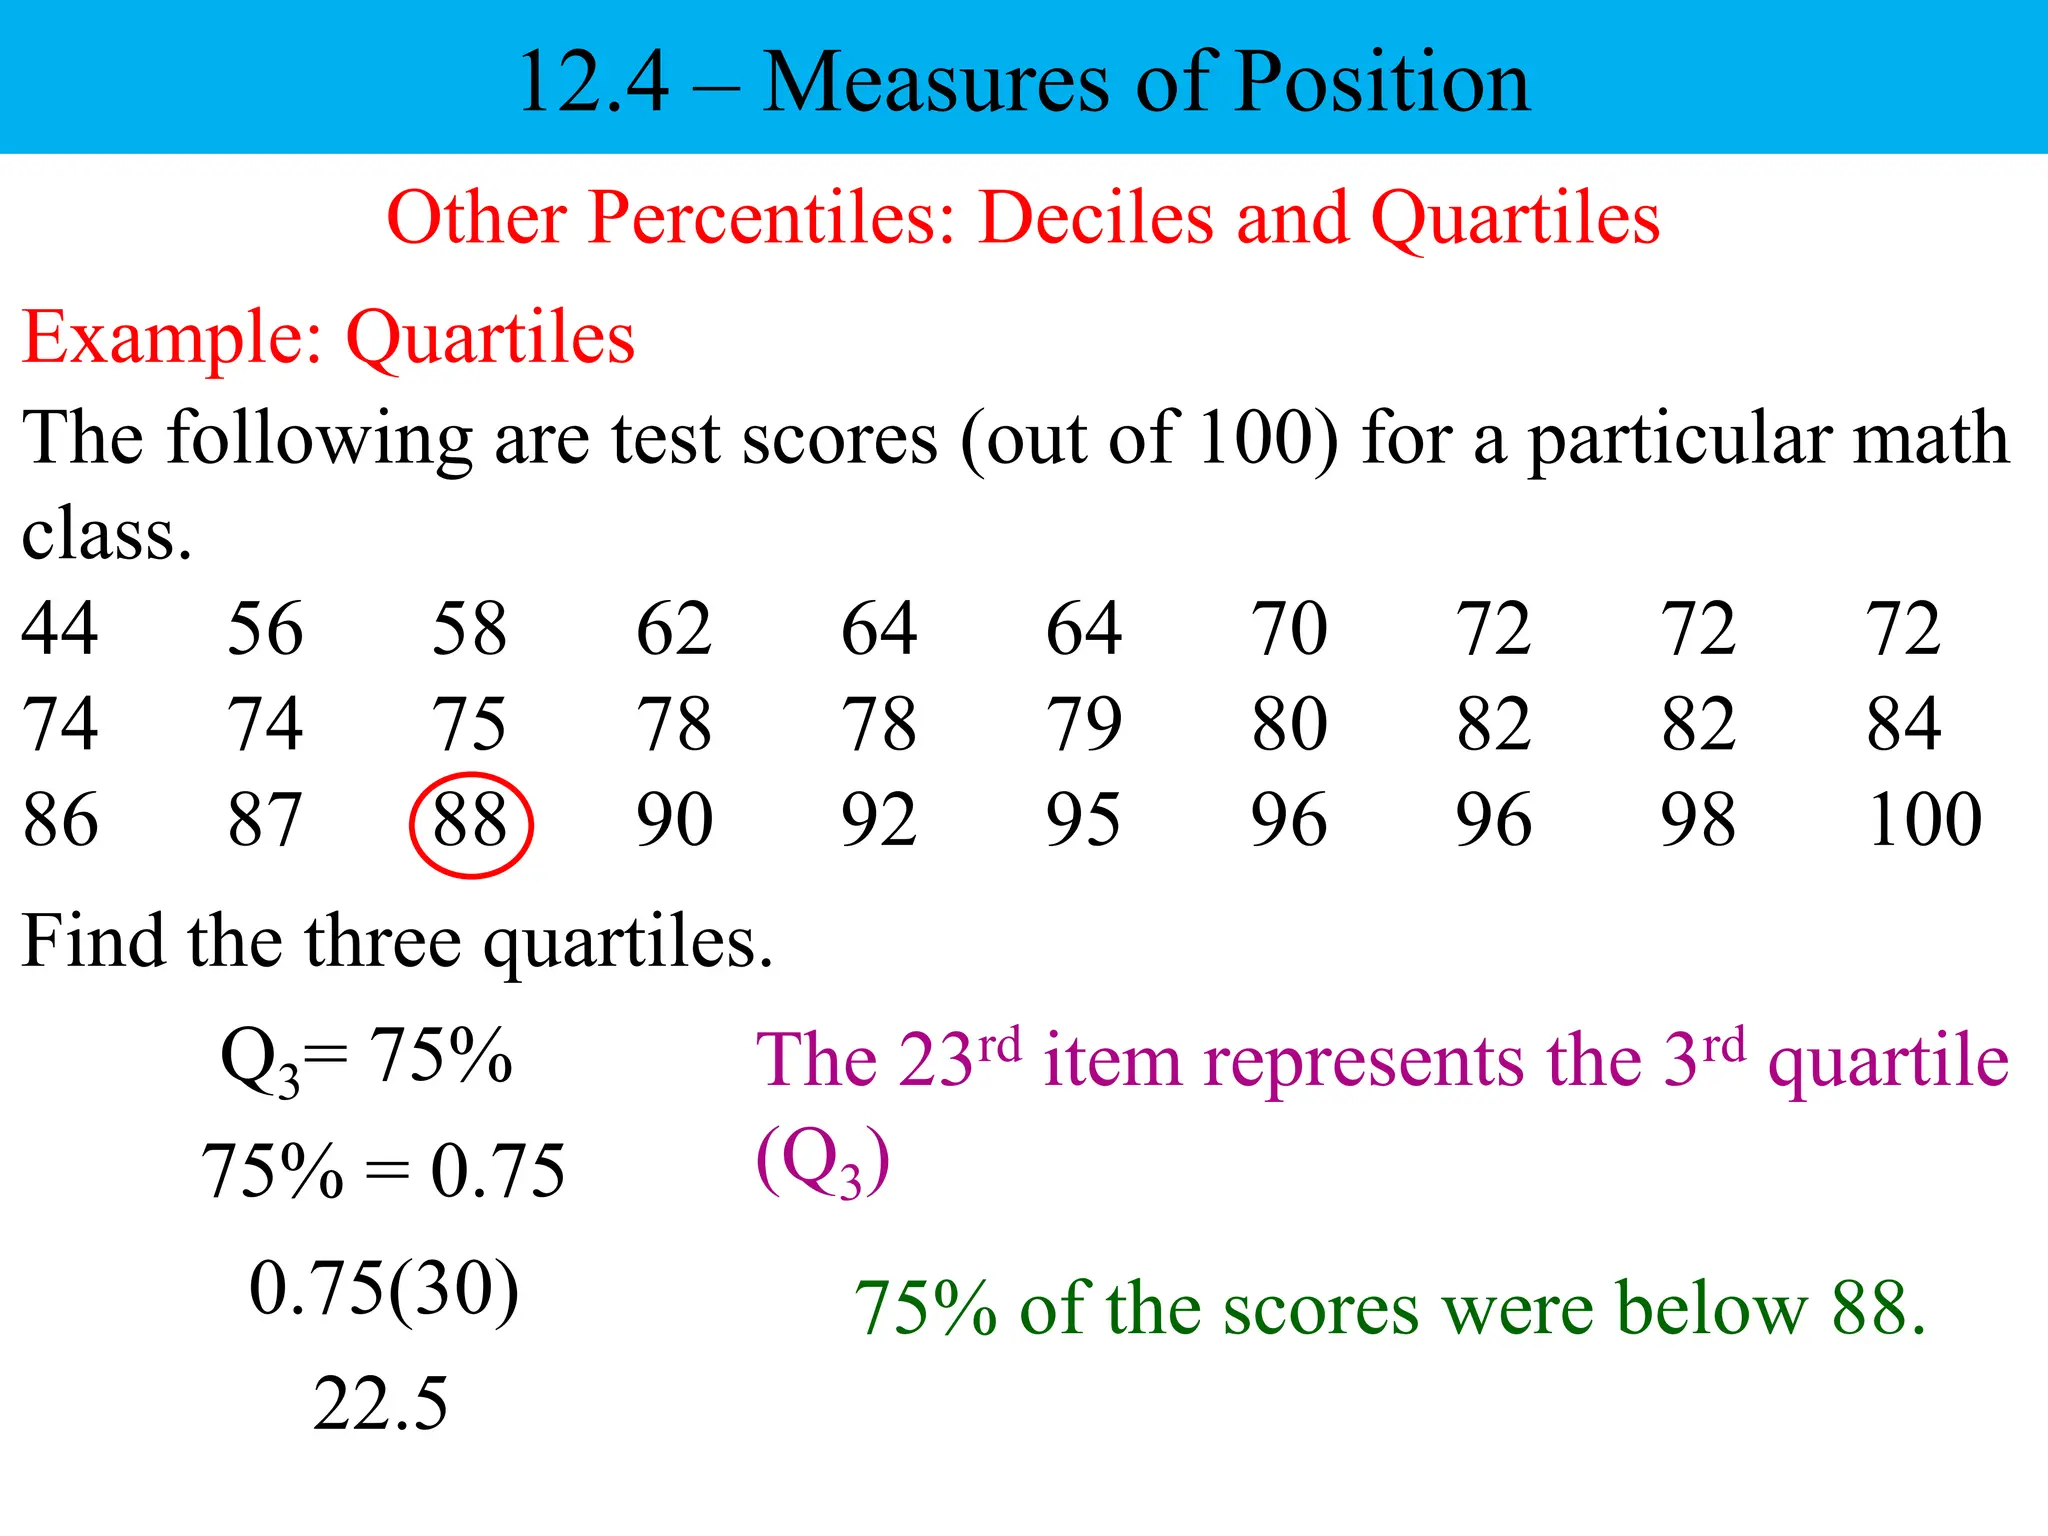
12.4 – Measures of Position
It is necessary at times, to be able to measure how an item fits
into the data, how it compares to other items of the data, or
even how it compares to another item in another data set.
In some cases, the analysis of certain individual items in the
data set is of more interest rather than the entire set.
Measures of position are several common ways of creating
such comparisons.
Standardized tests taken by larger numbers of students,
convert raw scores to a percentile score.
Percentiles
12.4 – Measures of Position
If approximately n percent of the items in a distribution are
less than the number x, then x is the nth percentile of the
distribution, denoted Pn.
A percentile measure the position of a single data item based
on the percentage of data items below that single data item.
Example:
The following are test scores (out of 100) for a particular math
class.
44 56 58 62 64 64 70 72 72 72
74 74 75 78 78 79 80 82 82 84
86 87 88 90 92 95 96 96 98 100
Find the fortieth percentile.
Percentiles
12.4 – Measures of Position
40% = 0.4
0.4(30)
12 40% of the scores were below 74.5.
The average of the 12th and 13th items
represents the 40th percentile (P40).
Deciles are the nine values (denoted D1, D2,…, D9) along the
scale that divide a data set into ten (approximately) equal
parts.
Other Percentiles: Deciles and Quartiles
12.4 – Measures of Position
Quartiles are the three values (Q1, Q2, Q3) that divide the data
set into four (approximately) equal parts.
10%, 20%, 30%, 40%, 50%, 60%, 70%, 80%, and 90%
25%, 50%, and 75%
Example: Deciles
The following are test scores (out of 100) for a particular math
class.
44 56 58 62 64 64 70 72 72 72
74 74 75 78 78 79 80 82 82 84
86 87 88 90 92 95 96 96 98 100
Find the sixth decile.
Other Percentiles: Deciles and Quartiles
12.4 – Measures of Position
Sixth decile = 60%
60% = 0.6
0.6(30)
18
60% of the scores were at or below 82.
The average of the 18th and 19th items
represents the 6th decile (D6).
Quartiles
For any set of data (ranked in order from least to greatest):
Other Percentiles: Deciles and Quartiles
12.4 – Measures of Position
The first quartile, Q1 (25%) is the median of items below Q2.
The second quartile, Q2 (50%) is the median.
The third quartile, Q3 (75%) is the median of items above Q2.
Example: Quartiles
The following are test scores (out of 100) for a particular math
class.
44 56 58 62 64 64 70 72 72 72
74 74 75 78 78 79 80 82 82 84
86 87 88 90 92 95 96 96 98 100
Find the three quartiles.
Other Percentiles: Deciles and Quartiles
12.4 – Measures of Position
Q1= 25%
25% = 0.25
0.25(30)
7.5
The 8th item represents the 1st quartile
(Q1)
25% of the scores were below 72.
Example: Quartiles
The following are test scores (out of 100) for a particular math
class.
44 56 58 62 64 64 70 72 72 72
74 74 75 78 78 79 80 82 82 84
86 87 88 90 92 95 96 96 98 100
Find the three quartiles.
Other Percentiles: Deciles and Quartiles
12.4 – Measures of Position
Q2= 50% = median
50% = 0.5
0.5(30)
15
The average of the 15th and 16th items
represents the 2nd quartile (Q2) or the
median
50% of the scores were below 78.5.
Example: Quartiles
The following are test scores (out of 100) for a particular math
class.
44 56 58 62 64 64 70 72 72 72
74 74 75 78 78 79 80 82 82 84
86 87 88 90 92 95 96 96 98 100
Find the three quartiles.
Other Percentiles: Deciles and Quartiles
12.4 – Measures of Position
Q3= 75%
75% = 0.75
0.75(30)
22.5
The 23rd item represents the 3rd quartile
(Q3)
75% of the scores were below 88.

Introduction and explanations on percentiles and deciles

  • 1.
    12.4 – Measuresof Position It is necessary at times, to be able to measure how an item fits into the data, how it compares to other items of the data, or even how it compares to another item in another data set. In some cases, the analysis of certain individual items in the data set is of more interest rather than the entire set. Measures of position are several common ways of creating such comparisons.
  • 2.
    Standardized tests takenby larger numbers of students, convert raw scores to a percentile score. Percentiles 12.4 – Measures of Position If approximately n percent of the items in a distribution are less than the number x, then x is the nth percentile of the distribution, denoted Pn. A percentile measure the position of a single data item based on the percentage of data items below that single data item.
  • 3.
    Example: The following aretest scores (out of 100) for a particular math class. 44 56 58 62 64 64 70 72 72 72 74 74 75 78 78 79 80 82 82 84 86 87 88 90 92 95 96 96 98 100 Find the fortieth percentile. Percentiles 12.4 – Measures of Position 40% = 0.4 0.4(30) 12 40% of the scores were below 74.5. The average of the 12th and 13th items represents the 40th percentile (P40).
  • 4.
    Deciles are thenine values (denoted D1, D2,…, D9) along the scale that divide a data set into ten (approximately) equal parts. Other Percentiles: Deciles and Quartiles 12.4 – Measures of Position Quartiles are the three values (Q1, Q2, Q3) that divide the data set into four (approximately) equal parts. 10%, 20%, 30%, 40%, 50%, 60%, 70%, 80%, and 90% 25%, 50%, and 75%
  • 5.
    Example: Deciles The followingare test scores (out of 100) for a particular math class. 44 56 58 62 64 64 70 72 72 72 74 74 75 78 78 79 80 82 82 84 86 87 88 90 92 95 96 96 98 100 Find the sixth decile. Other Percentiles: Deciles and Quartiles 12.4 – Measures of Position Sixth decile = 60% 60% = 0.6 0.6(30) 18 60% of the scores were at or below 82. The average of the 18th and 19th items represents the 6th decile (D6).
  • 6.
    Quartiles For any setof data (ranked in order from least to greatest): Other Percentiles: Deciles and Quartiles 12.4 – Measures of Position The first quartile, Q1 (25%) is the median of items below Q2. The second quartile, Q2 (50%) is the median. The third quartile, Q3 (75%) is the median of items above Q2.
  • 7.
    Example: Quartiles The followingare test scores (out of 100) for a particular math class. 44 56 58 62 64 64 70 72 72 72 74 74 75 78 78 79 80 82 82 84 86 87 88 90 92 95 96 96 98 100 Find the three quartiles. Other Percentiles: Deciles and Quartiles 12.4 – Measures of Position Q1= 25% 25% = 0.25 0.25(30) 7.5 The 8th item represents the 1st quartile (Q1) 25% of the scores were below 72.
  • 8.
    Example: Quartiles The followingare test scores (out of 100) for a particular math class. 44 56 58 62 64 64 70 72 72 72 74 74 75 78 78 79 80 82 82 84 86 87 88 90 92 95 96 96 98 100 Find the three quartiles. Other Percentiles: Deciles and Quartiles 12.4 – Measures of Position Q2= 50% = median 50% = 0.5 0.5(30) 15 The average of the 15th and 16th items represents the 2nd quartile (Q2) or the median 50% of the scores were below 78.5.
  • 9.
    Example: Quartiles The followingare test scores (out of 100) for a particular math class. 44 56 58 62 64 64 70 72 72 72 74 74 75 78 78 79 80 82 82 84 86 87 88 90 92 95 96 96 98 100 Find the three quartiles. Other Percentiles: Deciles and Quartiles 12.4 – Measures of Position Q3= 75% 75% = 0.75 0.75(30) 22.5 The 23rd item represents the 3rd quartile (Q3) 75% of the scores were below 88.