Downloaded 468 times
![2. What is R ?
WEB:
OFICIAL WEB: http://www.r-project.org/index.html
QUICK-R: http://www.statmethods.net/index.html
BOOKS:
Introductory Statistics with R (Statistics and Computing), P. Dalgaard
[available as manual at R project web]
The R Book, MJ. Crawley
R itself: help() and example()](https://image.slidesharecdn.com/10098380-111109214850-phpapp01/85/GoTermsAnalysisWithR-9-320.jpg)
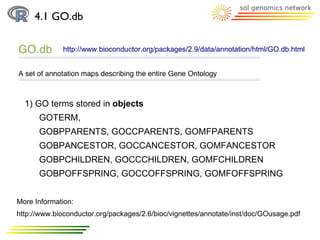
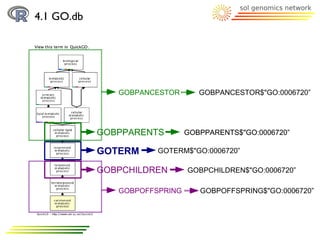
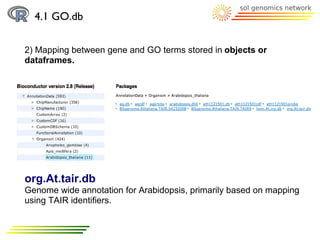
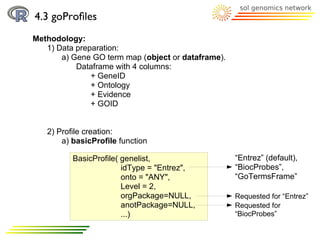
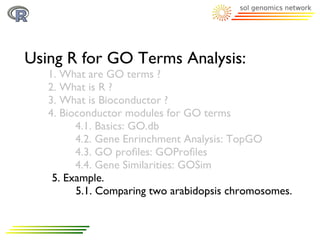
![4.1 GO.db
2) Mapping between gene and GO terms stored in objects
(annotate package) or dataframes.
> library("org.At.tair.db")
> org.At.tairGO[["AT5G58560"]]
Use a list:
> org.At.tairGO[["AT5G58560"]][[1]]$Ontology
Functions (“annotate” package):
+ getOntology(inlist, gocategorylist)
+ getEvidence(inlist)
> getOntology(org.At.tairGO[["AT5G58560"]])
> getEvidence(org.At.tairGO[["AT5G58560"]])](https://image.slidesharecdn.com/10098380-111109214850-phpapp01/85/GoTermsAnalysisWithR-24-320.jpg)
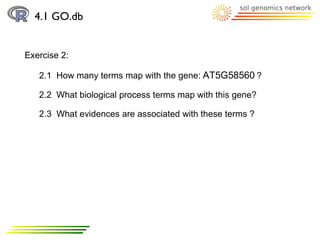

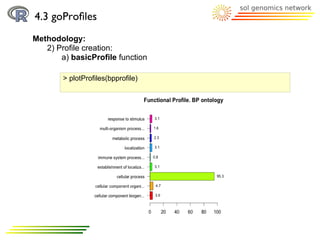
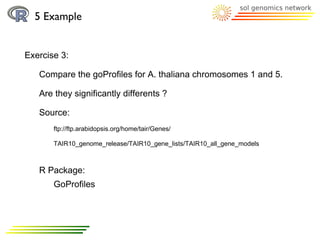
![4.3 goProfiles
Methodology:
2) Profile creation:
a) basicProfile function
> printProfiles(bpprofile)
Functional Profile
==================
[1] "BP ontology"
Description GOID Frequency
25 cellular component biogen... GO:0044085 5
14 cellular component organi... GO:0016043 6
12 cellular process GO:0009987 122
32 establishment of localiza... GO:0051234 4
4 immune system process... GO:0002376 1
31 localization GO:0051179 4
2 metabolic process GO:0008152 3
33 multi-organism process... GO:0051704 2
30 response to stimulus GO:0050896 4](https://image.slidesharecdn.com/10098380-111109214850-phpapp01/85/GoTermsAnalysisWithR-38-320.jpg)
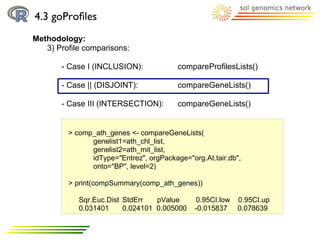
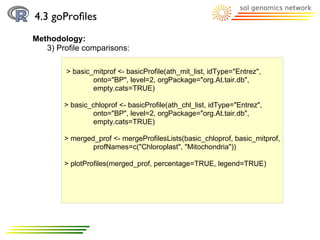
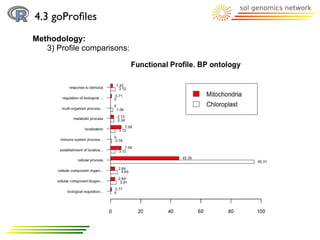
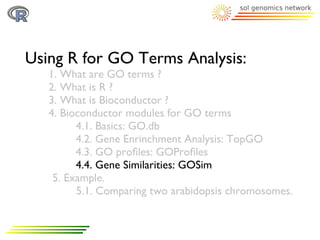
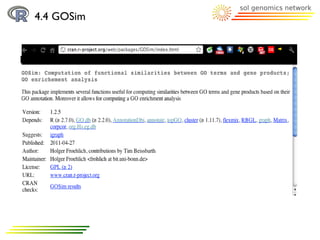

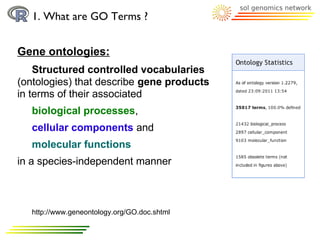
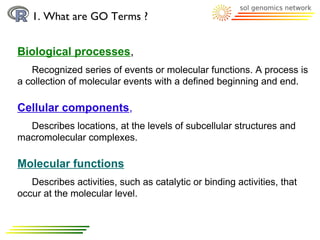
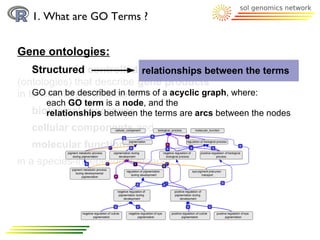
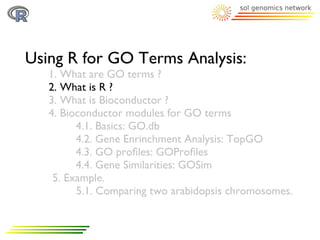
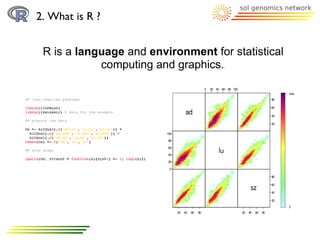
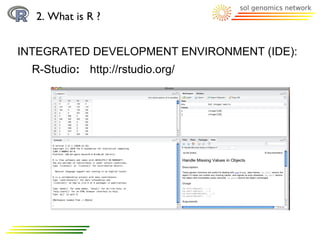
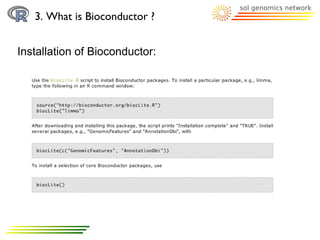
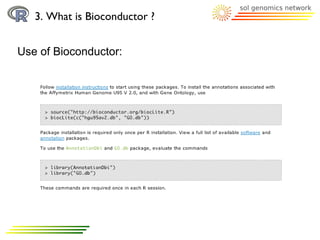
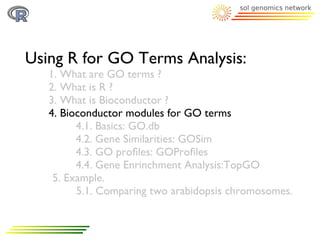
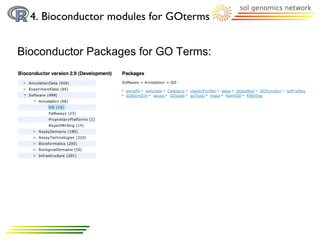
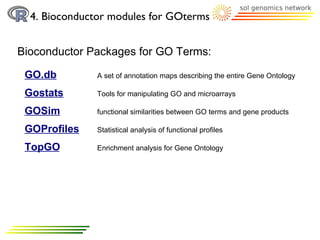
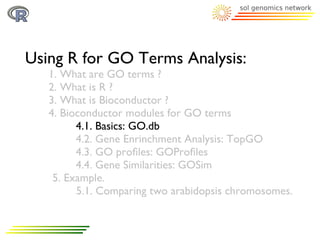
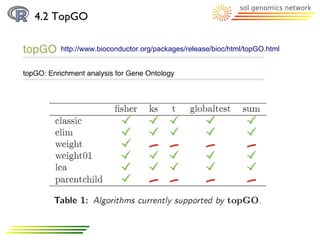
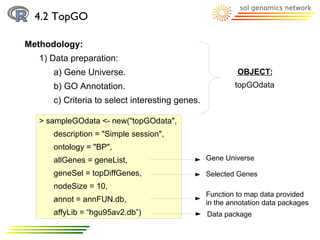
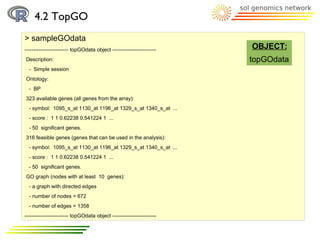
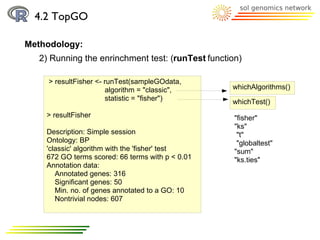
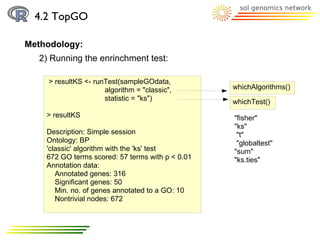
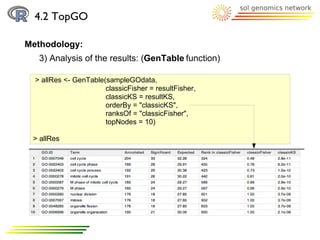
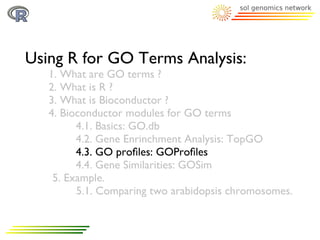
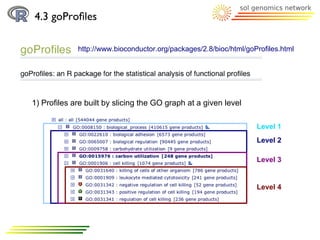
The document discusses using R and Bioconductor for gene ontology (GO) term analysis. It describes GO terms, R, and Bioconductor. It then outlines several Bioconductor packages for working with GO terms, including GO.db for basic GO term data, TopGO for gene enrichment analysis, GOProfiles for statistical analysis of functional profiles, and GOSim for analyzing gene similarities based on GO terms. An example is given of comparing GO terms between two Arabidopsis chromosomes using these tools.