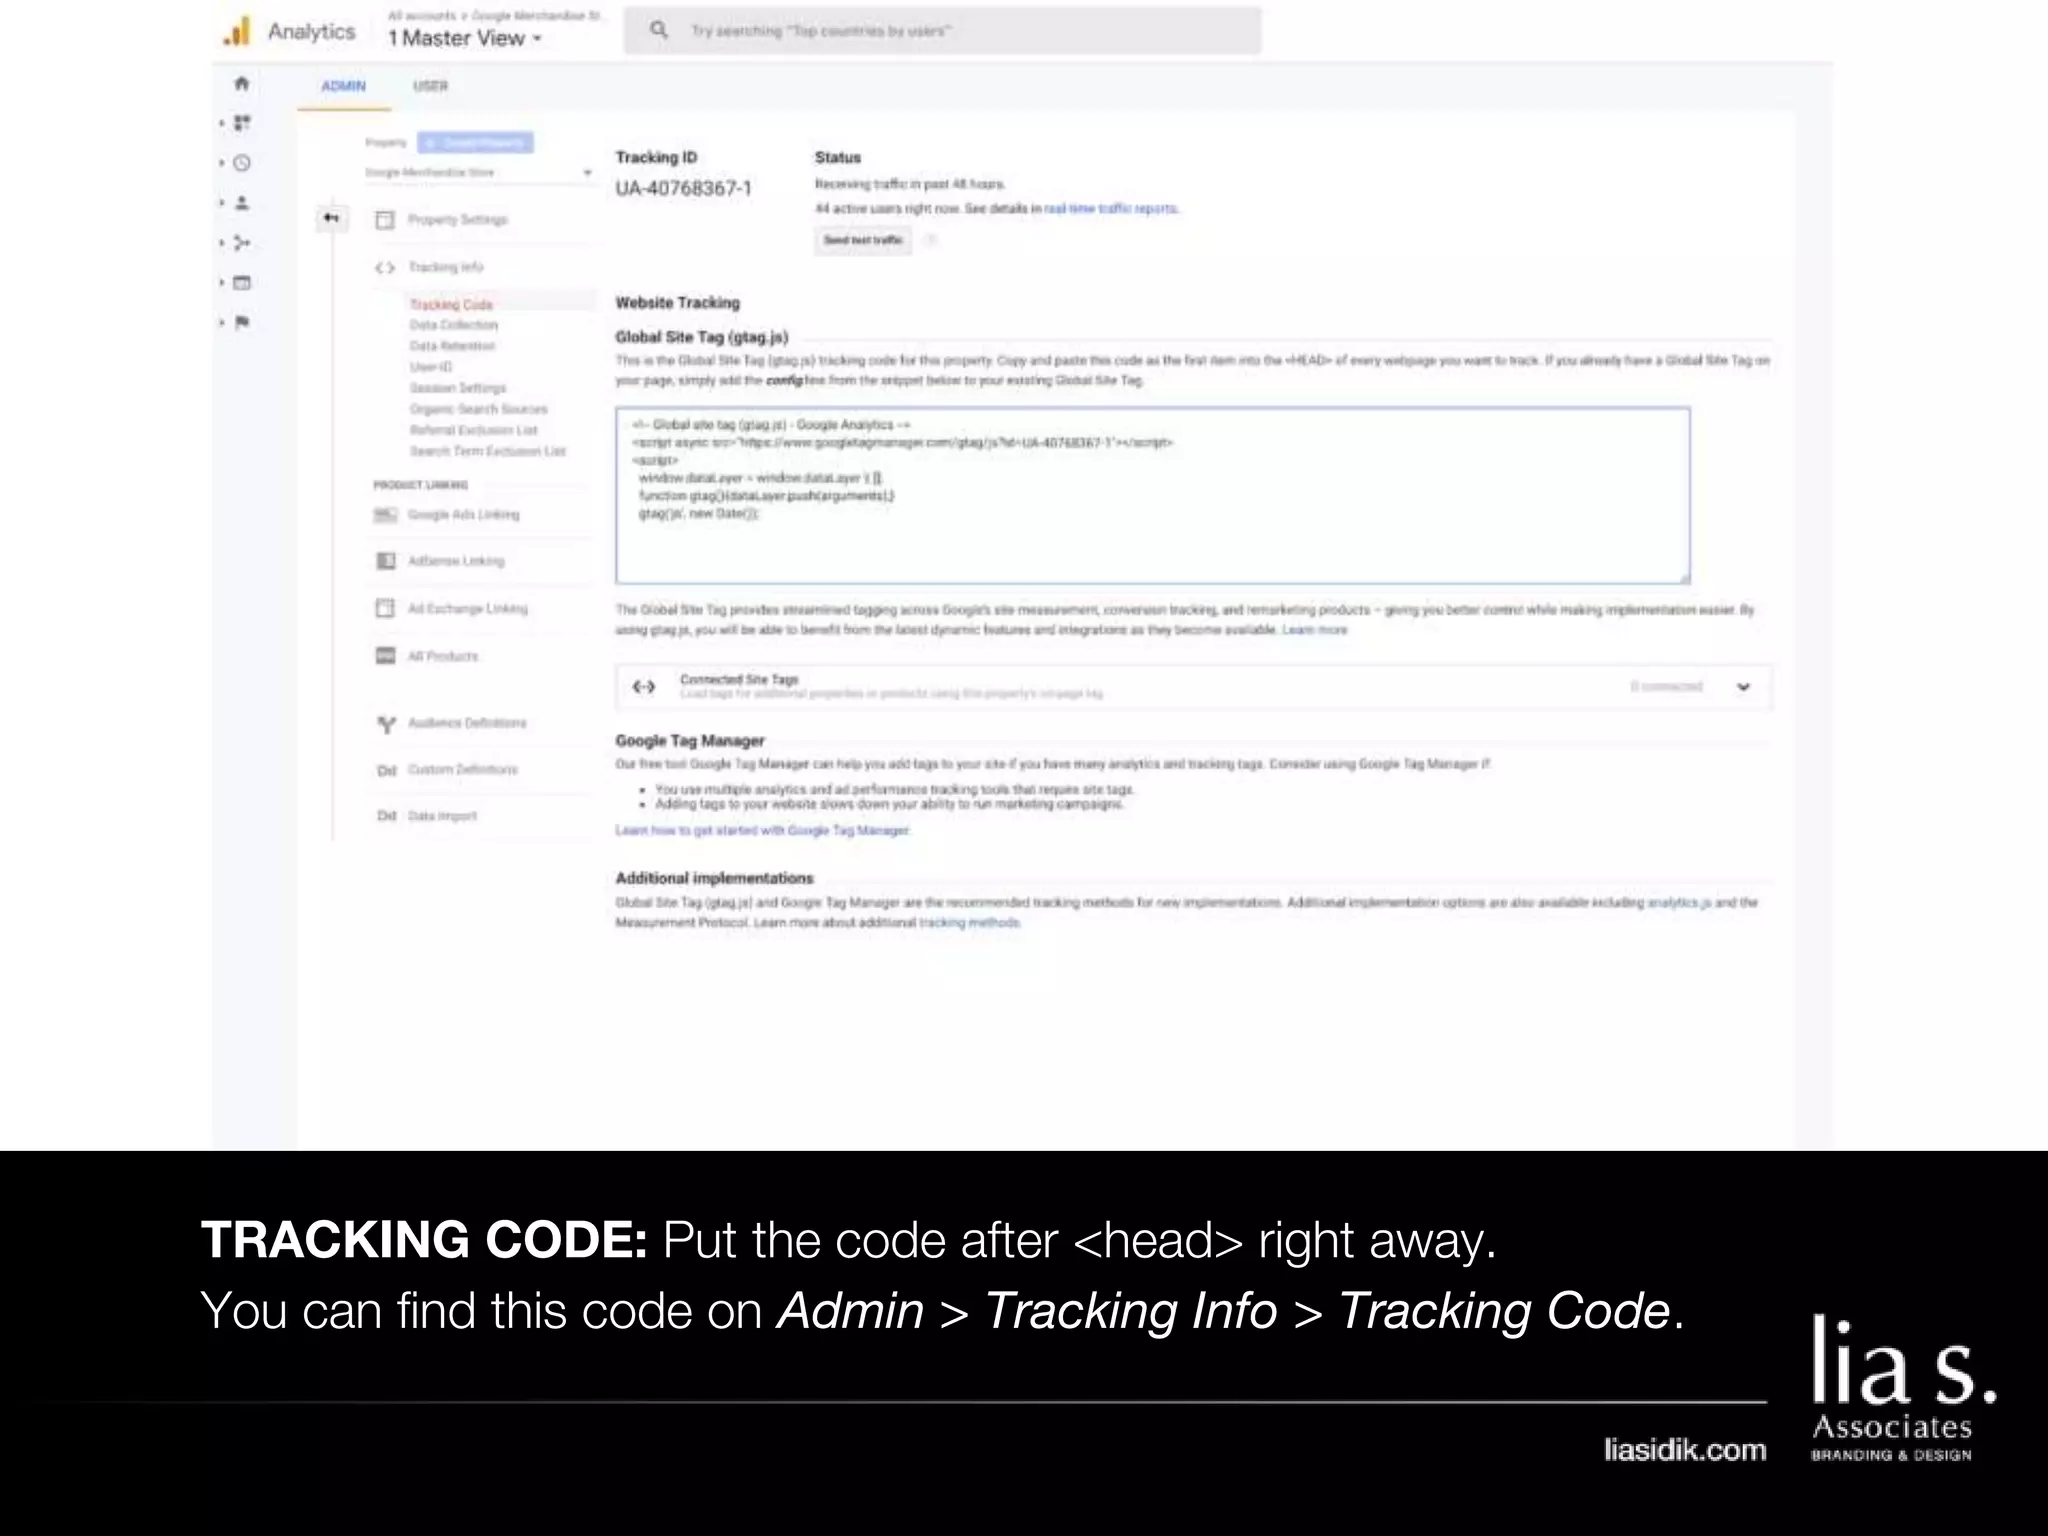
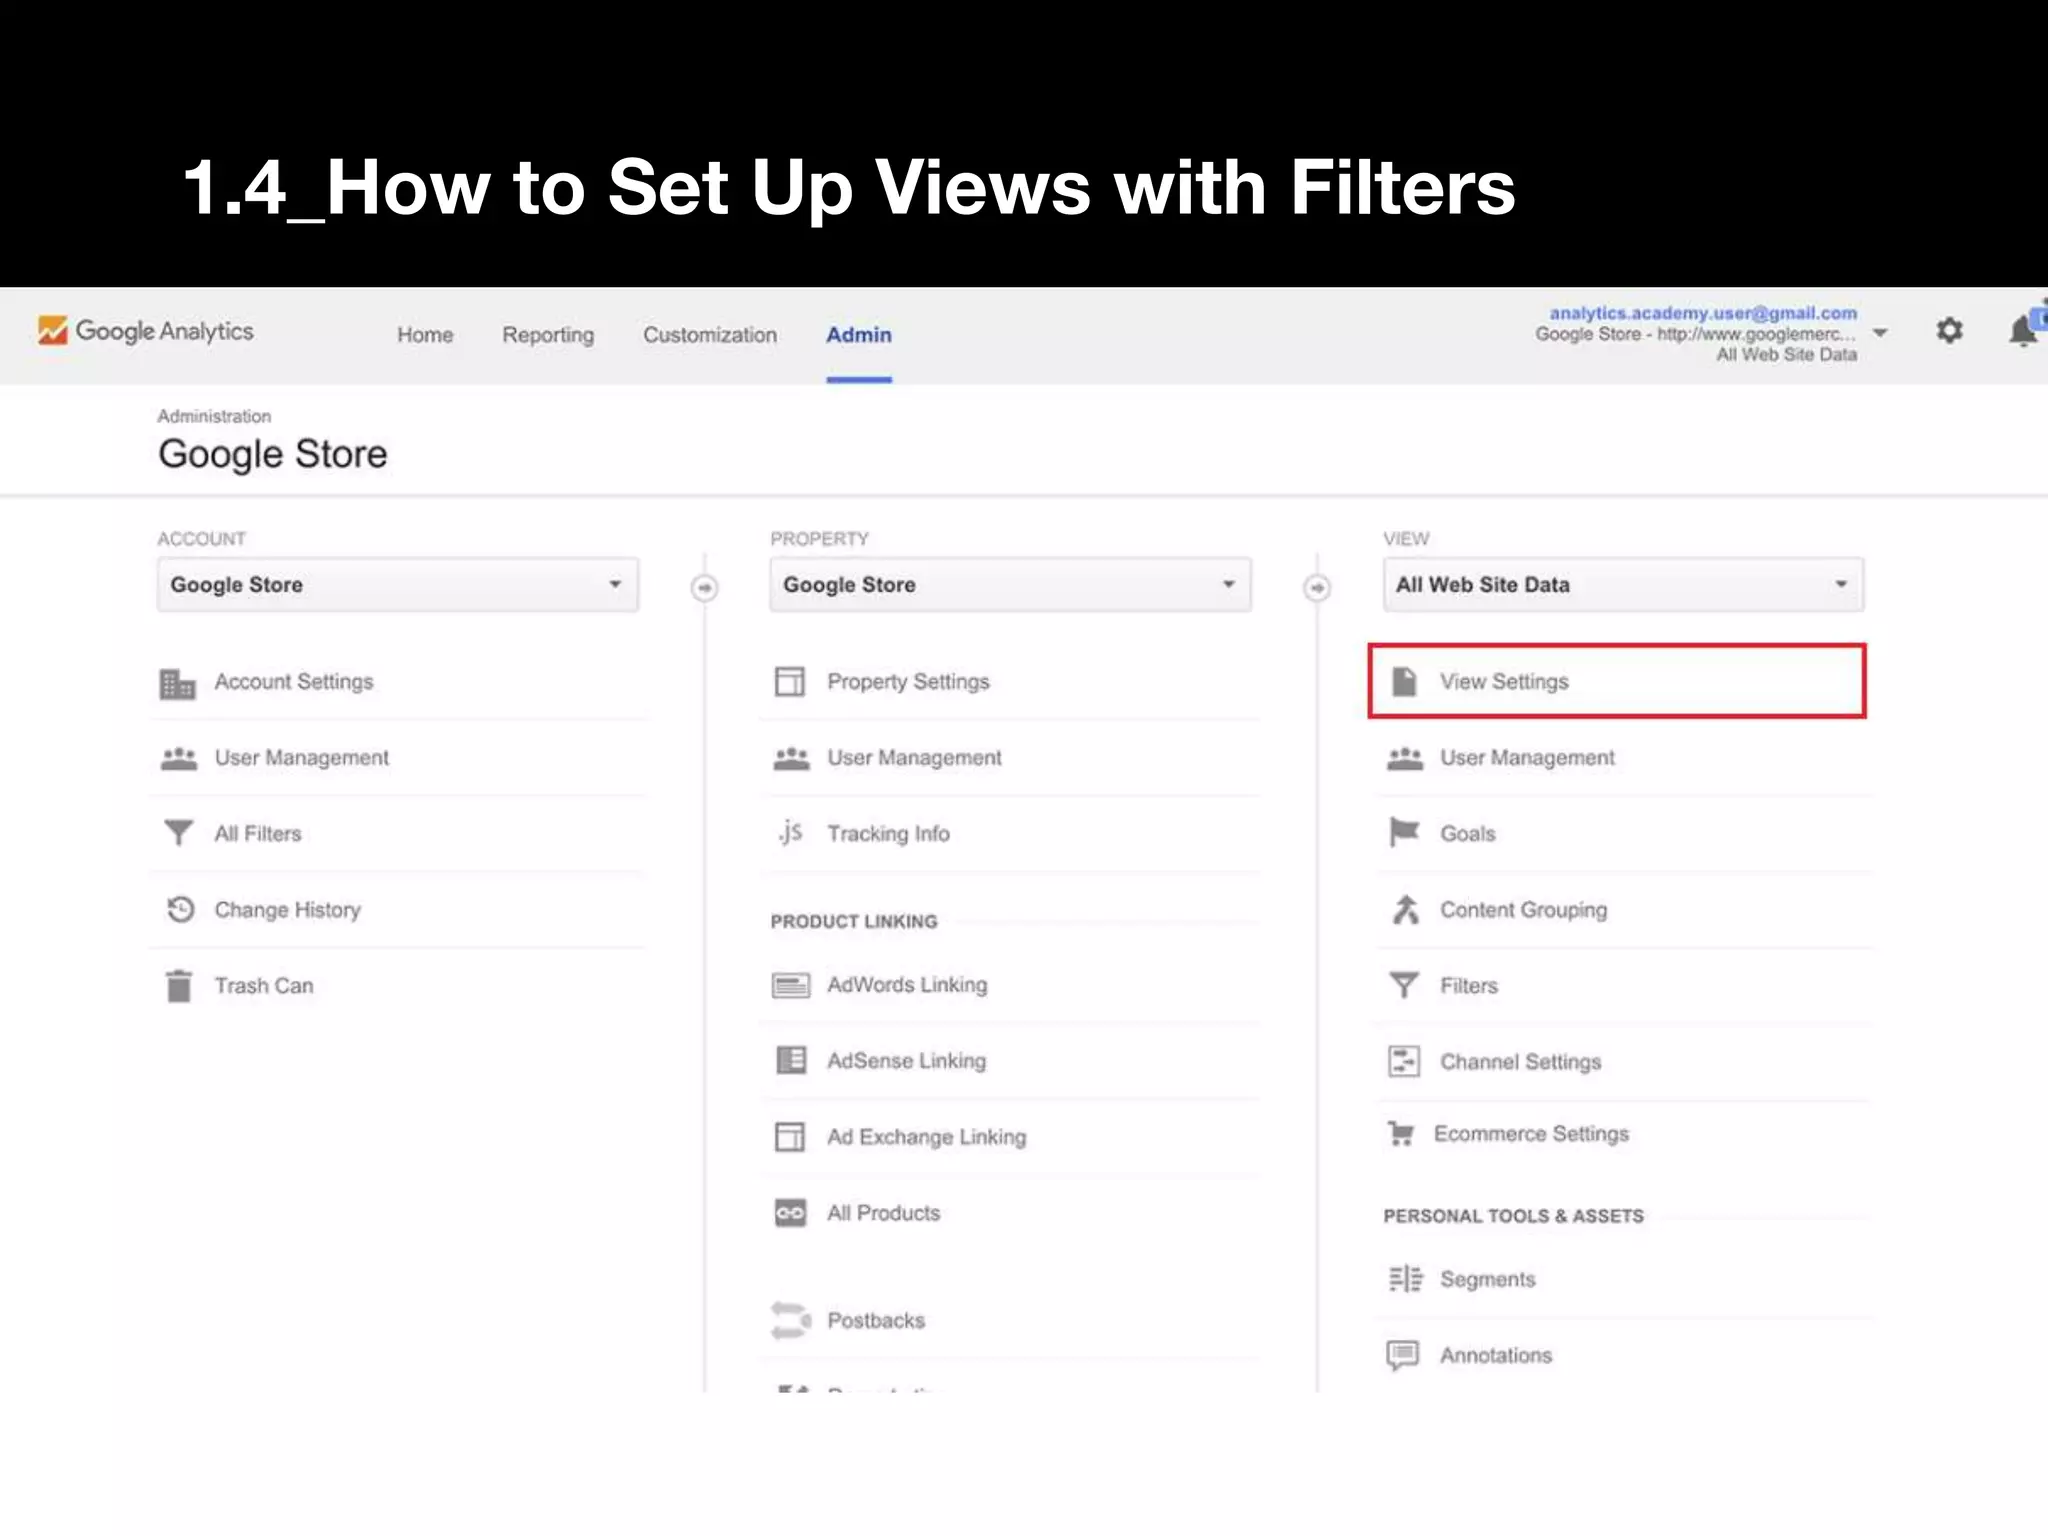
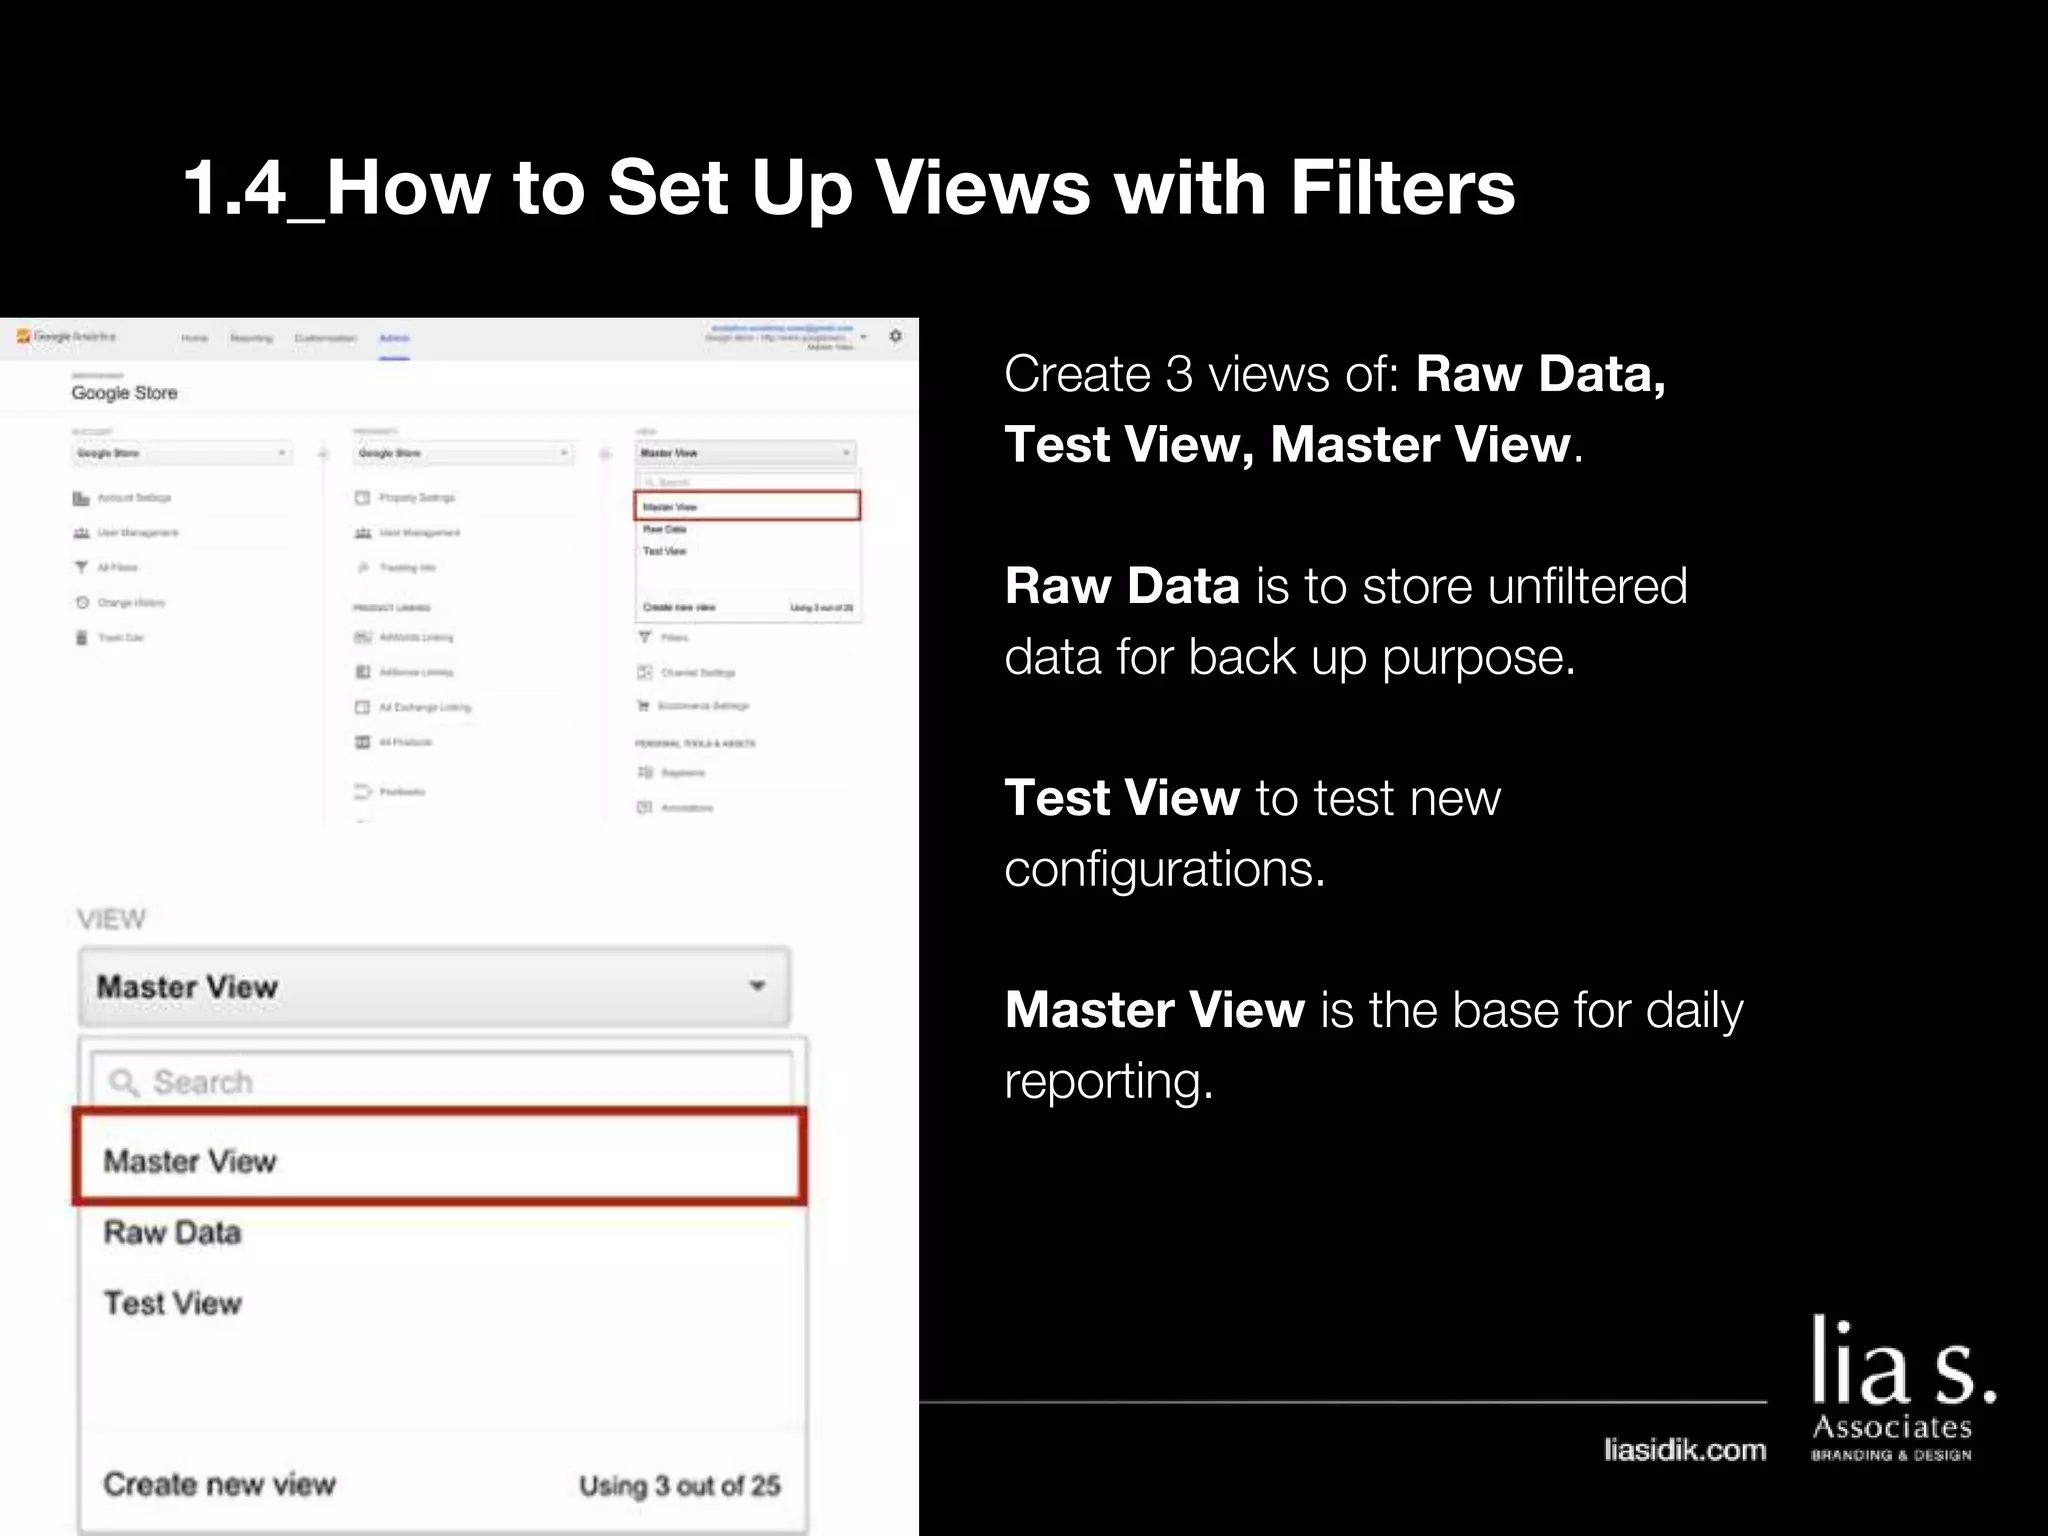
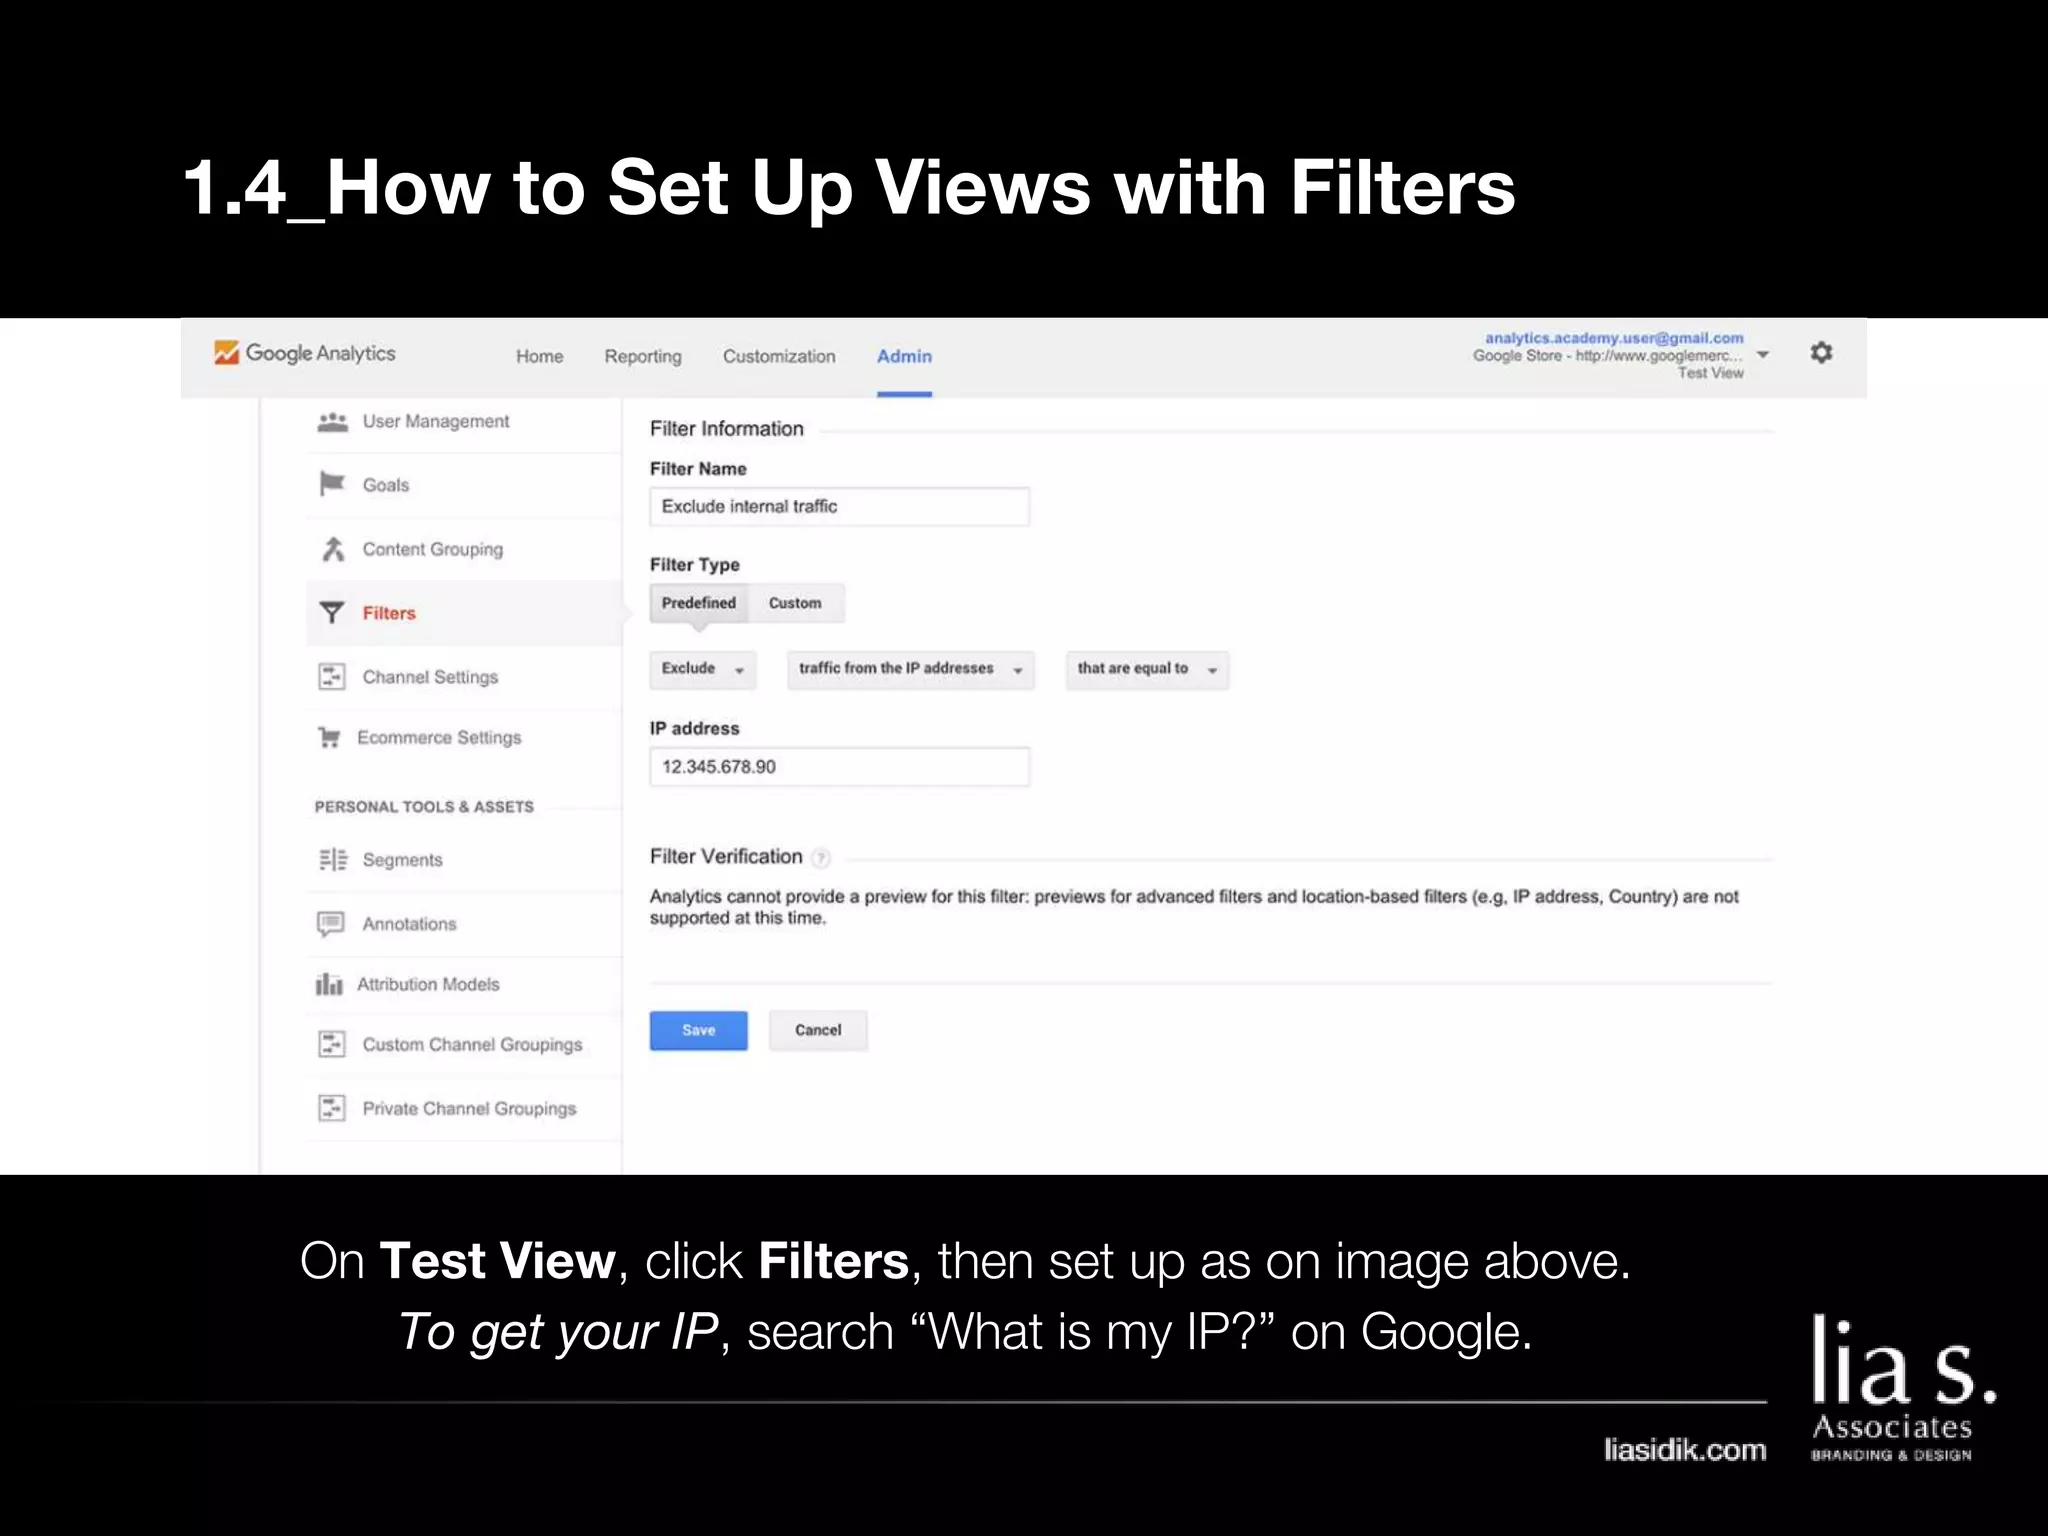
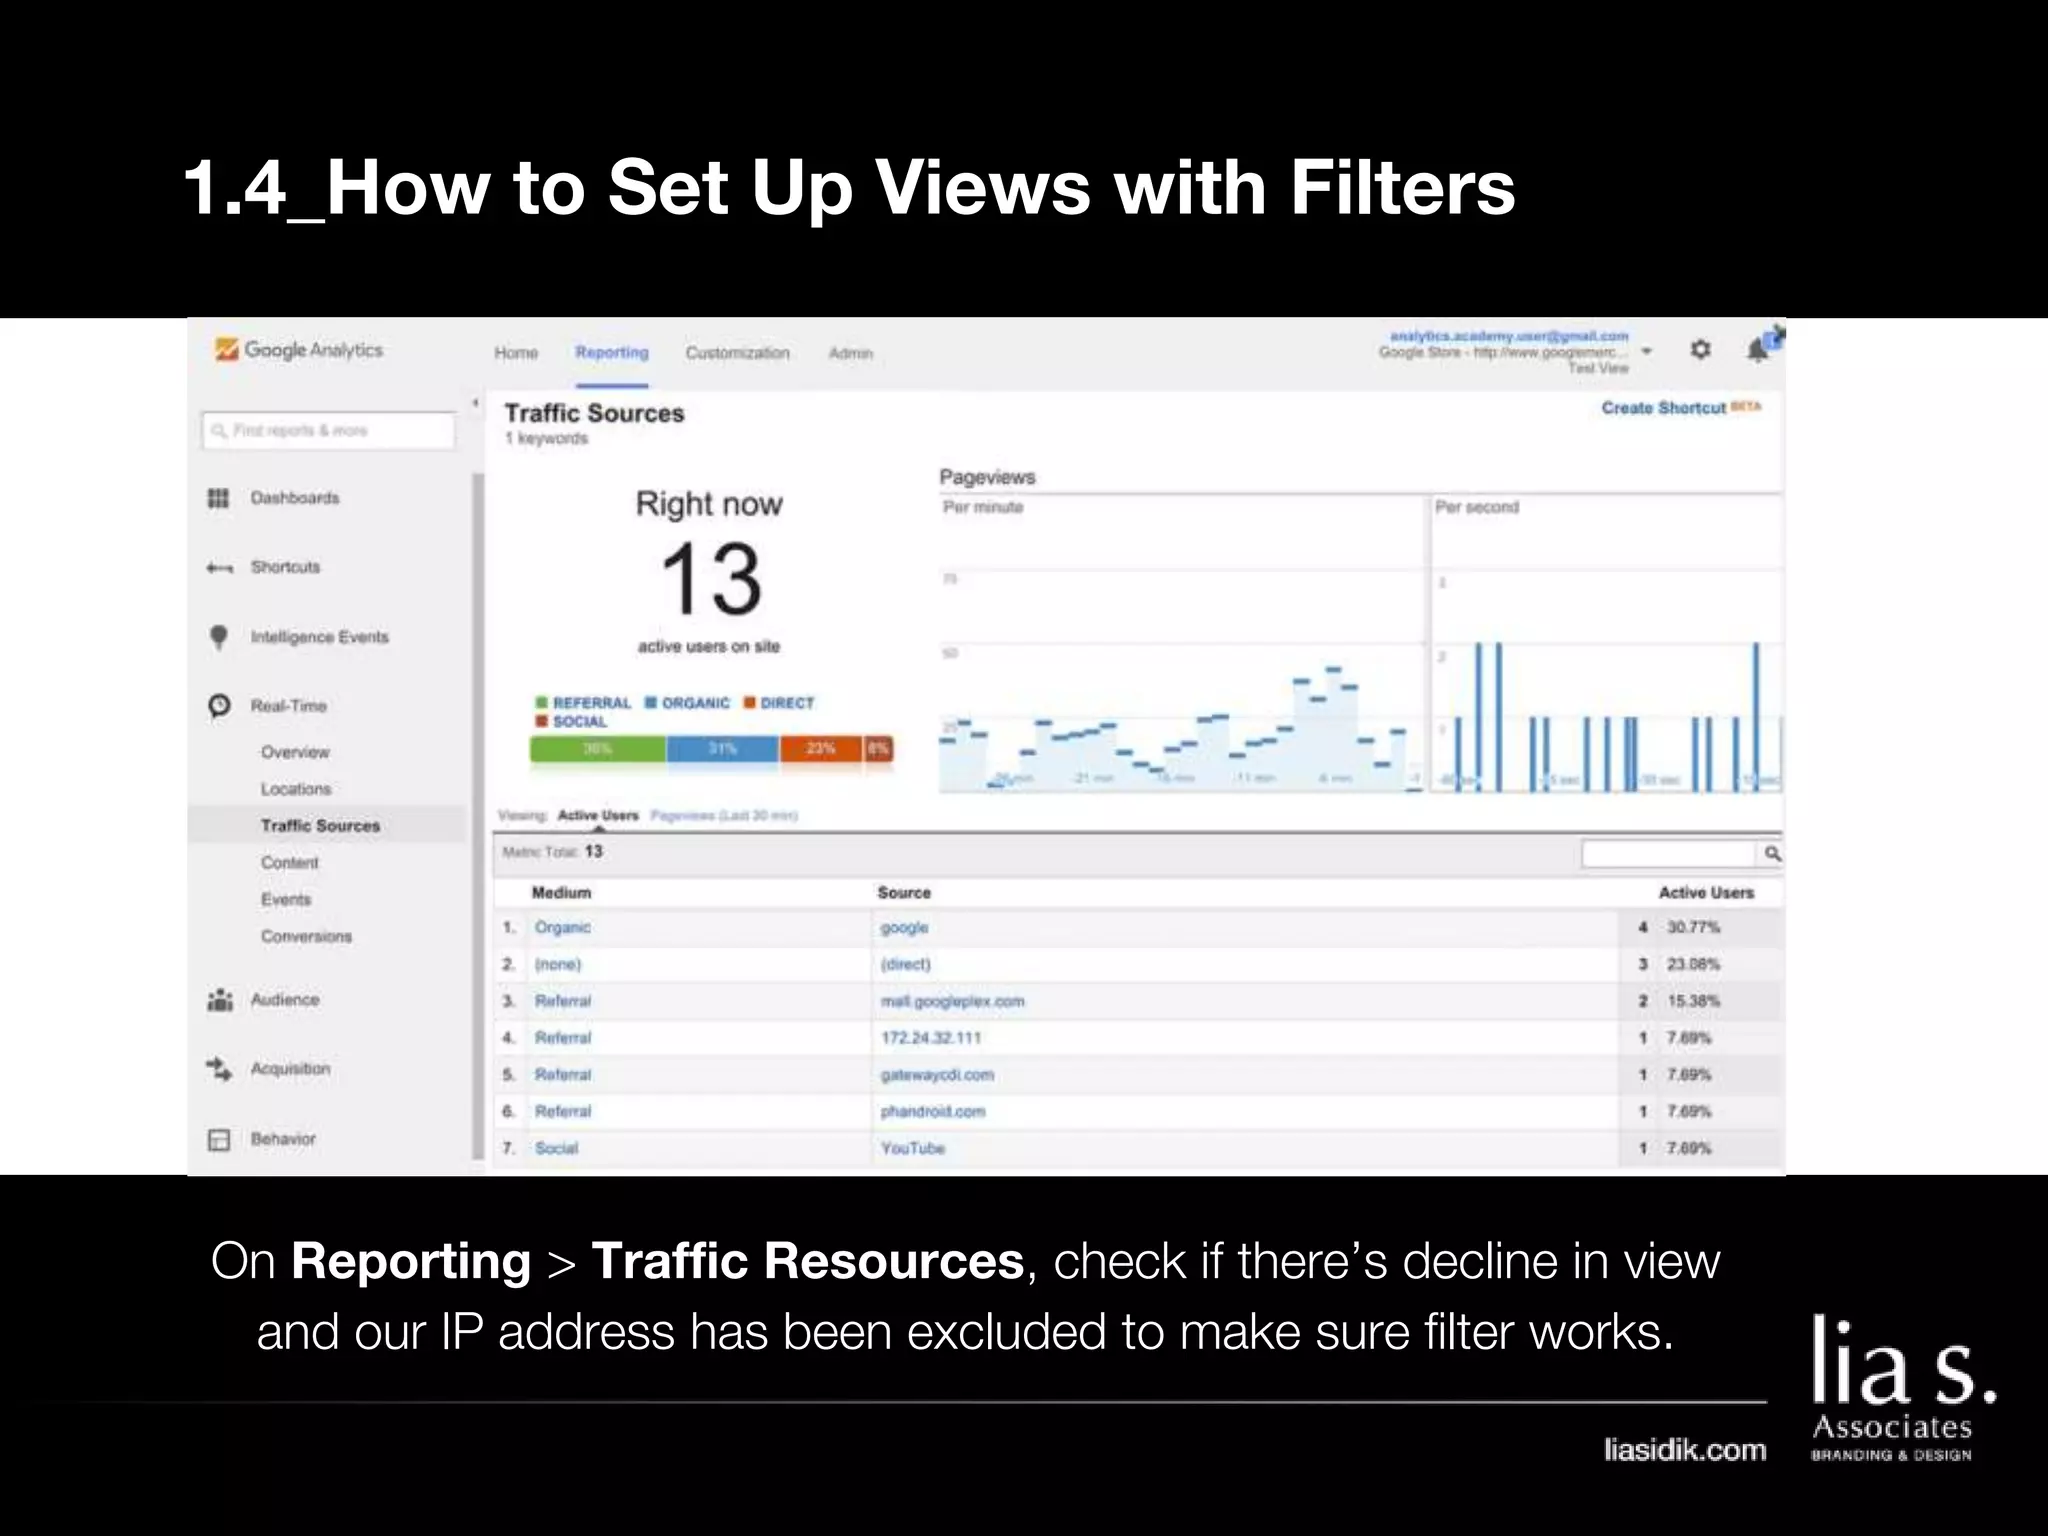
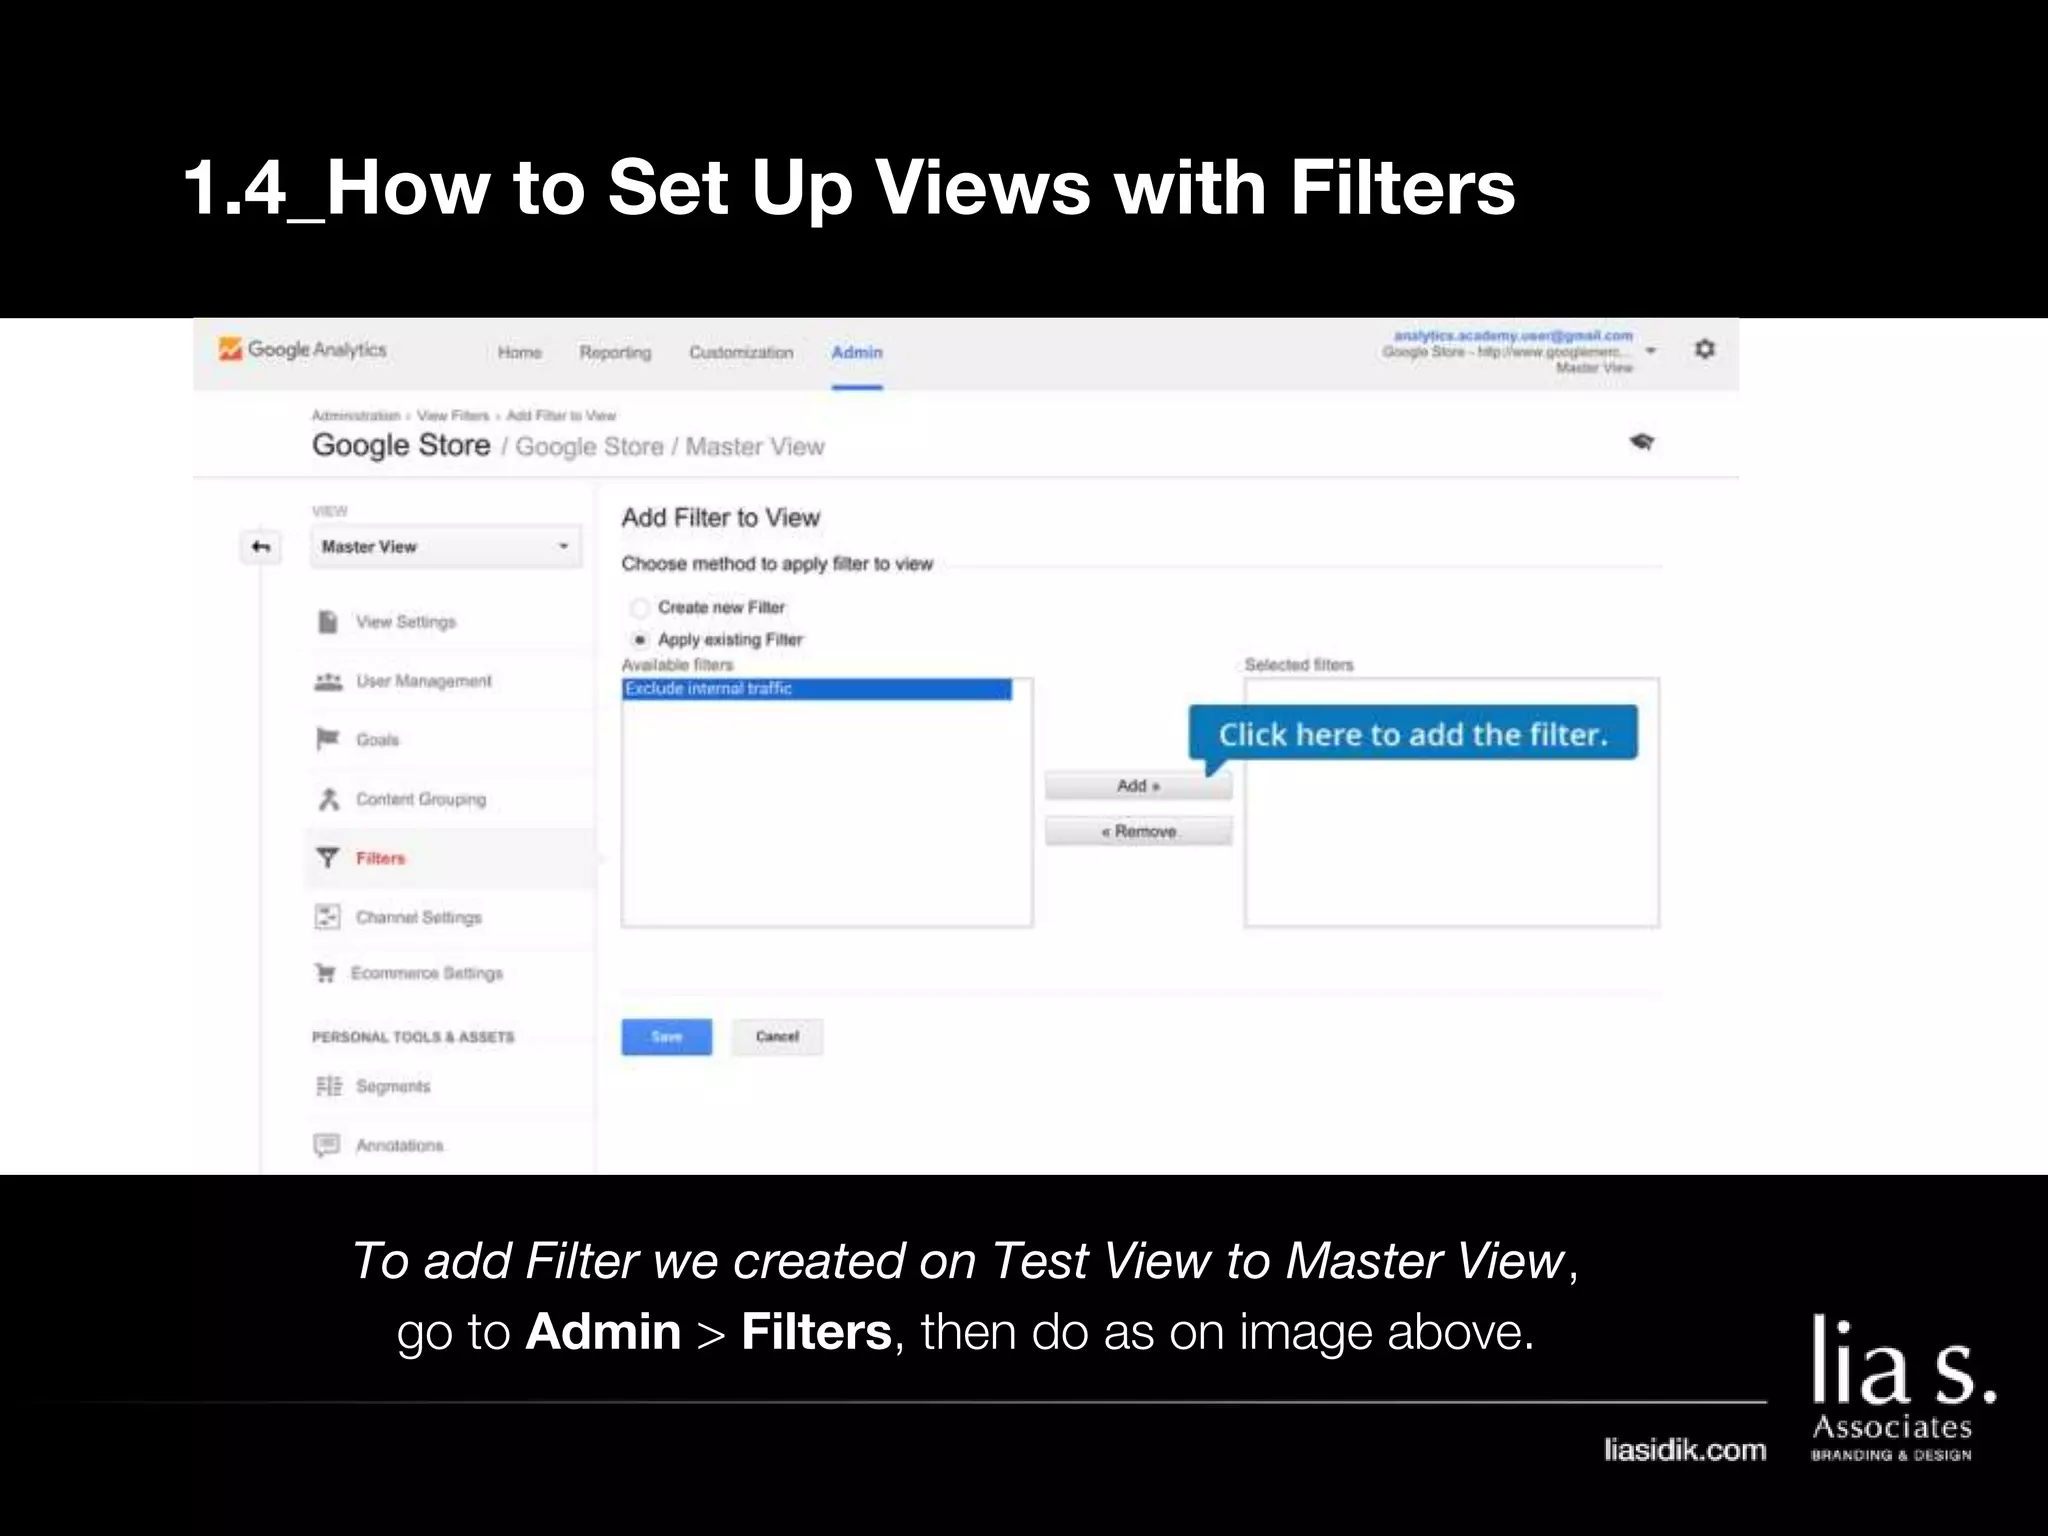
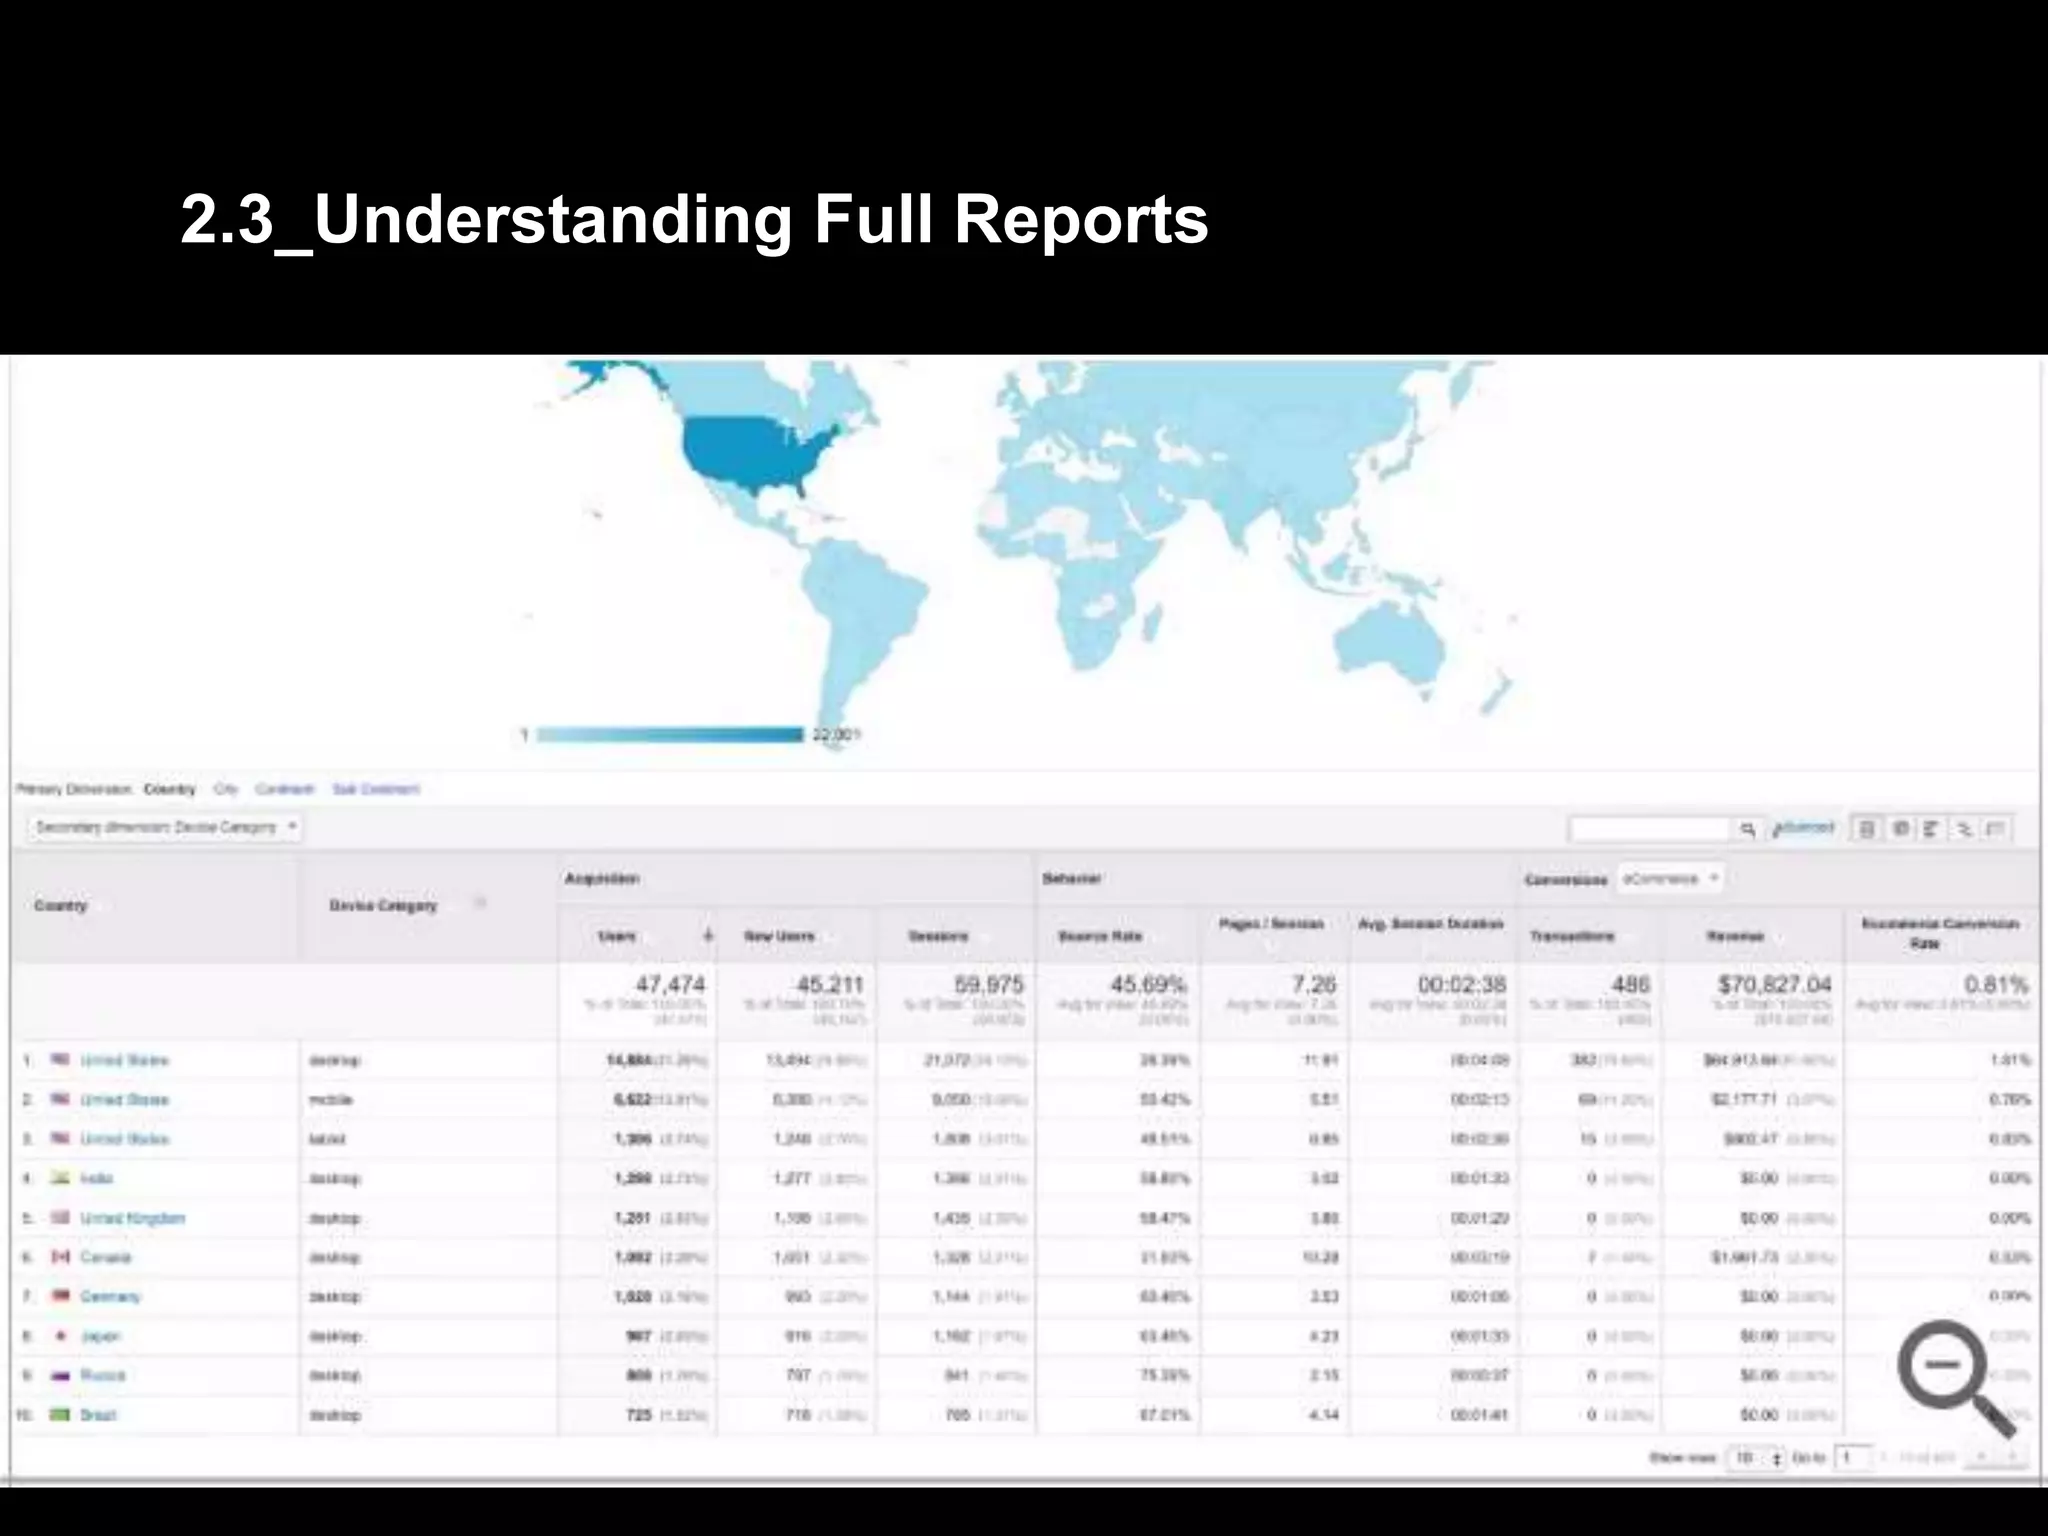
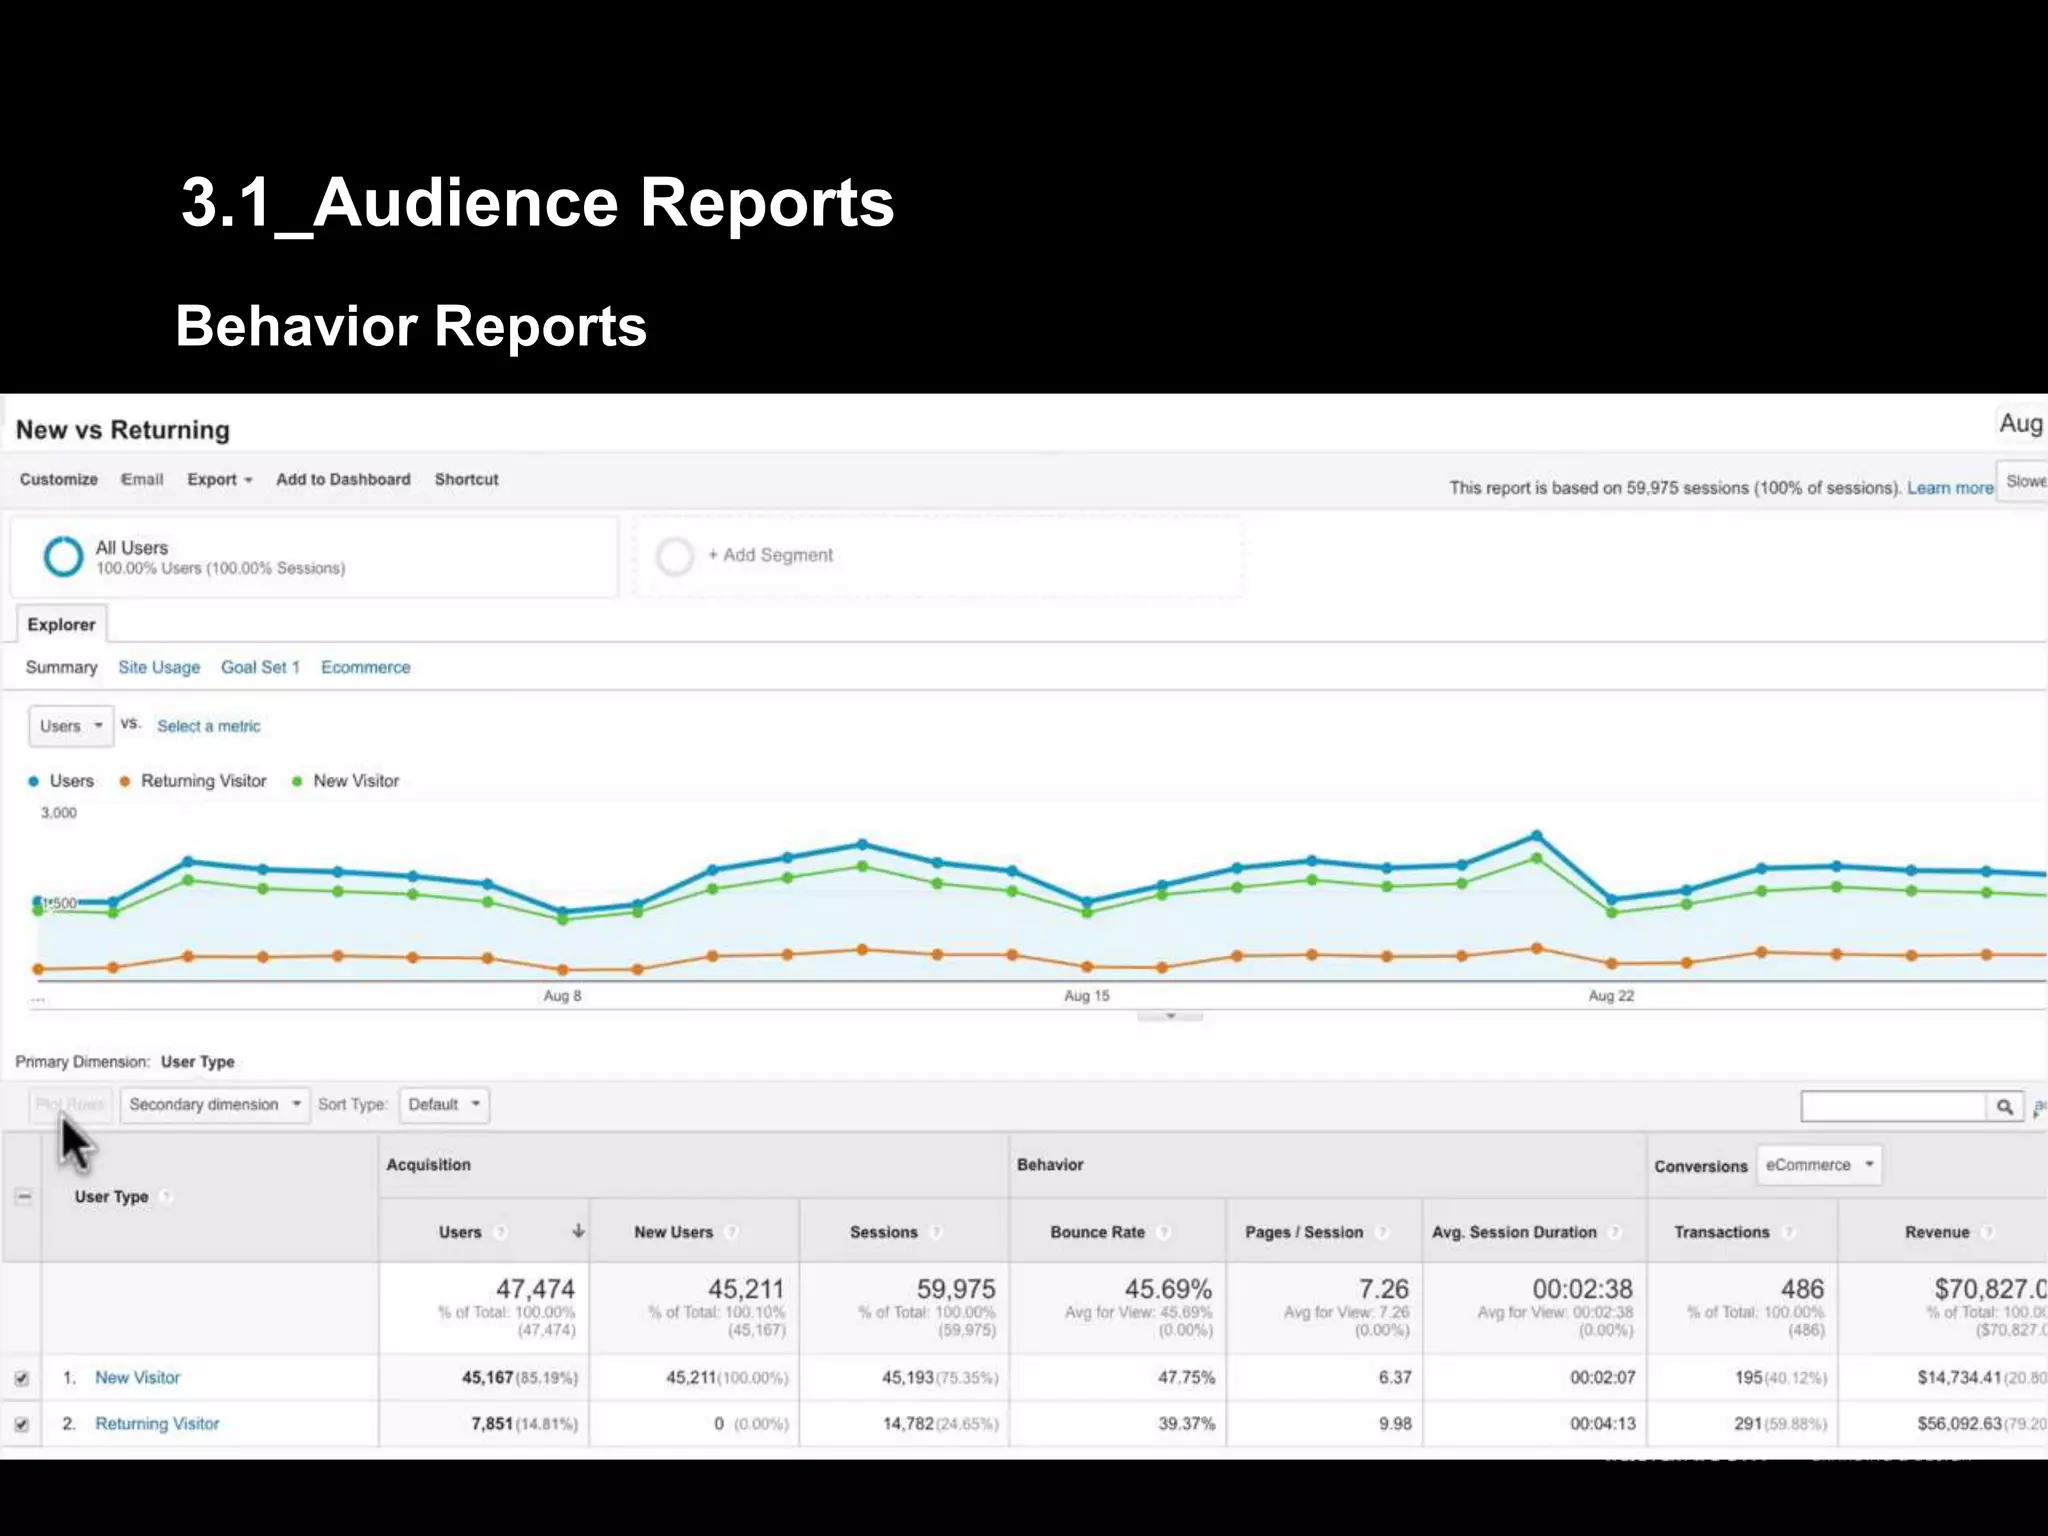
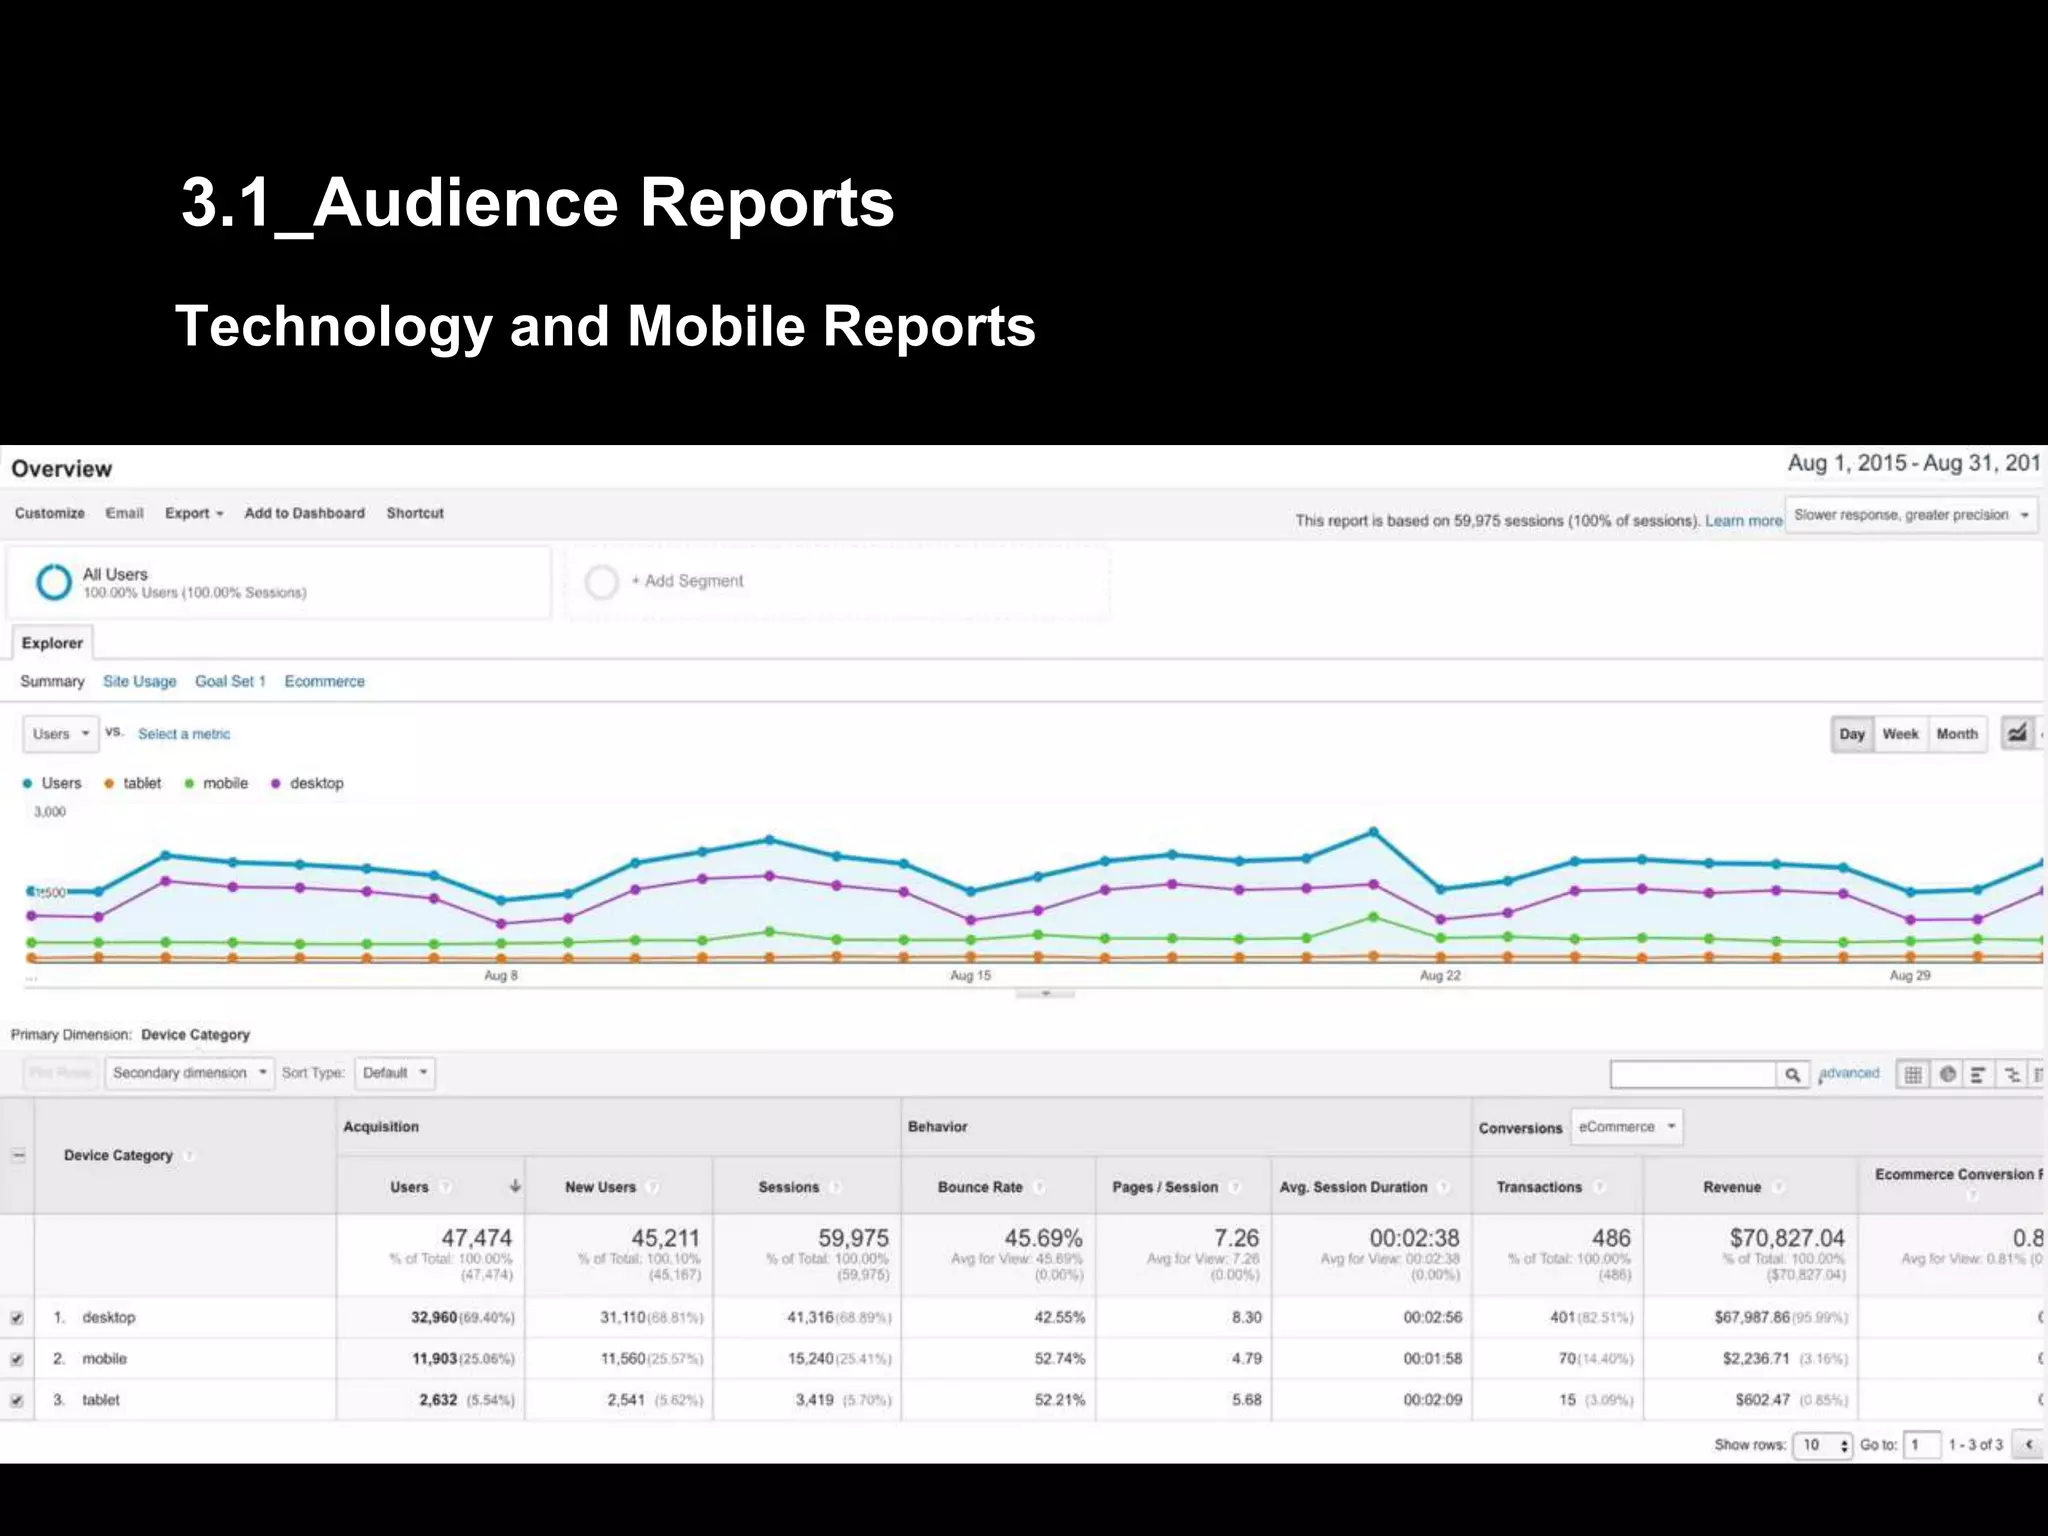
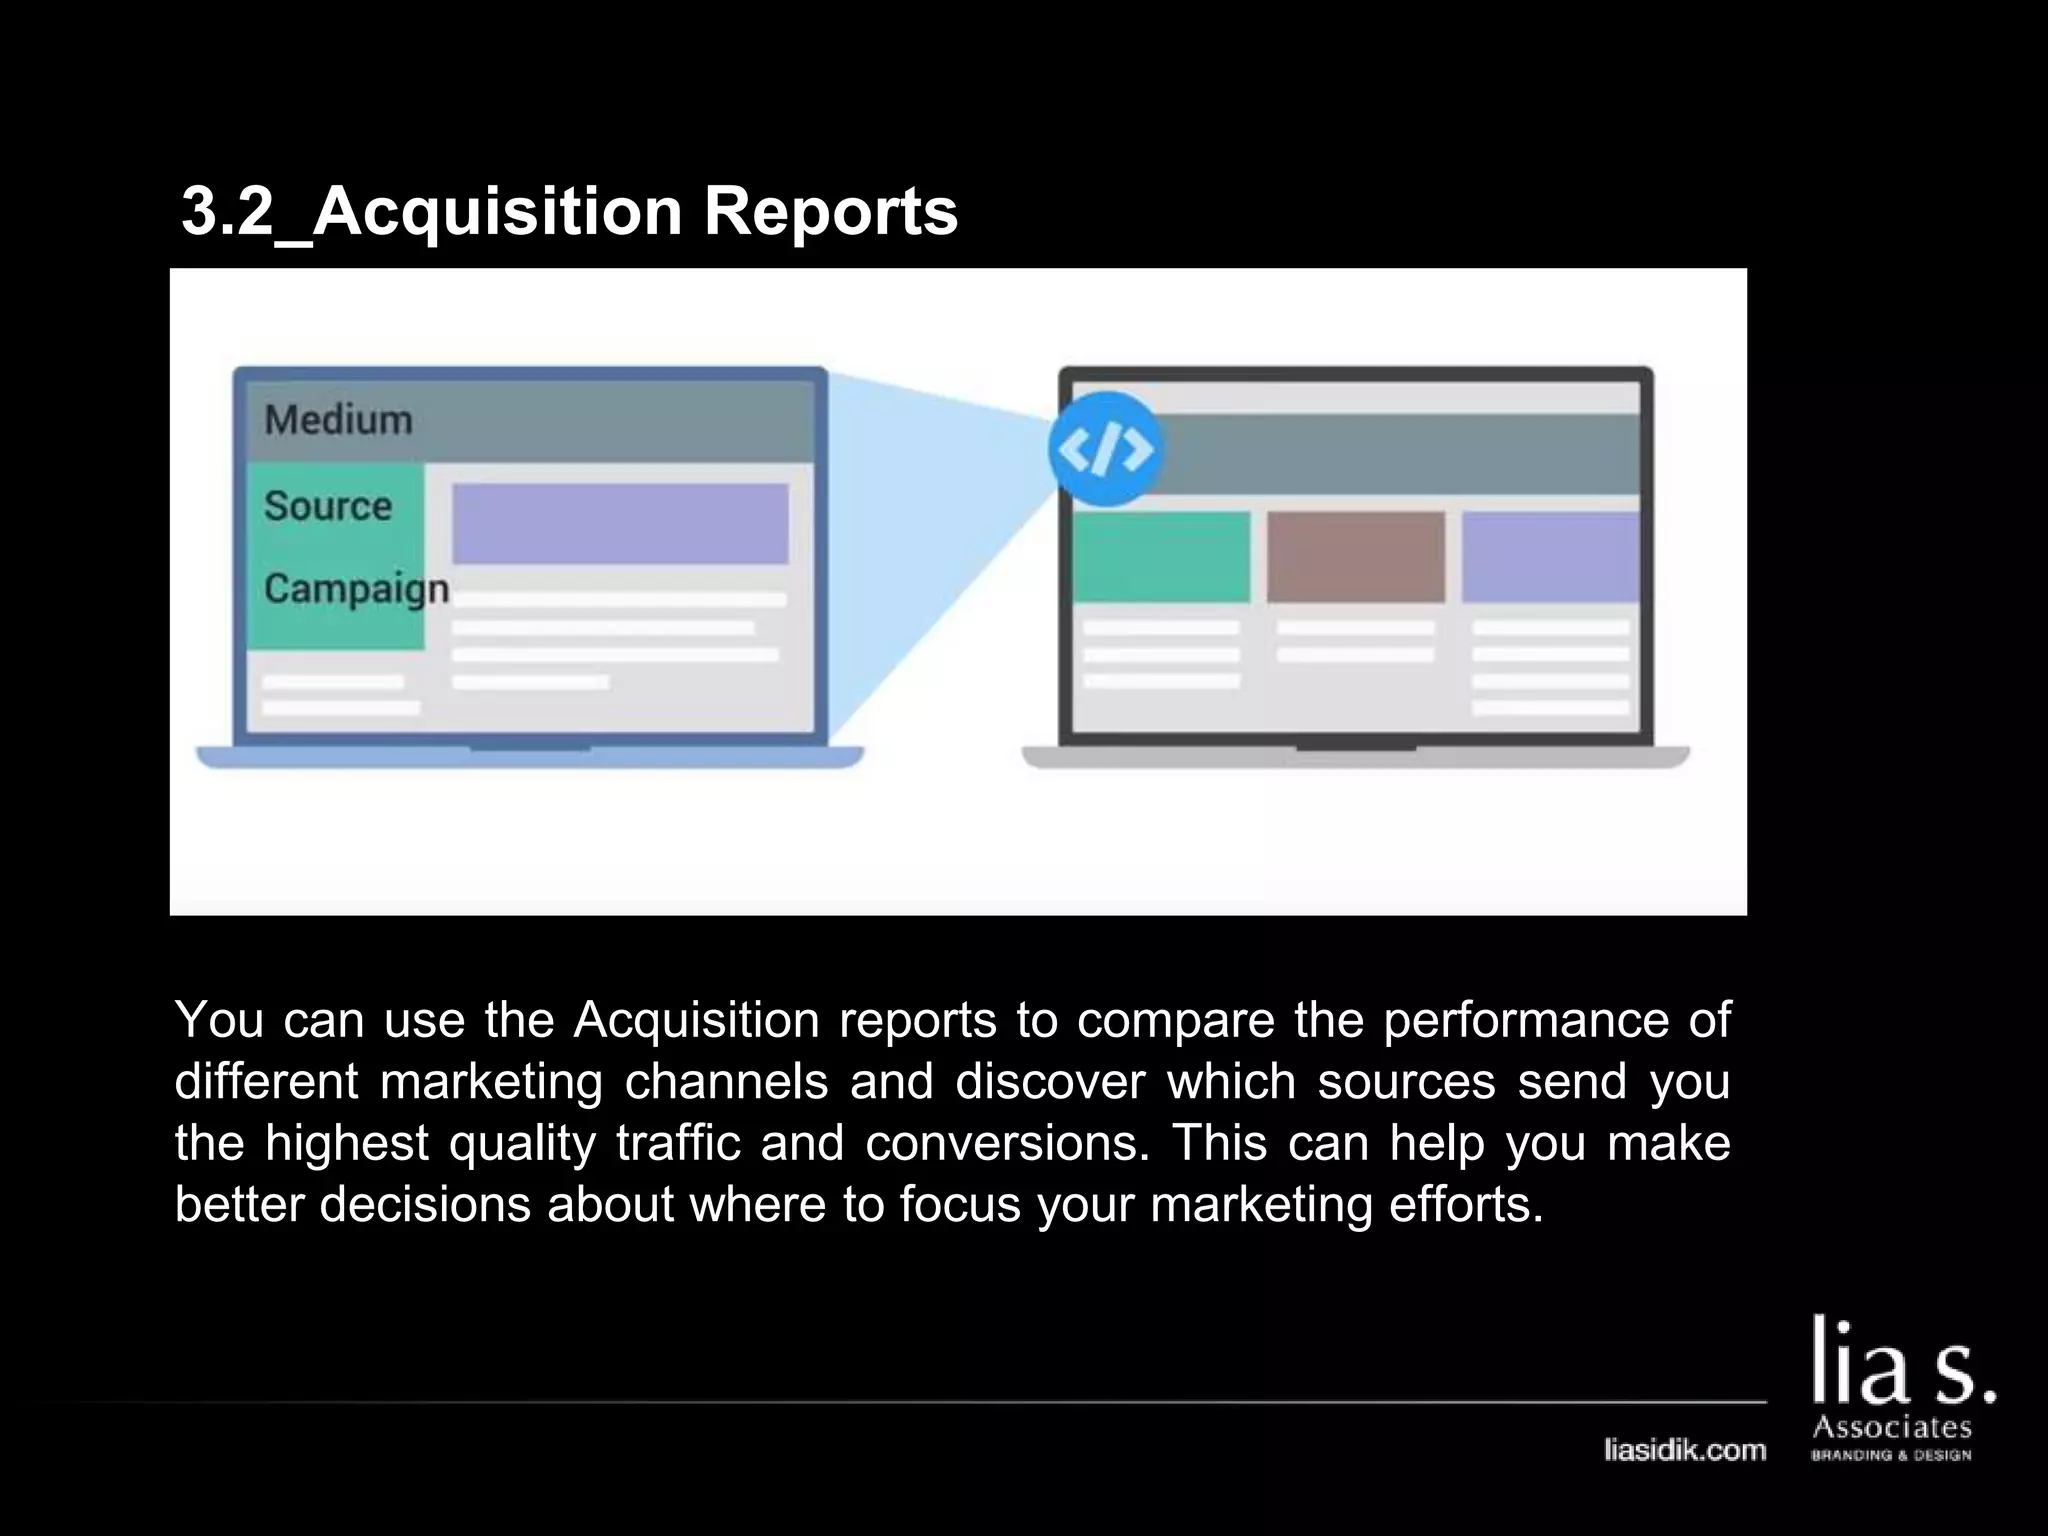
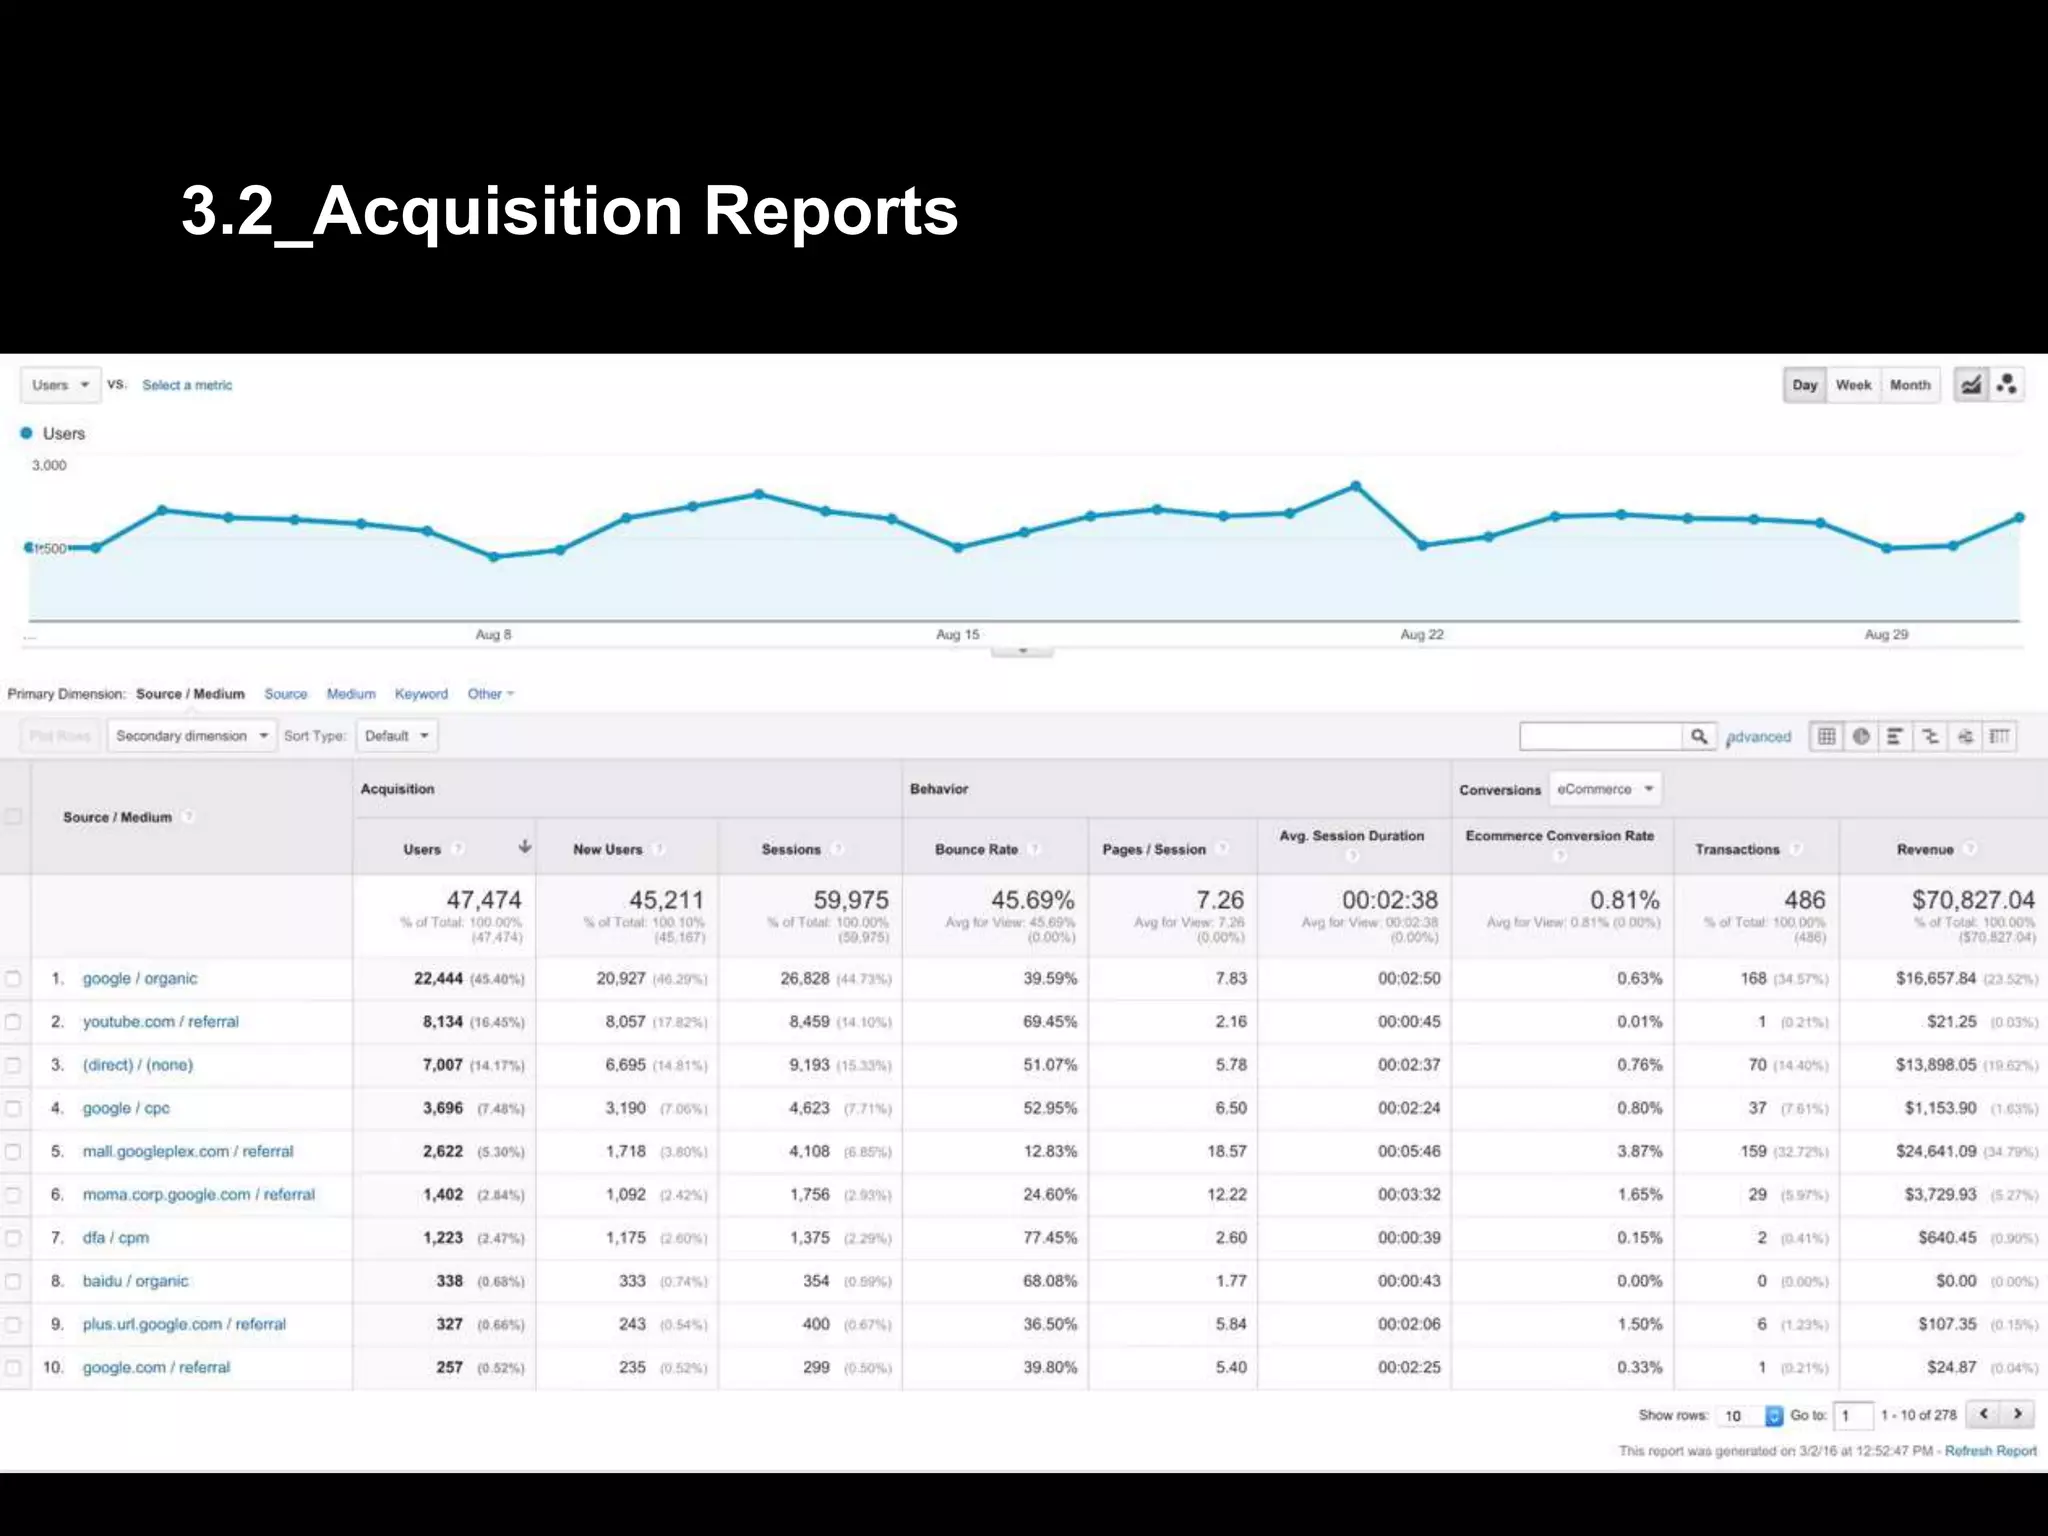
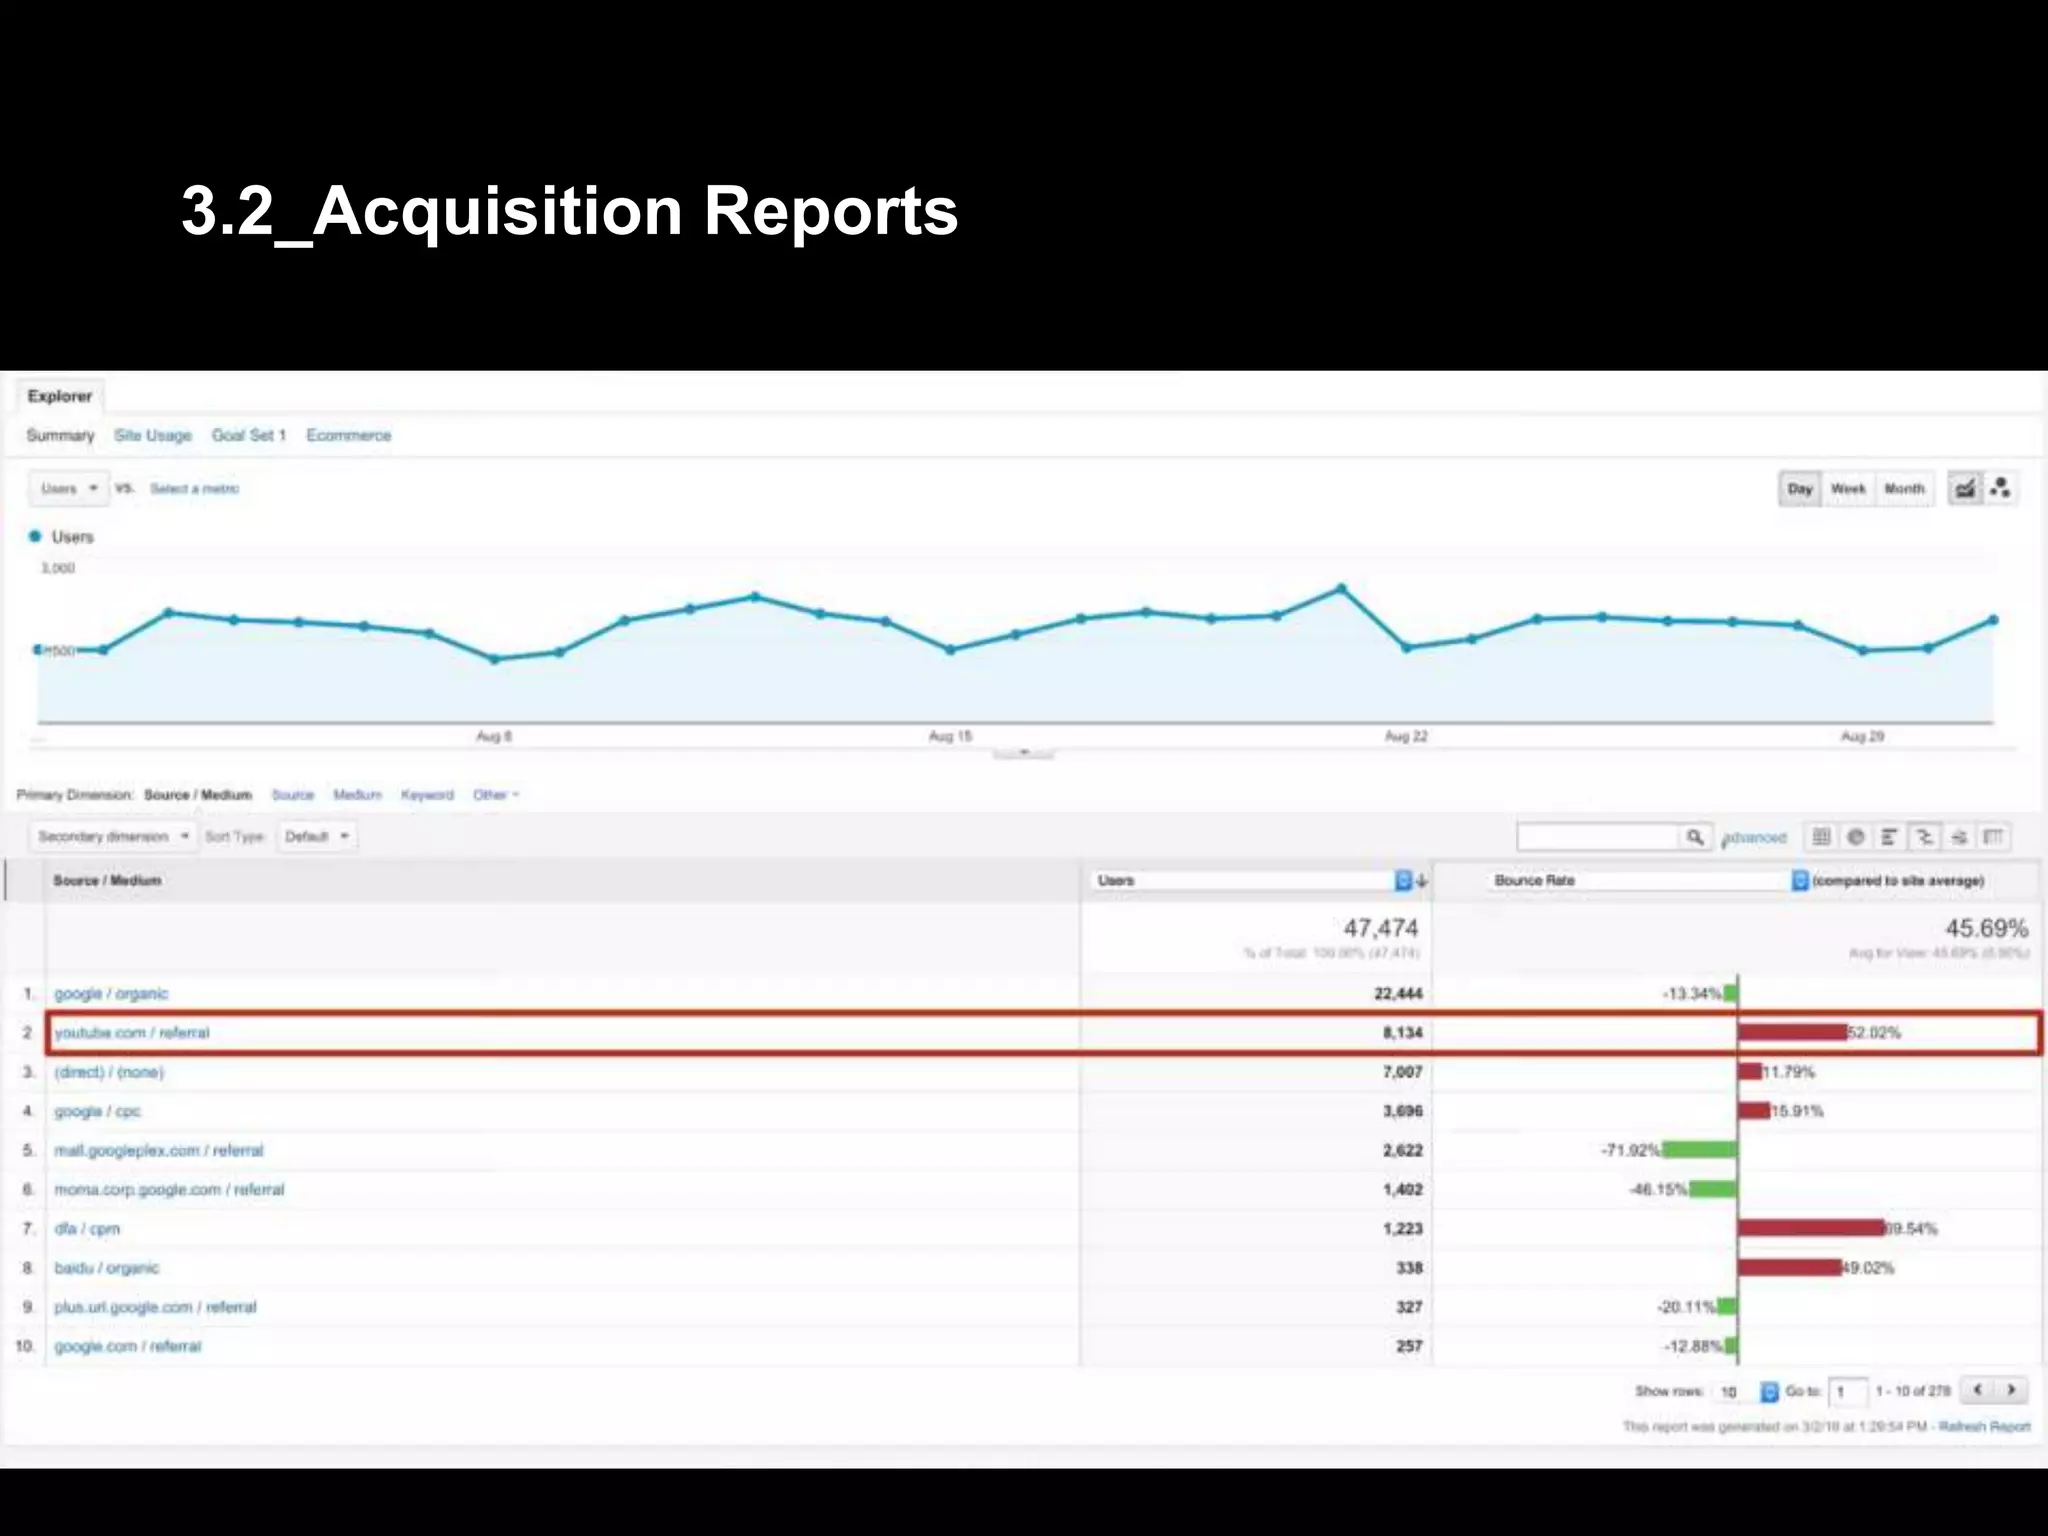
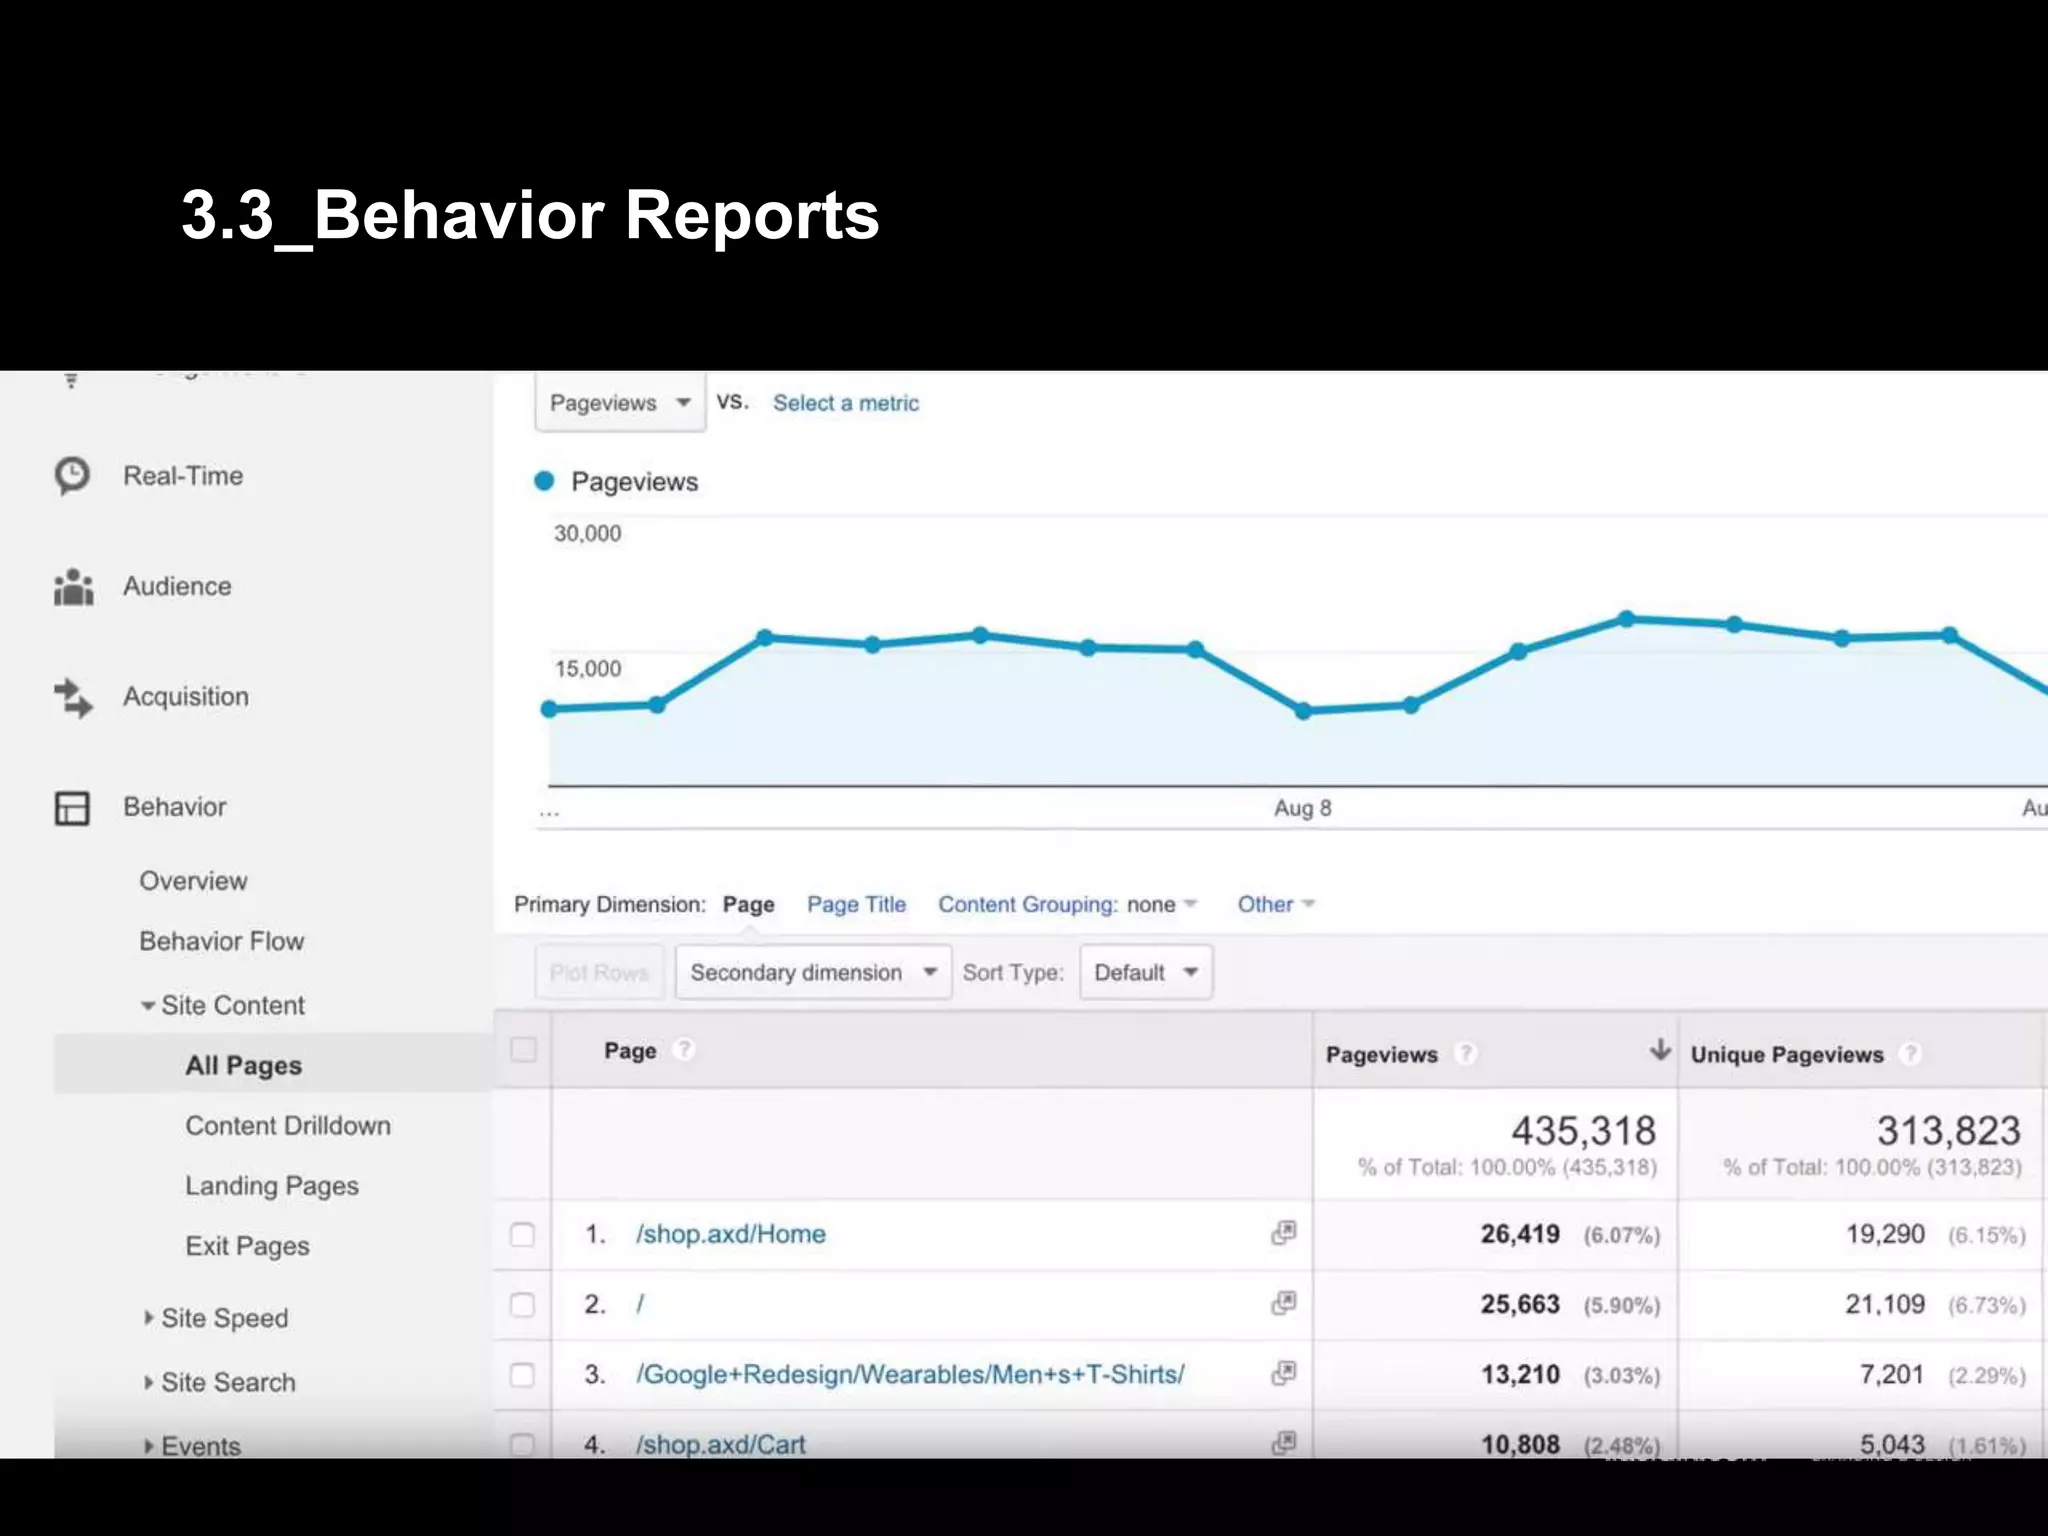
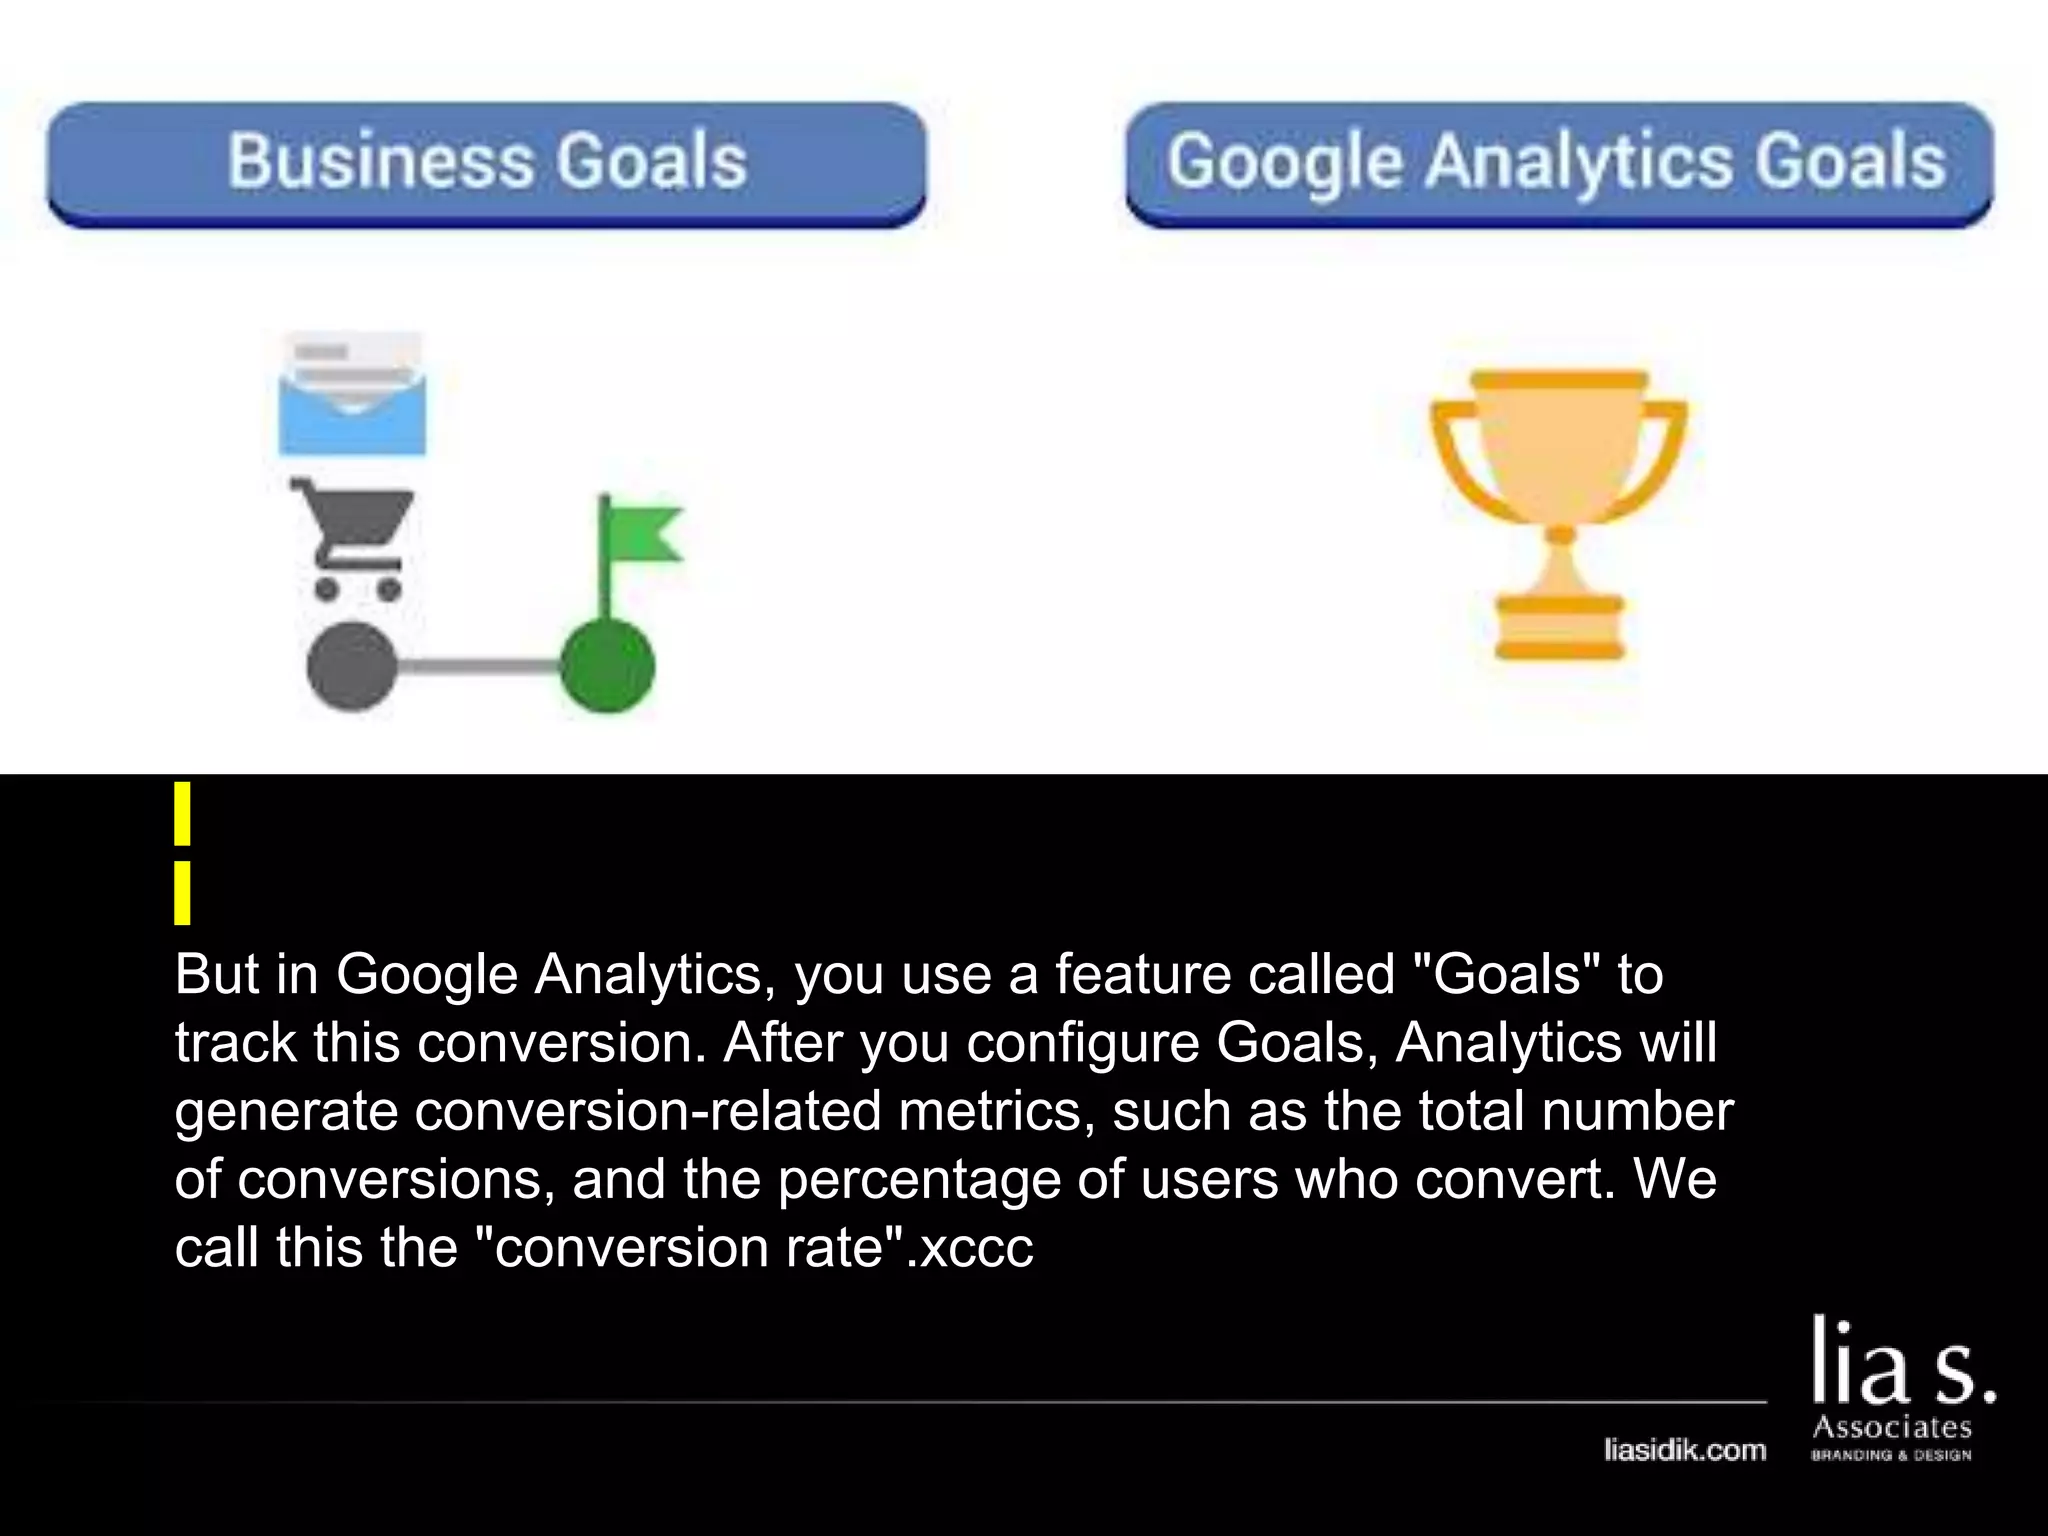
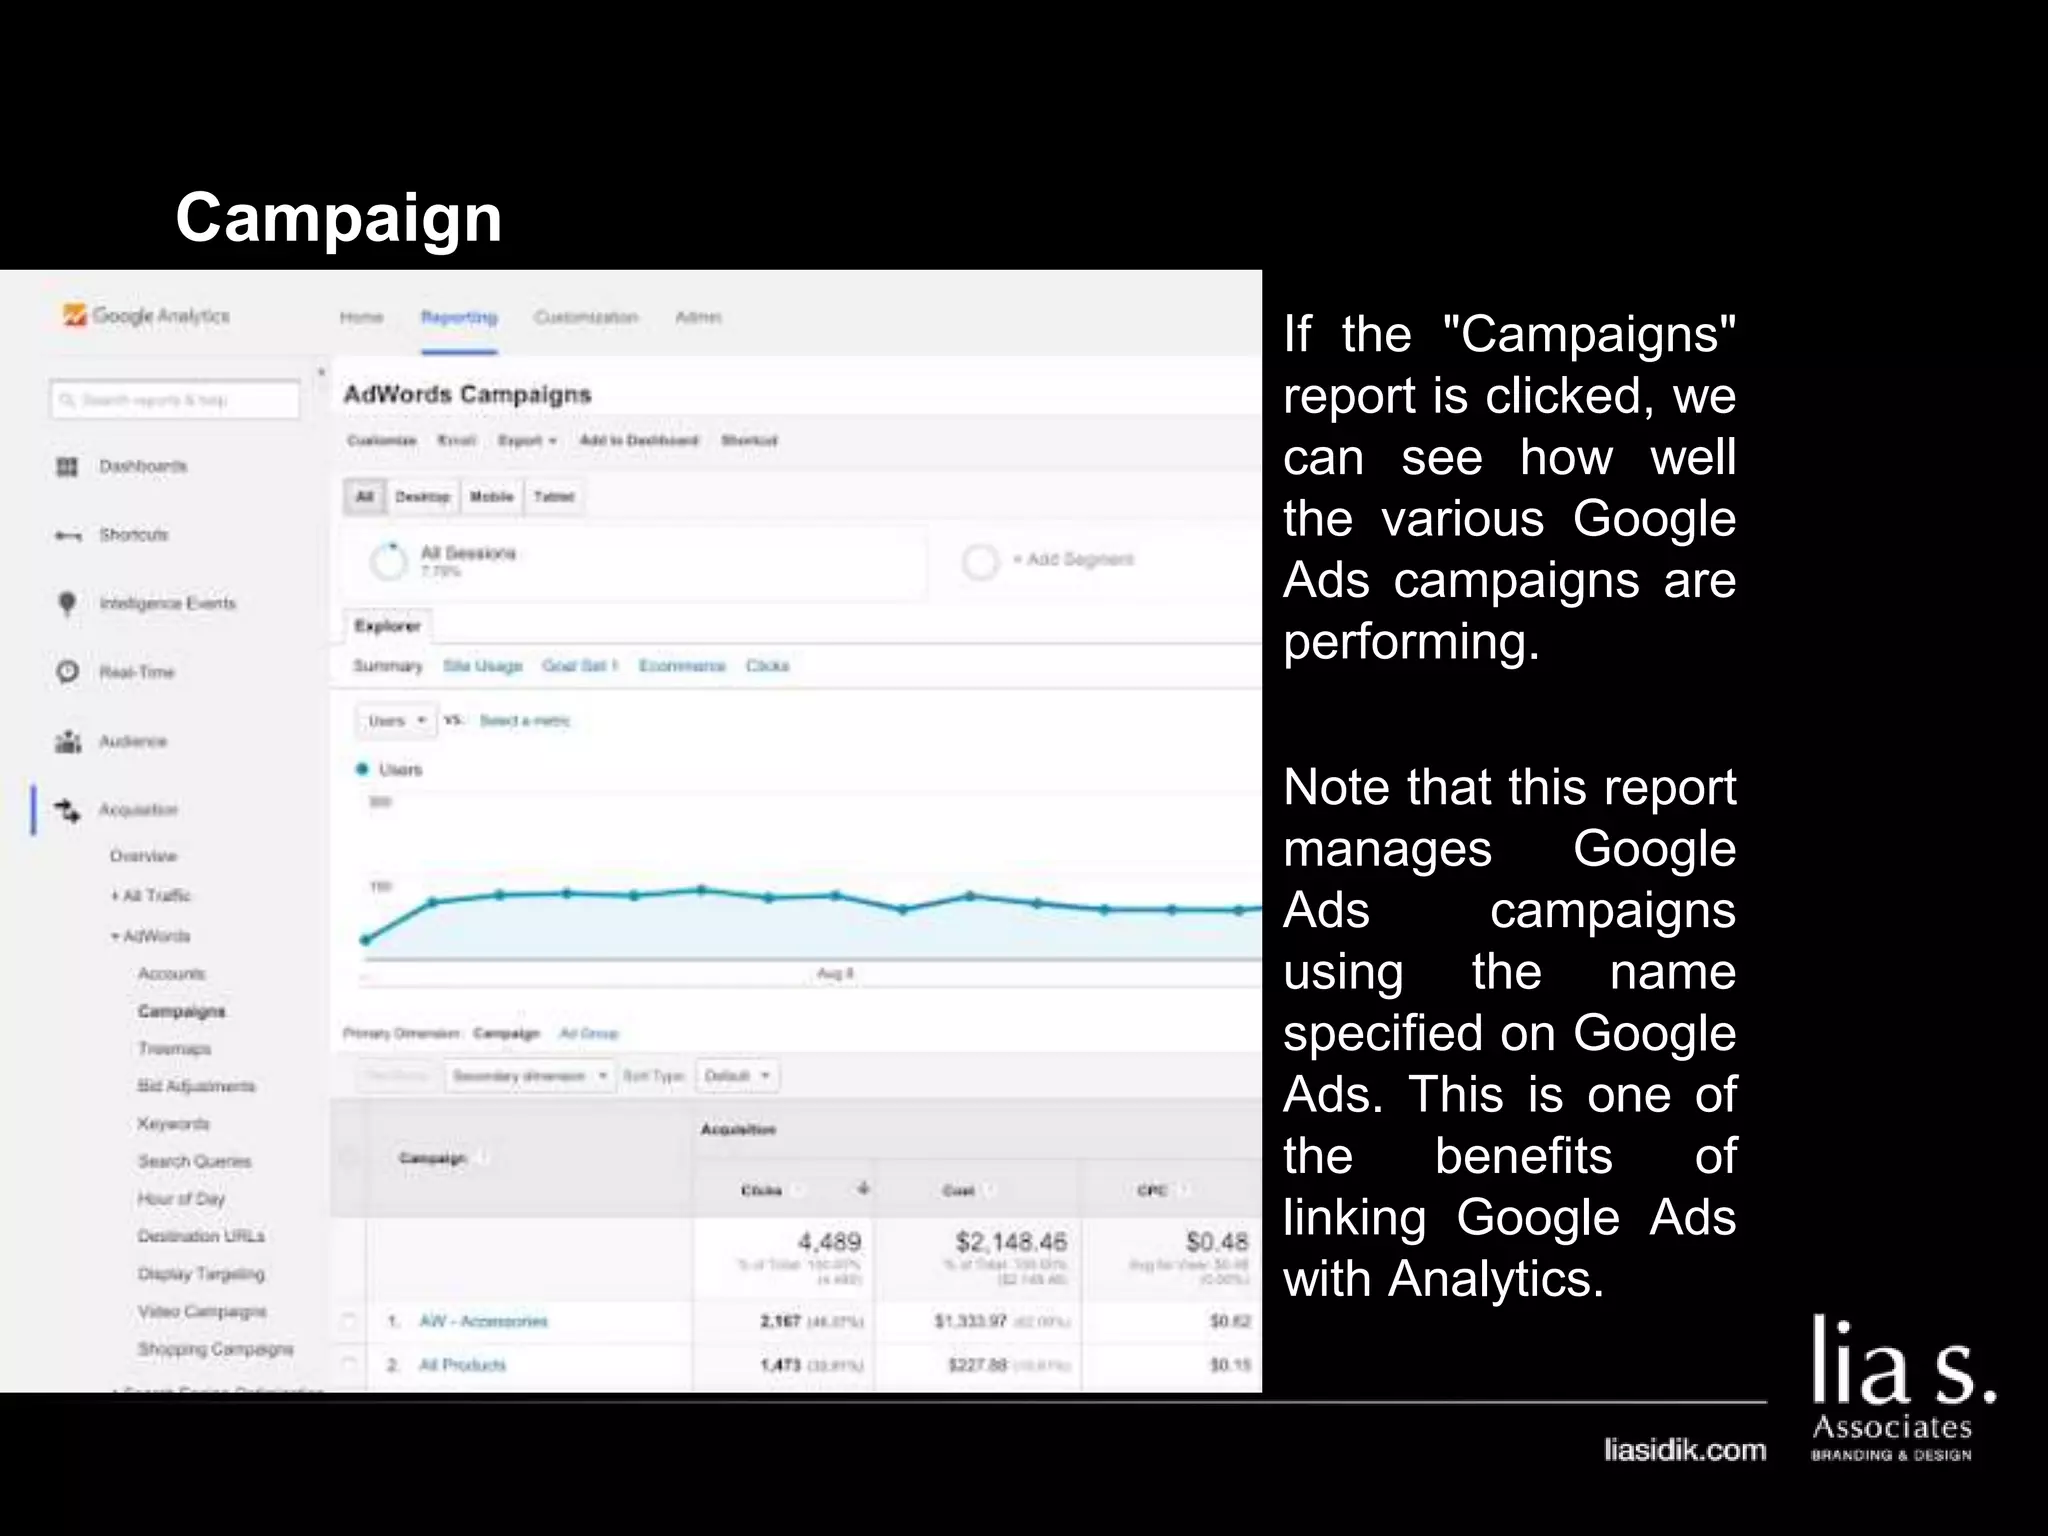
1. The document provides an overview of setting up and using Google Analytics. It discusses setting up views, filters, and accounts. It also covers how to track campaigns, set up goals, and link Google Analytics to Google Ads.
2. Basic reports in Google Analytics like audience, acquisition, and behavior reports are explained. The acquisition reports can show which marketing channels bring in users and the behavior reports show how users engage on the site.
3. Goals in Google Analytics are used to track conversions. Configuring goals allows analytics to generate conversion metrics like the number of conversions and conversion rate.
This document provides an introduction and overview of Google Analytics. It begins with introductions from the presenter and explains why learning Google Analytics is important. The rest of the document dives into key topics such as how Google Analytics works, how to install it, the different types of web data and traffic sources it can track, and how to navigate and customize the various reports and features within Google Analytics. Resources for further learning about Google Analytics and obtaining certification are also provided.
Google Analytics plays an important role in making important business decisions. 'Introduction to Google Analytics' sheds light on basics of Analytics and it's setup.
Download "A brief introduction to the technical implementation of Google Analytics". Thanks for your interest in this presentation. I tried to enable the download for the presentation several times, but it just doesn't seem to work.
As an alternative, you can now download the Google Analytics presentation at http://www.queromediashare.com/presentation/Google%20Analytics.ppt
Have fun with it!
This presentation covers methods to set up Google Analytics on your website. It also includes basic terminologies / jargons / concepts that are used throughout Google Analytics
This document provides an introduction to Google Analytics (GA) and Google Tag Manager (GTM). It outlines the course agenda which includes an overview of GA terms, concepts, and setup. It also covers dashboard and reporting, campaign tracking, and a case study. The document concludes with an introduction to GTM concepts like containers, tags, variables, and triggers for codeless website tracking.
Hosted by MCN Data & Insights SIG co-chair, Elena Villaespesa, this hangout is an introduction to Google Analytics. Brian Alpert, Web Analyst at the Smithsonian will join Elena and show you how to get a handle on this important analytical tool.
Topics covered:
Introduction to digital analytics
Navigating Google Analytics reports
Setting goals and targets
Google Analytics features
Segmentation
Custom reports
Event tracking
Views and filters
Dashboards
Resources & tools
Q&A
Video
https://www.youtube.com/watch?v=kQDCWS4bye4
I delivered this presentation to MSc Digital Marketing class of "The UCD Michael Smurfit Graduate Business School - University College Dublin" in February 2015.
The presentation covers some basics and fundamental information about Google Analytics.
This document provides definitions for over 100 key terms related to Google Analytics. It covers fundamental concepts like accounts, properties, views, sessions, users, pages, events, goals, acquisition reports, attribution modeling, custom dimensions and metrics, and Google Ads integration. It's a comprehensive glossary that defines the most important Google Analytics terminology for users to understand how to setup, analyze, and optimize their Google Analytics implementation.
Google Analytics is a free web analytics service that provides statistics and analytical tools. It tracks data on user behavior, including sessions, users, pageviews, bounce rate, goals, and conversions. The document defines key Google Analytics terms and provides an overview of the Google Analytics interface and reporting features. It explains how to set up custom reports, dashboards, and segments. It also describes how to set up goals to track user conversions and customize campaigns to attribute traffic sources.
This is EXTREMELY DATED. I performed this prior to 2010 and much of the data is no longer valid. Please contact me to receive a FREE Google Analytics Audit.
NOTE: Concentrates on data collection and value definition ... not feature sets. This PPT combines analysis provided from Google Analytics and WebTrends Analytics for the same data.
Google Analytics is a free analytics service offered by Google that provides statistics about visitors and transactions on a website. It tracks usage, entry points, searches, and more via a web-based interface. To use it, one must install a tracking code on their website which collects data and sends it to Google servers for processing and analysis. This allows users to view reports on website traffic, conversions, e-commerce transactions, and more through Google Analytics' dashboard and detailed reports.
Training material for Google Analytics Class One. Google Analytics for beginners by Noel Gomes Twitter @SocialNoel. Course material for Digital Marketing Course.
Learn more about Google Analytics, how to create a google analytics account, how to read google analytics metrics, how to navigate the google analytics console. Reference is the Google Analytics Demo Account. Google Analytics is a free analytical tool for measuring the performance of a website, blog, mobile app, or an e-commerce site.
Google Analytics 발표 자료
참고:
구글 애널리틱스: 웹 로그 분석의 시작과 끝 (개정판)
Analytics Academy (https://analyticsacademy.withgoogle.com/)
Google Analytics - Google Developers (https://developers.google.com/analytics/)
Google analytic best website performance checker tool, get complete guide information on website with Google analytics tool for better results and for complete check on information.
A basic overview of Google Analytics. The slide talks about how google analytics can help track key information such as visits, unique visitors, pageviews, traffic sources for your website.
It also talks about important features of google analytics such as goals & a brief about account, property & profile views.
The document provides step-by-step instructions for setting up Google Analytics and Google AdWords accounts. It explains that Google Analytics generates detailed website traffic statistics and measures conversions, while Google AdWords allows creating and managing online advertising campaigns. The summary outlines the key steps for creating accounts, linking websites, tracking users, and configuring analytics and advertising settings.
This document provides an overview of Google Analytics basics for online marketers. It introduces key Google Analytics concepts and terminology like views, dashboards, audiences, acquisition, behavior, and conversions. It also covers how to set up an account, incorporate the tracking code, customize date ranges and reports, and ask questions. The goal is to help users understand basic Google Analytics functionality and metrics.
Google Analytics is a web analytics service offered by Google that tracks and reports website traffic, currently as a platform inside the Google Marketing Platform brand.
Presented at Social Media Breakfast Maine on July 22, 2016. Jenika presented on Google Analytics for newbies. This presentation explains what Google Analytics is, what is looks like, the different elements and data points, why businesses should consider using Google Analytics, and some Google Analytics tips.
We're going to teach you how to tackle the “so much data, so little insight” problem.
At our Google Analytics workshop, we’ll dig in and explore ways to use Google Analytics to gather more meaningful data, analyze it better and make your website perform. From basic definitions to implementation, event tracking to cross-domain tracking, we’ve got you covered.
Our trainer is a consultant here at The Bureau Dubai, working every day in the materials she will be teaching – so you’ll get real-world tips and someone who can answer the difficult questions.
This document provides an overview of how information is introduced in Google Analytics 4, including the different reporting, life cycle, and configuration options. It discusses how data is collected with each user hit and associated with a randomly generated client ID. It also outlines the two types of attribution reports in GA4 - conversion paths and experience. Different cross-channel attribution models are described including last click, first click, linear, and position-based models. Finally, it explains data driven attribution, which analyzes path data to develop conversion rate models and attributes credit using an algorithm.
Beginners discussion to - Google Analytics Lee Trevena
Google Analytics is a software program that collects and reports website data. It measures how many people visit a site, how they find it, and what they do while there. Data is collected through JavaScript code on the site which tracks user behavior and sends this information back to Google Analytics. This raw data is then processed into useful metrics and reports. Businesses can use these metrics and reports to improve site performance, track marketing campaigns, and enhance the user experience. Potential future applications of analytics technology include more personalized content, tracking robot and space activities, and uses in healthcare and bio-technology.
Google Analytics is a service offered by Google that tracks and reports website traffic to help improve sales and marketing strategies. The tutorial provides step-by-step instructions on creating a Gmail account to access Google Analytics, setting up a Google Analytics account for a website or Facebook page, and embedding the tracking code on the relevant site to begin collecting data. Key steps include generating a tracking ID, copying and pasting the tracking code, and saving and publishing the changes to start collecting website traffic data in Google Analytics reports.
Bridging google analytics & tag manager #melbseo meetupDaniel Wild
A brief exploration into how to better your analytics through the use of Google Tag Manager. We cover;
1) User Behaviour - Bounce rate adjustment
2) First Party Cookies & Persistent Data
3) False Positives and Iframe Tracking
The document provides an overview of reporting and analytics capabilities in Sprinklr. It describes navigating between standard dashboards, setting filters and date ranges, and customizing dashboards. Standard dashboards track metrics like campaigns, social engagement, inbound/outbound tags, and service level agreements. Custom dashboards can be created and shared with other users. The document contains step-by-step instructions for using various reporting features in Sprinklr.
This document provides an overview of reporting and analytics capabilities in Sprinklr. It describes navigating between standard dashboards, customizing dashboards with filters and date ranges, and creating custom dashboards and widgets. Standard dashboards track metrics like campaigns, social engagement, inbound/outbound tags, and SLAs. Custom dashboards allow cloning, editing, deleting, and sharing of custom widget configurations and visualizations.
Useful slide on google analytics informative guidelines for entrepreneurs, marketing professionals, Digital marketing students, online marketing experts, digital marketing aspirants. The potential of digital marketing is growing exponentially, so it's very good to study digital marketing. digital marketing course in Trivandrum, digital marketing training in Trivandrum.
https://arevadigital.com/location/digital-marketing-course-in-trivandrum/
This document provides a 7 step guide to getting started with Google Analytics. It begins by explaining how to install the tracking code on a website. It then discusses important metrics and terminology to understand like visits, pageviews, bounce rate, etc. Further steps cover setting up goals, linking Google Analytics to Google Adwords, analyzing content and traffic sources, creating dashboards, and custom reporting. The overall purpose is to help users understand how to properly set up Google Analytics and utilize its key features to measure website traffic and the effectiveness of online marketing efforts.
This document provides an introduction to Google Analytics, including:
- How to sign up for an account and access Analytics reports.
- An overview of the main Analytics interface and how to edit account settings like profiles, goals, filters and users.
- Information on viewing reports and the types of data that can be analyzed.
- An introduction to the next document which will cover using Analytics reports and tools in more depth.
Google analytics account setup optimization DAVID RAUDALES
This document provides a checklist to help users customize and optimize their Google Analytics account. It includes beginner, intermediate, and advanced steps. The beginner steps focus on setting up the account properly, including defining website objectives, creating views, and installing the tracking code. The intermediate steps delve into customizing the account further, such as identifying key performance indicators and creating additional views. The advanced steps are designed for certified users. The goal is to turn Google Analytics into a customized reporting tool that provides actionable insights.
GA is a free web analytics tool from Google that helps users analyze site traffic and optimize marketing campaigns. It tracks metrics like conversions, revenue, and keywords to help users understand visitor behavior and improve site performance. The tracking code is installed on pages to collect anonymous data which is processed by GA. Reports provide insights into metrics like traffic sources, content, goals, and ecommerce to help answer business questions.
This document provides a beginner's guide to Google Analytics. It discusses initial setup steps like ensuring proper access permissions and linking Webmaster Tools. It also covers implementing the tracking code across websites and maintaining data accuracy through profiles and filters. Additional sections explain custom segmentation, conversion goals, automated reporting, ecommerce tracking, and newer features like multi-channel funnels and visitor flow. The guide aims to help digital marketers measure ROI more efficiently using Google Analytics.
Google Analytics is a free web analytics tool that provides insights into user behavior on websites. It tracks multiple metrics including page views, sessions, visitors, site speed, traffic sources and events. It has an intuitive interface and allows users to customize dashboards. Additional features include in-page analytics, navigation summaries, geo-targeting, visitor segmentation, conversion funnels, report exporting and scheduling, social media tracking, and Google AdWords integration. Other prominent analytics tools mentioned are Simply Measured, which provides comprehensive social media reporting, and Rival IQ, a competitive intelligence platform.
Google Analytics is a free web analytics tool offered by Google that tracks and reports website traffic performance. It works by placing JavaScript code on website pages that sends data to Google's servers. This allows users to analyze metrics like traffic sources, visitor information, page popularity, and traffic flow. Google Analytics provides valuable insights into who visits a website, what they view, and how they found the site.
This document provides an overview of web analytics and Google Analytics. It defines web analytics, discusses ways to analyze data both traditionally and through the web analytics paradigm. It also covers setting up goals and funnels in Google Analytics, using segments, alerts and enhanced ecommerce tracking. A key section discusses attribution modeling and how to set up a custom attribution model based on an understanding of your business and customer journey.
The document provides an overview of advanced Google Analytics features including limitations, best practices for setup, customizing goals and event tracking, using advanced segments and custom reports, filtering out IP addresses, and tips for optimization including setting key performance indicators (KPIs). Some of the key points covered include tagging different traffic channels, viewing campaign reporting, tracking various on-site events, segmenting traffic from social media, and modeling metrics to determine the highest drivers of conversions.
The document discusses collecting data on a mobile app over two time periods to analyze the impact of new features on key metrics like new users, sessions, and session duration. Data was collected using Google Analytics on dimensions like user type, sessions, and devices. The hypothesis is that the app would see a sudden influx of new users and increased usage with the addition of a new useful feature. Statistics were analyzed and visualized to evaluate if the hypotheses were true and identify reasons for the outcomes. A non-visualized data set with metrics for app versions over the periods is also presented.
This document summarizes an inventory management system project created to fulfill requirements for a computer science degree. The project includes modules for authentication, adding/updating inventory, and a public interface to view products. It outlines the system's objectives to allow admin to manage inventory and customers to view products online. Database and interface designs are presented along with diagrams of the login, inventory, and relationship flows. Future enhancements could make the system more interactive and statistical.
This document provides an overview of advanced Google Analytics configurations including custom dimensions, custom metrics, event tracking, and other useful configurations. It discusses how to set up and implement each of these tools to track custom data, analyze user behavior, and gain insights specific to your business needs. Examples are given for different types of custom dimensions, metrics, and events that could be tracked.
This document provides an agenda for a Google Analytics training session. The agenda includes topics such as getting started with Google Analytics, navigating the interface, audience, acquisition, behavior, and conversion reports. It also covers account administration, advanced tracking implementations, measuring content, importing and extracting data, and common applications of Google Analytics. The training emphasizes using Google Analytics for analysis rather than just reporting, and how to tell data-driven stories to different audiences. It provides best practices for setting up views and segments, understanding users, tracking campaigns and visitor engagement, and setting up conversion goals.
Learn Effective decision making with Royal Cyber Digital AnalyticsRoyal Cyber Inc.
This webcast will teach How to Retain Visitors & Increase conversions? How to earn more by being Proactive? How to turn Insights into Answers? How to create segments and analyze them? Inquire more: http://bit.ly/1d0Gj2A
Intent Based Analytics with Google Analytics and Google Tag ManagerJatin Kochhar
Intent-Based Analytics with Google Analytics and Google Tag Manager. Map google funnel with the marketing funnel. Learn how to track visitor intent through GA and GTM
Web analytics is the measurement and analysis of internet data to understand and optimize website usage. It involves both on-site analytics, which measure visitor behavior on a website, and off-site analytics, which analyze a website's potential audience and online visibility regardless of ownership. Key performance indicators are metrics used to evaluate success, such as visits, pageviews, and conversion rates. Google Analytics is a commonly used tool that uses first-party cookies and JavaScript code to collect visitor data and provide reports on acquisition, behavior, and conversions.
Similar to 159 200523 Google Analytics For Beginners (20)
This week let’s talk about websites. A website is a collection of interlinked pages on the internet grouped under a unique name or online address.
These pages, known as web pages, contain information or services by a business or organization. The information may be in different formats like text, images, videos, audio, and animation and the services may be like buying or selling products, downloading digital products, etc.
Websites can be used in various fashions: a personal website, a corporate website for a company, a government website, an organization website, etc. Websites can be the work of an individual, a business or other organization, and are typically dedicated to a particular topic or purpose.
----
Learn More from Our Website:
https://liasidik.com
Be sure to follow us:
https://www.instagram.com/liasidik
https://www.facebook.com/liasidik.branding
https://twitter.com/liasidik
Or contact our team via WhatsApp +62 89 659 108 869
If you have any additional questions, please leave a comment.
Thank You!
We already know about digital printing before, but what makes it different with offset printing? Offset printing technology uses plates, usually made from aluminum, which are used to transfer an image onto a rubber "blanket", and then rolling that image onto a sheet of paper. It's called offset because the ink is not transferred directly onto the paper.
In offset printing the matter to be printed is neither raised above the surface of the printing plate nor sunk below it. Instead, it is flush with the surface of the plate; thus offset is classified as a planographic method of printing.
Offset printing helps in producing high-quality output on surfaces like cloth or wood. The rubber leaves a very fine print on rough surfaces, making the process effective. The process is equally efficient for small, medium and large-scale production of printing due to its high quality, inexpensiveness and consistent results.
----
Learn More from Our Website:
https://liasidik.com
Be sure to follow us:
https://www.instagram.com/liasidik
https://www.facebook.com/liasidik.branding
https://twitter.com/liasidik
Or contact our team via WhatsApp +62 89 659 108 869
If you have any additional questions, please leave a comment.
Thank You!
We have discussed Quality Assurance last week, now let’s move on to Digital Printing. Digital printing is a method of printing from a digital-based image directly to a variety of media. It usually refers to professional printing where small-run jobs from desktop publishing and other digital sources are printed using large-format and/or high-volume laser or inkjet printers.
Digital printing machines can print on everything from thick cardstock, heavyweight papers and folding cartons to fabric, plastics and synthetic substrates.
Digital printing continues to grow in popularity and as technology continues to improve, so does the quality of the work. With short turnarounds, lower cost and high-quality output, digital printing is a great solution for many projects you have.
----
Learn More from Our Website:
https://liasidik.com
Be sure to follow us:
https://www.instagram.com/liasidik
https://www.facebook.com/liasidik.branding
https://twitter.com/liasidik
Or contact our team via WhatsApp +62 89 659 108 869
If you have any additional questions, please leave a comment.
Thank You!
This week, let’s discuss about quality assurance. Quality assurance (QA) is a way of preventing mistakes and defects in manufactured products and avoiding problems when delivering products or services to customers.
Quality assurance process helps a business ensure its products meet the quality standards set by the company or its industry. Another way to understand quality assurance (QA) is as a company’s process for improving the quality of its products.
Most businesses utilize some form of quality assurance in production, from manufacturers of consumer packaged goods to software development companies. Some companies may even establish a quality assurance department with employees that focus solely on quality assurance.
----
Learn More from Our Website:
https://liasidik.com
Be sure to follow us:
https://www.instagram.com/liasidik
https://www.facebook.com/liasidik.branding
https://twitter.com/liasidik
Or contact our team via WhatsApp +62 89 659 108 869
If you have any additional questions, please leave a comment.
Thank You!
Once you got a grasp about layouting, now let’s talk about photography. In graphic design, images are often the best way to get ideas across. People respond to images and process them regardless of what language they speak. Photographs are very effective images that can convey stories very quickly. Think how less effective advertisements would be if they used only words.
Photography in design can be more impactful than graphics or illustration as it communicates the message with a sense of realism, and often packs more of a visual punch, too.
Photography can serve many purposes and have many facets. Photography can tell a story, it can capture a moment in time, it can document, and it can be art. There are many technical uses for photography as well as social and creative ones. How we use and interact with photography is highly personal and will differ from one person to the next.
----
Learn More from Our Website:
https://liasidik.com
Be sure to follow us:
https://www.instagram.com/liasidik
https://www.facebook.com/liasidik.branding
https://twitter.com/liasidik
Or contact our team via WhatsApp +62 89 659 108 869
If you have any additional questions, please leave a comment.
Thank You!
Whether in design or writing, layout is the decisive factor which makes the reader want to stay to read your article/design. .
Layout design is the process of arranging visual elements—like text, images, and shapes—on a given page. Layout design is important for any project that conveys a message through eye-catching visuals, like magazine layouts, website design, and advertisements.
An effective layout not only looks attractive, but also helps the viewer understand the message the design is conveying. In other words, understanding layout is key when it comes to creating user-friendly, engaging designs, particularly in the realms of web design and advertising.
----
Learn More from Our Website:
https://liasidik.com
Be sure to follow us:
https://www.instagram.com/liasidik
https://www.facebook.com/liasidik.branding
https://twitter.com/liasidik
Or contact our team via WhatsApp +62 89 659 108 869
If you have any additional questions, please leave a comment.
Thank You!
Although it may be a bit similar, writing for printing media is different from writing for digital media. Written content could only be published as physical print, and was therefore static and unchangeable. Today, content can be published online and is in constant flux. As technology has shifted the way information is delivered, readers’ needs have changed, and writers must think about content in a completely new way.
When writing for the web, using plain language allows users to find what they need, understand what they have found, and then use it to meet their needs. It should also be actionable, findable, and shareable. The point is to understand how what you are writing fits into the overall content strategy, what the content lifecycle entails, and who is involved in the process.
It’s important to target your audience when writing for the web. By knowing who you are writing for, you can write at a level that will be meaningful for them. Use the personas you created while designing the site to help you visualize who you are writing for.
----
Learn More from Our Website:
https://liasidik.com
Be sure to follow us:
https://www.instagram.com/liasidik
https://www.facebook.com/liasidik.branding
https://twitter.com/liasidik
Or contact our team via WhatsApp +62 89 659 108 869
If you have any additional questions, please leave a comment.
Thank You!
Last week we talked about how to write a catalog to promote your product. Now let’s talk about how to write for company magazine and newsletter. Many large organizations will have magazines or newsletter for their employees. Some have them for their customers too.
Newsletters are often short, maybe only one or two pages. Those that are for staff only will usually contain information about upcoming events or announcements, changes in management, new staff, retirements, deaths, competitions, suggestion schemes and that kind of thing. Company magazines are much the same as newsletters in their function, but they are longer, like ‘normal’ magazines.
There are lots of topics you could write about for your company newsletter or magazine. And what you choose depends on who the publication is intended for.
----
Learn More from Our Website:
https://liasidik.com
Be sure to follow us:
https://www.instagram.com/liasidik
https://www.facebook.com/liasidik.branding
https://twitter.com/liasidik
Or contact our team via WhatsApp +62 89 659 108 869
If you have any additional questions, please leave a comment.
Thank You!
Aside from writing for product and retail, you need to know about how to write for catalog. The aim of a catalog is for a range of available goods to be understood as quickly as possible and for it to be appreciated for its design. Thanks to these intrinsic qualities, catalogs are one of the most effective sales tools on the market.
A catalog is a list of all the products or services that an organization makes available to the customers for sale. Well-crafted company profiles & company brochures showcase the corporeal differences. It gives a brief elucidation of products, their features and uses and much more. Preparing a product catalog in the correct style with the latest modifications will aid in creating and spreading brand awareness.
Consequently, writing a product catalog, in a manner which would boost sales, is a pivotal project and the marketing and sales department must necessarily ensure that it follows a significant stride in achieving the target market’s acceptance.
----
Learn More from Our Website:
https://liasidik.com
Be sure to follow us:
https://www.instagram.com/liasidik
https://www.facebook.com/liasidik.branding
https://twitter.com/liasidik
Or contact our team via WhatsApp +62 89 659 108 869
If you have any additional questions, please leave a comment.
Thank You!
Last week we discussed about copywriting for advertising and direct marketing. Let’s step up our discussion further about writing for retail and product.
Retail advertising is the process by which retailers use store advertising (online and offline) to drive awareness and interest towards their products to generate sales from their target audience. Through advertising, a retailer attempts to influence their audience to take a specific action.
Whereas, a product description is the marketing copy that explains what a product is and why it’s worth purchasing. The purpose of a product description is to supply customers with important information about the features and benefits of the product so they’re compelled to buy.
----
Learn More from Our Website:
https://liasidik.com
Be sure to follow us:
https://www.instagram.com/liasidik
https://www.facebook.com/liasidik.branding
https://twitter.com/liasidik
Or contact our team via WhatsApp +62 89 659 108 869
If you have any additional questions, please leave a comment.
Thank You!
From the previous discussion, we talked about the basics of copywriting. Now let’s take a look at copywriting for advertising and direct marketing.
Ad copy is the text of an advertisement and is delivered through several methods, with the end goal of a completed conversion. Figure out the Who, What, When, Where, How and Why of whom you are targeting: what you are offering, where the ad will be seen, when the ad will be displayed, how the message will be delivered, and why the reader would benefit from your offer.
The goal of an advertising script is to give the commercial producer the copy needed to sell a product or service. Good copy gets consumers attention, builds brand recognition and urges the audience to buy the advertised product or service.
----
Learn More from Our Website:
https://liasidik.com
Be sure to follow us:
https://www.instagram.com/liasidik
https://www.facebook.com/liasidik.branding
https://twitter.com/liasidik
Or contact our team via WhatsApp +62 89 659 108 869
If you have any additional questions, please leave a comment.
Thank You!
A good content will make a good impression for online ads to promote brands. It is essential to be able to understand the structure or process of copywriting. Copywriting is the reason why people buy something.
Copywriting is the act or occupation of writing text for the purpose of advertising or other forms of marketing. The product, called copy or sales copy, is written content that aims to increase brand awareness and ultimately persuade a person or group to take a particular action.
Every business needs copywriting if they want to convert traffic into customers. Websites without copy don’t get sign-ups or opt-ins, don’t build brand awareness, and don’t persuade people to give them their money.
----
Learn More from Our Website:
https://liasidik.com
Be sure to follow us:
https://www.instagram.com/liasidik
https://www.facebook.com/liasidik.branding
https://twitter.com/liasidik
Or contact our team via WhatsApp +62 89 659 108 869
If you have any additional questions, please leave a comment.
Thank You!
Working in the creative or design industries, much of your marketing relies on beautiful imagery. Beautiful images are a good start, but cleverly crafted content can make all the difference. Words give your work further clarity, reach and exposure – and, in the digital age, make you easier to find online.
Creative copywriting isn’t just about getting information in. It’s about getting information out – in an interesting way. It’s not just about writing but about thinking. And thinking differently. Why is the product unique? Why should I choose it above and beyond any other similar brand? Who is the target audience?
Creative copywriting is inspiring to read and has a voice that makes a brand stand up and stand out. But it’s about more than having a way with words. It’s about being original with an idea and tapping into people’s hearts and heads. It’s about having a headline that makes people look twice and a copy that makes people want to read end to end.
----
Learn More from Our Website:
https://liasidik.com
Be sure to follow us:
https://www.instagram.com/liasidik
https://www.facebook.com/liasidik.branding
https://twitter.com/liasidik
Or contact our team via WhatsApp +62 89 659 108 869
If you have any additional questions, please leave a comment.
Thank You!
In order to monopoly the market, a brand must be creative in promoting itself. Nowadays there are many creative industries who reveal themselves in the past few years to be a better brand in the market.
The term ‘creative industries’ describes businesses with creativity at their heart – for example design, music, publishing, architecture, film and video, crafts, visual arts, fashion, TV and radio, advertising, literature, computer games and the performing arts.
The creative industries are critical to the sustainable development agenda. They stimulate innovation and diversification, are an important factor in the burgeoning services sector, support entrepreneurship, and contribute to cultural diversity.
----
Learn More from Our Website:
https://liasidik.com
Be sure to follow us:
https://www.instagram.com/liasidik
https://www.facebook.com/liasidik.branding
https://twitter.com/liasidik
Or contact our team via WhatsApp +62 89 659 108 869
If you have any additional questions, please leave a comment.
Thank You!
This document discusses segmentation, targeting, and positioning (STP) strategies in marketing. It defines segmentation as dividing a market into distinct groups based on variables like demographics, behaviors, and psychographics. Targeting is selecting specific segments to market to. Positioning is how a product is placed in consumers' minds relative to competitors. The document provides many examples of how to segment consumers and gives tips for effective positioning, such as being first, simplifying messages, differentiation, and repositioning over time as markets change.
What is SWOT analysis? SWOT analysis is a strategic planning and strategic management technique used to help a person or organization identify Strengths, Weaknesses, Opportunities, and Threats related to business competition or project planning.
You can employ SWOT analysis before you commit to any sort of action, whether you are exploring new initiatives, revamping internal policies, considering opportunities to pivot or altering a plan midway through its execution.
The analysis can show you the key areas where your organization is performing optimally, as well as which operations need adjustment.
----
Learn More from Our Website:
https://liasidik.com
Be sure to follow us:
https://www.instagram.com/liasidik
https://www.facebook.com/liasidik.branding
https://twitter.com/liasidik
Or contact our team via WhatsApp +62 89 659 108 869
If you have any additional questions, please leave a comment.
Thank You!
A few weeks ago we already discussed 3 theaters of CSR. Now let’s take a look at the examples of CSR Events which build a brand.
Doing a CSR is not simply just by understanding the theaters, you must understand the purpose of your brand, brand values, and your brand trademarks. The foundation must be applied first in order to make it work properly.
A company which emphasizes on its policy of social responsibility can amplify its good image and can create a competitive edge over others leading to 'Branding'.
----
Learn More from Our Website:
https://liasidik.com
Be sure to follow us:
https://www.instagram.com/liasidik
https://www.facebook.com/liasidik.branding
https://twitter.com/liasidik
Or contact our team via WhatsApp +62 89 659 108 869
If you have any additional questions, please leave a comment.
Thank You!
You already know about product branding, now let’s discuss a whole new level about branding another object: City Branding. City Branding is the use of marketing techniques to give a city a unique identity in the minds of citizens, visitors, companies and investors.
As cities compete globally to attract tourism, investment and talent, as well as to achieve many other objectives, the concepts of brand strategy are increasingly adopted from the commercial world and applied in pursuit of urban development, regeneration and quality of life.
----
Learn More from Our Website:
https://liasidik.com
Be sure to follow us:
https://www.instagram.com/liasidik
https://www.facebook.com/liasidik.branding
https://twitter.com/liasidik
Or contact our team via WhatsApp +62 89 659 108 869
If you have any additional questions, please leave a comment.
Thank You!
Nowadays, magazines are paving their way to go online, which lessens the production costs and can be accessed by anyone around the world. Still, there are some companies who prefer to produce them with high quality paper and distribute them door to door.
A traditional magazine can typically focus on trends or issues, and it can provide background information for news events. Magazines have the luxury of focusing on a smaller target audience, which means they do not have to try to please all of the people all the time.
Then, how can a magazine attract its reader? Structurized paragraph and writing, an eye-catching design, and good typography are the points which will create a good magazine.
----
Learn More from Our Website:
https://liasidik.com
Be sure to follow us:
https://www.instagram.com/liasidik
https://www.facebook.com/liasidik.branding
https://twitter.com/liasidik
Or contact our team via WhatsApp +62 89 659 108 869
If you have any additional questions, please leave a comment.
Thank You!
You already know how to promote your brand by making an advertisement. But, will your advertisement produce a profitable income?
Advertising is not just to sell your brand and build your brand name, it must give you a benefit. Starting by pricing your product not too high or not too low, then promoting your product to build awareness in customer’s mindset, and finally using brand ambassadors to influence consumers' emotional feelings.
It seems to be impossible at first, but with each step, you will gain more profit and your brand will eventually become the best in the market.
----
Learn More from Our Website:
https://liasidik.com
Be sure to follow us:
https://www.instagram.com/liasidik
https://www.facebook.com/liasidik.branding
https://twitter.com/liasidik
Or contact our team via WhatsApp +62 89 659 108 869
If you have any additional questions, please leave a comment.
Thank You!
More from Lia s. Associates | Branding & Design (20)
In the face of the news of Google beginning to remove cookies from Chrome (30m users at the time of writing), there’s no longer time for marketers to throw their hands up and say “I didn’t know” or “They won’t go through with it”. Reality check - it has already begun - the time to take action is now. The good news is that there are solutions available and ready for adoption… but for many the race to catch up to the modern internet risks being a messy, confusing scramble to get back to "normal"
The digital marketing industry is changing faster than ever and those who don’t adapt with the times are losing market share. Where should marketers be focusing their efforts? What strategies are the experts seeing get the best results? Get up-to-speed with the latest industry insights, trends and predictions for the future in this panel discussion with some leading digital marketing experts.
Did you know that while 50% of content on the internet is in English, English only makes up 26% of the world’s spoken language? And yet 87% of customers won’t buy from an English only website.
Uncover the immense potential of communicating with customers in their own language and learn how translation holds the key to unlocking global growth. Join Smartling CEO, Bryan Murphy, as he reveals how translation software can streamline the translation process and seamlessly integrate into your martech stack for optimal efficiency. And that's not all – he’ll also share some inspiring success stories and practical tips that will turbocharge your multilingual marketing efforts!
Key takeaways:
1. The growth potential of reaching customers in their native language
2. Tips to streamline translation with software and integrations to your tech stack
3. Success stories from companies that have increased lead generation, doubled revenue, and more with translation
In this humorous and data-heavy Master Class, join us in a joyous celebration of life honoring the long list of SEO tactics and concepts we lost this year. Remember fondly the beautiful time you shared with defunct ideas like link building, keyword cannibalization, search volume as a value indicator, and even our most cherished of friends: the funnel. Make peace with their loss as you embrace a new paradigm for organic content: Pillar-Based Marketing. Along the way, discover that the results that old SEO and all its trappings brought you weren’t really very good at all, actually.
In this respectful and life-affirming service—erm, session—join Ryan Brock (Chief Solution Officer at DemandJump and author of Pillar-Based Marketing: A Data-Driven Methodology for SEO and Content that Actually Works) and leave with:
• Clear and compelling evidence that most legacy SEO metrics and tactics have slim to no impact on SEO outcomes
• A major mindset shift that eliminates most of the metrics and tactics associated with SEO in favor of a single metric that defines and drives organic ranking success
• Practical, step-by-step methodology for choosing SEO pillar topics and publishing content quickly that ranks fast
Lily Ray - Optimize the Forest, Not the Trees: Move Beyond SEO Checklist - Mo...Amsive
Lily Ray, Vice President of SEO Strategy & Research at Amsive, explores optimizing strategies for sustainable growth and explores the impact of AI on the SEO landscape.
Top Strategies for Building High-Quality Backlinks in 2024 PPT.pdf1Solutions Pvt. Ltd.
As we move into 2024, the methods for building high-quality backlinks continue to evolve, demanding more sophisticated and strategic approaches. This presentation aims to explore the latest trends and proven strategies for acquiring high-quality backlinks that can elevate your SEO efforts.
Visit:- https://www.1solutions.biz/link-building-packages/
Are you struggling to differentiate yourself in a saturated market? Do you find it challenging to attract and retain buyers? Learn how to effectively communicate your expertise using a Free Book Funnel designed to address these challenges and attract premium clients. This session will explore how a well-crafted book can be your most effective marketing tool, enhancing your credibility while significantly increasing your leads and sales while decreasing overall lead cost. Unpacking practical steps to create a magnetic book funnel that not only draws in your ideal customers, but also keeps them engaged. Break through the noise in the marketing world and leave with a blueprint that will transform your sales strategy.
janani Digital Marketer|Digital Marketing consultant|Marketing Promotion|Coim...janudm24
Myself Janani Digital marketing consultant located in coimbatore I offer all kinds of digital marketing services for your business requirements such as SEO SMO SMM SMO CAMPAIGNS content writing web design for all your business needs with affordable cost
Digital Marketing Services | Techvolt Software :
Digital Marketing is a latest method of Marketing techniques widely used across the Globe. Digital Marketing is an online marketing technique and methods used for all products and services through Search Engine and Social media advertisements. Previously the marketing techniques were used without using the internet via direct and indirect marketing strategies such as advertising through Telemarketing,Newspapers,Televisions,Posters etc.
List of Services offered in Digital Marketing |Techvolt Software :
Techvolt Software offers best Digital Marketing services for promoting your products and services through online platform on the below methods of Digital marketing
1. Search Engine Optimization (SEO)
2. Search Engine Marketing (SEM)
3. Social Media Optimization (SMO)
4. Social Media Marketing (SMM)
5. Campaigns
Importance | Need of Digital Marketing (Online Promotions) :
1. Quick Promotions through Online
2. Generation of More leads and Business Enquiries via Search Engine and Social Media Platform
3. Latest Technology development vs Business promotions
4. Creation of Social Branding
5. Promotion with less investment
Benefits Digital Marketing Services at Techvolt software :
1. Services offered with Affordable cost
2. Free Content writing
3. Free Dynamic Website design*
4. Best combo offers on website Hosting,design along with digital marketing services
5. Assured Lead Generation through Search Engine and Social Media
6. Online Maintenance Support
Free Website + Digital Marketing Services
Techvolt Software offers Free website design for all customer and clients who is availing the digital marketing services for a minimum period of 6 months.
With Regards
Janani Digital Marketer
Coimbatore,Tamilnadu.
Conferences like DigiMarCon provide ample opportunities to improve our own marketing programs by learning from others. But just because everyone is jumping on board with the latest idea/tool/metric doesn’t mean it works – or does it? This session will examine the value of today’s hottest digital marketing topics – including AI, paid ads, and social metrics – and the truth about what these shiny objects might be distracting you from.
Key Takeaways:
- How NOT to shoot your digital program in the foot by using flashy but ineffective resources
- The best ways to think about AI in connection with digital marketing
- How to cut through self-serving marketing advice and engage in channels that truly grow your business
Efficient Website Management for Digital Marketing ProsLauren Polinsky
Learn how to optimize website projects, leverage SEO tactics effectively, and implement product-led marketing approaches for enhanced digital presence and ROI.
This session is your key to unlocking the secrets of successful digital marketing campaigns and maximizing your business's online potential.
Actionable tactics you can apply after this session:
- Streamlined Website Management: Discover techniques to streamline website development, manage day-to-day operations efficiently, and ensure smooth project execution.
- Effective SEO Practices: Gain valuable insights into optimizing your website for search engines, improving visibility, and driving organic traffic to your digital assets.
- Leverage Product-Led Marketing: Explore strategies for incorporating product-led marketing principles into your digital marketing efforts, enhancing user engagement and driving conversions.
Don't miss out on this opportunity to elevate your digital marketing game and achieve tangible results!
Capstone Project: Luxury Handloom Saree Brand
As part of my college project, I applied my learning in brand strategy to create a comprehensive project for a luxury handloom saree brand. Key aspects of this project included:
- *Competitor Analysis:* Conducted in-depth competitor analysis to identify market position and differentiation opportunities.
- *Target Audience:* Defined and segmented the target audience to tailor brand messages effectively.
- *Brand Strategy:* Developed a detailed brand strategy to enhance market presence and appeal.
- *Brand Perception:* Analyzed and shaped the brand perception to align with luxury and heritage values.
- *Brand Ladder:* Created a brand ladder to outline the brand's core values, benefits, and attributes.
- *Brand Architecture:* Established a cohesive brand architecture to ensure consistency across all brand touchpoints.
This project helped me gain practical experience in brand strategy, from research and analysis to strategic planning and implementation.
Trust Element Assessment: How Your Online Presence Affects Outbound Lead Gene...Martal Group
Learn how your business's online presence affects outbound lead generation and what you can do to improve it with a complimentary 13-Point Trust Element Assessment.
Build marketing products across the customer journey to grow your business and build a relationship with your customer. For example you can build graders, calculators, quizzes, recommendations, chatbots or AR apps. Things like Hubspot's free marketing grader, Moz's site analyzer, VenturePact's mobile app cost calculator, new york times's dialect quiz, Ikea's AR app, L'Oreal's AR app and Nike's fitness apps. All of these examples are free tools that help drive engagement with your brand, build an audience and generate leads for your core business by adding value to a customer during a micro-moment.
Key Takeaways:
Learn how to use specific GPTs to help you Learn how to build your own marketing tools
Generate marketing ideas for your business How to think through and use AI in marketing
How AI changes the marketing game
This session will aim to comprehensively review the current state of artificial intelligence techniques for emotional recognition and their potential applications in optimizing digital advertising strategies. Key studies developing AI models for multimodal emotion recognition from videos, images, and neurophysiological signals were analyzed to build content for this session. The session delves deeper into the current challenges, opportunities to help realize the full benefits of emotion AI for personalized digital marketing.
In this dynamic session titled "Future-Proof Like Beyoncé: Syncing Email and Social Media for Iconic Brand Longevity," Carlos Gil, U.S. Brand Evangelist for GetResponse, unveils how to safeguard and elevate your digital marketing strategy. Explore how integrating email marketing with social media can not only increase your brand's reach but also secure its future in the ever-changing digital landscape. Carlos will share invaluable insights on developing a robust email list, leveraging data integration for targeted campaigns, and implementing AI tools to enhance cross-platform engagement. Attendees will learn how to maintain a consistent brand voice across all channels and adapt to platform changes proactively. This session is essential for marketers aiming to diversify their online presence and minimize dependence on any single platform. Join Carlos to discover how to turn social media followers into loyal email subscribers and ultimately, drive sustainable growth and revenue for your brand. By harnessing the best practices and innovative strategies discussed, you will be equipped to navigate the challenges of the digital age, ensuring your brand remains relevant and resonant with your audience, no matter the platform. Don’t miss this opportunity to transform your approach and achieve iconic brand longevity akin to Beyoncé's enduring influence in the entertainment industry.
Key Takeaways:
Integration of Email and Social Media: Understanding how to seamlessly integrate email marketing with social media efforts to expand reach and reinforce brand presence. Building a Robust Email List: Strategies for developing a strong email list that provides a direct line of communication to your audience, independent of social media algorithms. Data Integration for Targeted Campaigns: Leveraging combined data from email and social media to create personalized, targeted marketing campaigns that resonate with the audience. Utilization of AI Tools: Implementing AI and automation tools to enhance efficiency and effectiveness across marketing channels. Consistent Brand Voice Across Platforms: Maintaining a unified brand voice and message across all digital platforms to strengthen brand identity and user trust. Proactive Adaptation to Platform Changes: Staying ahead of social media platform changes and algorithm updates to keep engagement high and interactions meaningful. Conversion of Social Followers to Email Subscribers: Techniques to encourage social media followers to subscribe to email, ensuring a direct and consistent connection. Sustainable Growth and Minimized Platform Dependence: Strategies to diversify digital presence and reduce reliance on any single social media platform, thereby mitigating risks associated with platform volatility.
Unlock the secrets to enhancing your digital presence with our masterclass on mastering online visibility. Learn actionable strategies to boost your brand, optimize your social media, and leverage SEO. Transform your online footprint into a powerful tool for growth and engagement.
Key Takeaways:
1. Effective techniques to increase your brand's visibility across various online platforms.
2. Strategies for optimizing social media profiles and content to maximize reach and engagement.
3. Insights into leveraging SEO best practices to improve search engine rankings and drive organic traffic.
2. 1.1 Why Digital Analytics
1.2 How Google Analytics Works
1.3 Google Analytics Setup
1.4 How to Set Up Views with Filters
Chapter 1: Introducing Google Analytics
3. 1.1_Why Digital Analytics?
DIGITAL ANALYTICS helps us
in measuring 3 aspects of Basic
Purchase Funnel.
We can learn the behaviors of
users to understand them, and
adjust our digital sales strategy.
Not only for website, but also
variety of systems.
ACQUISiTION: building awareness & acquiring
user interest.
BEHAVIOR: when users engage in your business
CONVERSION: when user becomes customer
and transacts your business.
4. 1.2_How Google Analytics Works
Have a Google Analytics account
and add a javascript code to your
website to start track:
+ How user interacted with the
page
+ How many preferred product A
instead of B.
+ Traffic source (which
advertisement they clicked on,
language, type of browser,
device, operating system)
This course is primarily on how to measure a
website traffic.
5. 1.2_How Google Analytics Works
Google Analytics tracks per session (of 30 minutes period), and data
collected will be converted into a report.
Page revisit or refresh after 1 session will be counted as new session.
Data that we want to be collected can be filtered according to what we need,
and cannot be changed.
6. 1.3_Google Analytics Setup
Your Google Analytics account(s)
can be grouped into
Organization. Each Account
can have multiple Property, and
each Property can have multiple
View.
View is where we can filter what
data we want to see, we can set
goals per View as well.
Views will not include past
data, and only admins can
recover deleted data in limited
time.
7. 1.3_Google Analytics Setup
Permission to modify Account, Property, and View depends on
who and what authority is/are granted by admins on
User Management tab.
8.
9. GET STARTED: Log in to your standard Google Account to access
analytics.google.com
15. You can change View Name (left)
and Create New View as well (right)
1.4_How to Set Up Views with Filters
16. 1.4_How to Set Up Views with Filters
Create 3 views of: Raw Data,
Test View, Master View.
Raw Data is to store unfiltered
data for back up purpose.
Test View to test new
configurations.
Master View is the base for daily
reporting.
17. On Test View, click Filters, then set up as on image above.
To get your IP, search “What is my IP?” on Google.
1.4_How to Set Up Views with Filters
18. On Reporting > Traffic Resources, check if there’s decline in view
and our IP address has been excluded to make sure filter works.
1.4_How to Set Up Views with Filters
19. To add Filter we created on Test View to Master View,
go to Admin > Filters, then do as on image above.
1.4_How to Set Up Views with Filters
20. To add Filter we created on Test View to Master View,
go to Admin > Filters, then do as on image above.
1.4_How to Set Up Views with Filters
21. 2.1_Navigating Google Analytics
2.2_Understanding Overview Reports
2.3_Understanding Full Reports
2.4_How to Share Reports
2.5_How to Set Up Dashboards and Shortcuts
Chapter 2: The Google Analytics Interface
23. Alert Icon Alert Menu
Clicking the bell icon in the
upper right shows you alerts
about your Google Analytics
properties and views.
2.1_Navigating Google Analytics
24. Feedback, Help, and Settings
At the top right of your Analytics view are two more
icons:
• The "question mark" icon lets you send feedback to
Google Analytics or search Help articles
• The user icon lets you switch between different
Google accounts, manage your current Google
account, or sign out
2.1_Navigating Google Analytics
25. Customization
The Customization section
allows you to create
custom reports, specific to
your business. We'll cover
customization in an
advanced course.
Left Hand Navigation
2.1_Navigating Google Analytics
26. Real Time Reports
Real-Time reports let you
look at live user behavior
on your website including
information like where
your users are coming
from and if they’re
converting.
Audience Reports
Audience reports show you
characteristics about your users
like age and gender, where
they’re from, their interests, how
engaged they were, whether
they’re new or returning users,
and what technology they’re
using.
2.1_Navigating Google Analytics
27. Acquisition Reports
Acquisition reports show you which channels (such as advertising or
marketing campaigns) brought users to your site. This could include
different marketing channels such as:
• "Organic” (or unpaid search)
• “CPC” (“cost per click” or paid search)
• “Referral” (traffic that comes from another website)
• “Social” (from a social network)
• or “Other,” (a group of low volume traffic sources)
2.1_Navigating Google Analytics
28. Behavior Reports
Behavior reports show
how people engaged on
your site including which
pages they viewed, and
their landing and exit
pages.
Conversion Reports
Conversion reports allow you to
track website goals based on
your business objectives.
2.1_Navigating Google Analytics
29. Admin Section
The Admin section contains
all of your Google Analytics
settings such as user
permissions, tracking code,
view settings, and filters.
Collapse Left-Hand Navigation
Use this pointer to shrink the
navigation and provide more
space for your reports.
2.1_Navigating Google Analytics
30. Date Range
At the top of every report is
a date-range. This lets you
set the time period in which
you want to analyze report
data. Click the date range
to open up the date range
selector.
Date Range Selector
This opens up a calendar on the left
where you can select your date
ranges. When you change the date
range, it affects all of the reports in
your view. So you can switch between
different reports without having to
adjust the date range each time.
2.2_Understanding Overview Reports
31. Date Range Comparison
You can also compare data from two different date ranges by clicking
"Compare to" and adding in the date ranges you wish to compare.
This lets you to see how your business changed over time.
2.2_Understanding Overview Reports
32. Segment Picker
At the top of the report, notice the segment picker. Segments are
ways to look at a specific data set and compare metrics. Notice that
the default segment includes all of the Users that visited your site in
the given date range.
2.2_Understanding Overview Reports
33. Line Graph
Below the segment picker are the different metrics of the Audience
Overview report shown in different formats. The most prominent is a
line graph that by default shows a data point for the number of users
on each day over your selected date range.
2.2_Understanding Overview Reports
34. Duration Selector
If you wish to view this data
more specifically, you can
change the data points to
show hourly, weekly, or
monthly, as well. This can
be especially helpful when
looking at large date sets. If
you are looking at data over
a single day, the view will
default to hourly.
Metric Selector
2.2_Understanding Overview Reports
35. Graph Annotator
Notice the small arrow at the bottom of the line graph. Clicking on
the arrow lets you annotate the graph with helpful notes to add
business context to your data. Once you add an annotation, a small
indicator will appear on the graph that can be viewed by other users
with access to the view. Clicking any of the metrics below will show
the data points for those metrics in the line graph above.
2.2_Understanding Overview Reports
37. Language Dimension
The default dimension selected in the Audience Overview report is
“Language.” Note that the table to the right includes the top 10
values for Language. You can also select "Country" or "City" to view
the top 10 values for those dimensions.
2.2_Understanding Overview Reports
40. • “Save” lets you create a link to the specific report in the
Customization area in the left-hand navigation under “Saved
Reports.”
• “Export” lets you save a report to your desktop in different file
formats such as PDF or CSV.
• “Share” lets you email a copy of the report as an attachment
and even schedule regular email updates.
• “Edit” lets you customize the report content by adding metric
groups, filters, or additional views.
2.4_How to Share Reports
41. Hover over the green check icon next to the report name to view the
percent of sessions that the report is based on. Sometimes,
Analytics has to crunch through so much data, that in order to return
your report faster, it will only analyze a sample of the data collected.
This is called “sampling” because it returns an estimate of the exact
count based on a sample of your data.
2.4_How to Share Reports
42. To change the report sampling rate, mouse over the green data
quality icon and click the pulldown menu. If you want your data to be
more accurate and don’t mind the additional response time, leave
this set to "Greater Precision". If you wish to speed up the time it
takes to generate a report and are willing to sacrifice more precise
metrics, select “Faster response.”
2.4_How to Share Reports
50. Demographic and Interests Report
The “Demographics” reports
provide information about the
age and gender of your users.
The “Interests” reports show
your users’ preferences for
certain types of web content like
technology, music, travel, or TV.
• Note that to see data in
these reports, you must first
enable advertising features
in the “Demographics and
Interests” reports for each
property.
3.1_Audience Reports
51. Geographic Reports
The “Location” report under “Geo” is one of the most useful
Audience reports. Google Analytics can anonymously determine a
user’s continent, sub-continent, country, and city through the IP
address used by their browser. Notice the geographic heat map at
the top of the report, which you can adjust to display different
metrics. This can help you decide whether to build awareness or
invest in customer loyalty in particular locations.
3.1_Audience Reports
54. 3.2_Acquisition Reports
You can use the Acquisition reports to compare the performance of
different marketing channels and discover which sources send you
the highest quality traffic and conversions. This can help you make
better decisions about where to focus your marketing efforts.
57. Channels Report
There are other ways to view which traffic sources bring the most
engaged users to the site. Using the “Channels” report, we could
view traffic by channel, which bundles the sources together under
each medium. Traffic sources are automatically grouped into basic
categories (or channels) like Organic, Social, Direct, Referral,
Display, etc.
Referrals Report
If you want to view your traffic organized by which sites have linked
to yours, you can look at the “Referrals” report.
You can even click into individual referrals to see which specific web
pages link back to your site. If you want to understand which specific
pages of your site are being linked to, you can add a secondary
dimension of “landing page” to the report.
3.2_Acquisition Reports
59. 4.1_How to Track A Marketing Campaign
4.2_Tracking Campaigns with URL Builder
4.3_How to Set Up Goals in Analytics
4.4_How to Use Analytics with Google Ads
Chapter 4: Basic Campaign and Conversion
Tracking
60. 4.1_How to Track A Marketing Campaign
Marketing campaigns are tracked in Google Analytics via
"campaign tagging". The campaign tag is additional
information added to the URL link in your online advertising or
marketing material.
61. 4.1_How to Track A Marketing Campaign
There are 5 different campaign tags that can help
you identify specific information about campaign
traffic.
1. Media
2. Source
3. Campaign
4. Content
5. Term
62. 4.2_Tracking Campaigns with URL Builder
Google Analytics provides a feature called "URL Builder"
that helps you easily add campaign parameters to URLs to
track Custom Campaigns.
63. 4.2_Tracking Campaigns with URL Builder
Create URL:
1. Type the URL of
your site (or the
destination where
you want to direct
users through ad
links or campaigns)
1. Fill in the fields for
campaigns,
sources and media.
64. 4.2_Tracking Campaigns with URL Builder
When clicking "Create URL" at the bottom, you can see that
the URL Builder creates a link with all the correct campaign
parameters attached.
This method makes it easy to quickly create campaign tags.
But note, this method can only be used to create one URL at
a time, so it might not be practical for large campaigns
65. 4.2_Tracking Campaigns with URL Builder
Here's an easy way to test a campaign before launching it.
1. Open an incognito window or a secret browsing session.
2. Copy and paste the link that was created into the browser
URL column to track the campaign.
3. After the site loads, explore your site and complete a
number of important actions.
Then open the "All Campaigns" report in the "Acquisition"
section under "Campaigns". This report allows you to
compare incoming traffic from various marketing campaigns.
66. 4.3_How to set up Goals in Analytics
Business goals are actions that you want users to take on
the site. Every time a user completes one of your business
goals, we call it "conversion." After you configure Goals,
Analytics will generate conversion-related metrics, such as
the total number of conversions, and the percentage of users
who convert. We call this the "conversion rate".
67. But in Google Analytics, you use a feature called "Goals" to
track this conversion. After you configure Goals, Analytics will
generate conversion-related metrics, such as the total number
of conversions, and the percentage of users who convert. We
call this the "conversion rate".xccc
71. 4.4_How to Use Analytics with Google Ads
Google Ads is a Google advertising system that allows
businesses to produce text and display ads. Text ads appear
next to Google search results by matching keywords that you
can bid with user search queries.
Display ads are ads that consist of text, images, animations,
and videos that appear on a large collection of sites called the
Google Display Network.
72. 4.4_How to Use Analytics with Google Ads
If your Google Analytics account is linked to a Google Ads
account, you can:
1. view Google Ads click and cost data along with site
interaction data in Google Analytics;
2. create remarketing lists in Analytics for use in Google Ads
campaigns;
3. import Analytics goals and transactions into Google Ads
as conversions;
4. and see Analytics site interaction data on Google Ads.
73. How to link Google Analytics with Google Ads
1. You login to Analytics using the same email as your
Google Ads account.
2. Note that you must be an administrator on both accounts.
3. Click the Admin tab. Next, make sure you select the
account and property that you want to link to the Google
Ads account.
4. In the Property section, select "Google Ads".
5. Click the "New link group" button.
6. The Google Ads account that is linked to your Google
account will appear automatically.
7. Check the account you want to link, then click "continue".
8. Next, type "Link Group Title". This title can be your
Google Ads account ID.
75. Auto-tagging
Google Ads can automatically add special campaign tags to
your Google Ads URL through a feature called auto-tagging.
Auto-tagging is required to send specific Google Ads
dimensions to Google Analytics.
76. Campaign
If the "Campaigns"
report is clicked, we
can see how well
the various Google
Ads campaigns are
performing.
Note that this report
manages Google
Ads campaigns
using the name
specified on Google
Ads. This is one of
the benefits of
linking Google Ads
with Analytics.
77. Keyword
The "Keywords" report can help you understand how well
individual keywords and ads are performing. For example, if a
keyword generates a lot of traffic but has a high bounce rate,
then this might indicate an ad disconnection from the landing
page content.
78. Bid adjustment
Bid adjustment is a Google Ads feature that is used to
automatically adjust keyword bids based on user device,
location, or time. The Bid Adjustment report in Analytics
allows you to analyze Google Ads performance for bid
adjustments set for campaigns.
79. 4.5_Course Summary
What we’ve learned in Google Analytics for Beginners. We
have discussed:
1. Ways digital analytics can help your business
2. How Google Analytics works through the demos
displayed
3. A step-by-step guide for creating an account, installing
the tracking code, and preparing various views with filters
for testing.