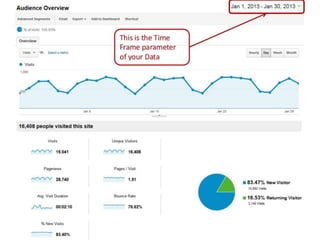
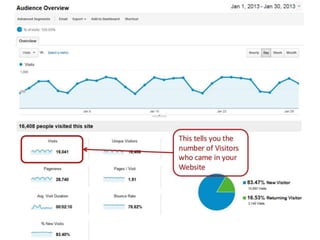
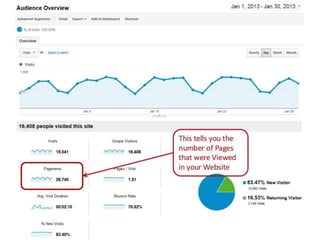
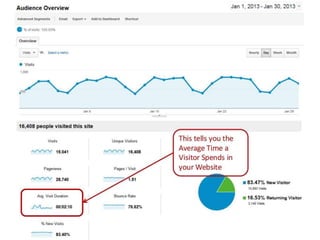
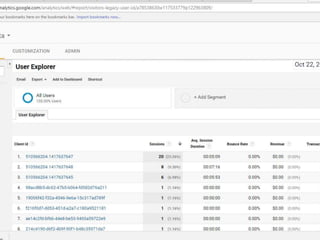
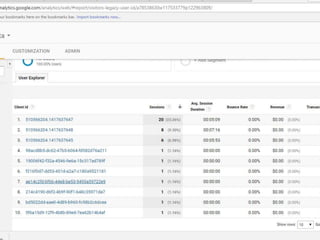
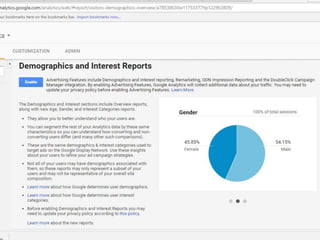
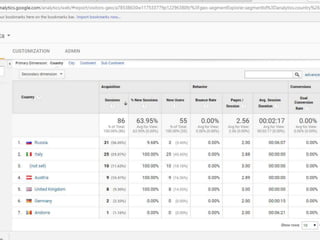
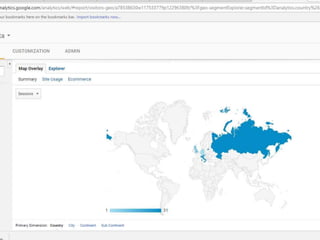
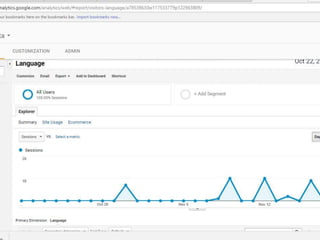
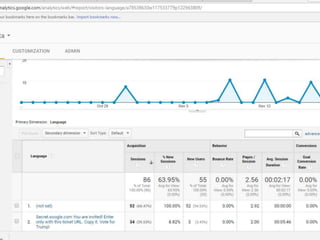
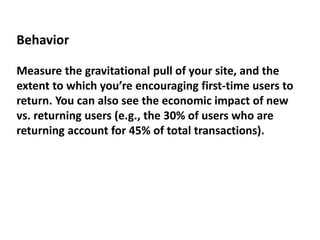
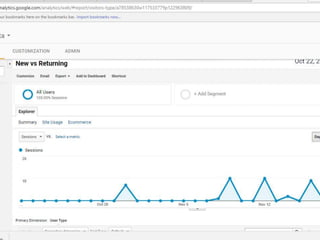
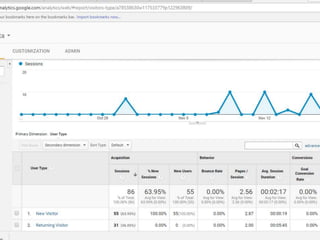
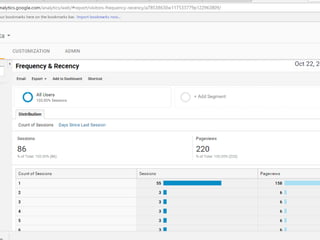
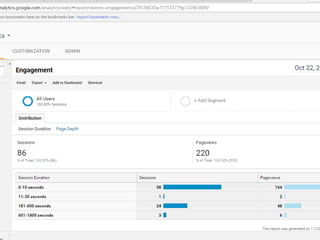
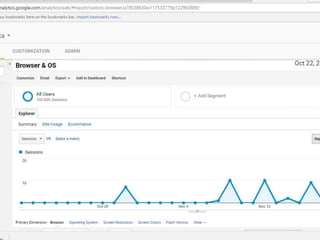
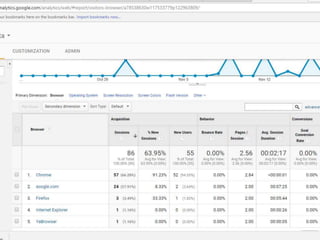
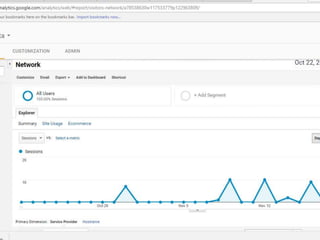
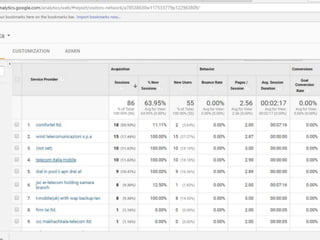
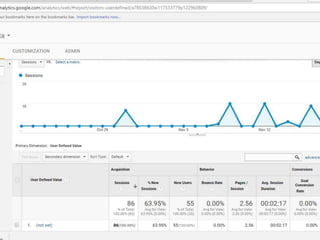
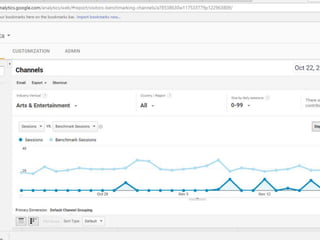
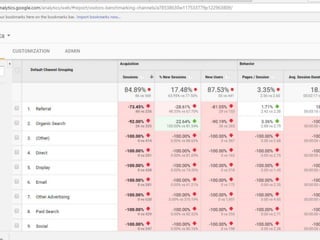
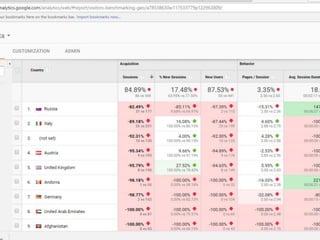
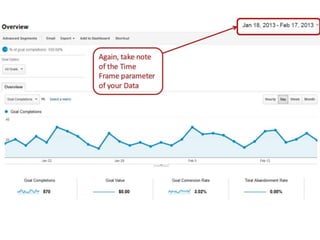
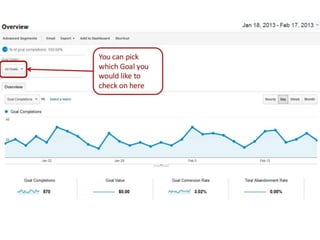
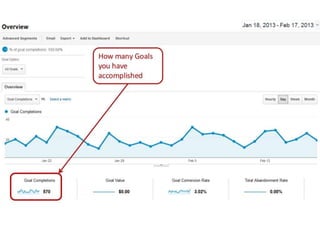
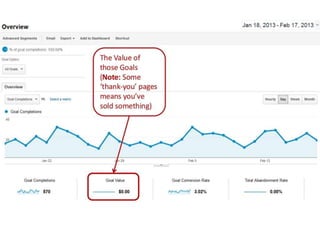
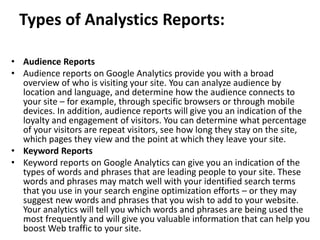
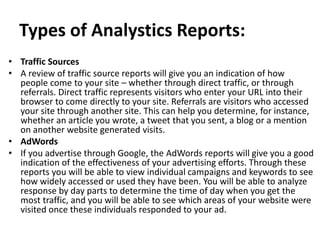
SlideShare a Scribd company logo
Google Analytics
By : Rohit Agarwal( IMM, Delhi)
What is Google Analytics ?
• “Google analytics is the analysis of qualitative and
quantitative data from your business and the
competition to drive a continual improvement of the
online experience that your customers and potential
customers have which translates to your desired
outcomes (both online and offline).”
• How many people visit my website?
• Where do my visitors live?
• Do I need a mobile-friendly website?
• What websites send traffic to my websites?
• What marketing tactics drive the most traffic to my website?
• Which pages on my websites are the most popular?
• How many visitors have I converted into leads or customers?
• Where did my converting visitors come from and go on my
website?
• How can I improve my website’s speed?
• What blog content do my visitors like the most?
Why every website owner needs
Google Analytics
How to view Google Analytics data
To view data from your Google Analytics account in the
Google Publisher Toolbar:
1. In the top right of your Chrome browser, click the Google
Publisher Toolbar icon .
2. Click the gear icon and select Accounts.
3. In the "Enabled accounts" page, next to Google Analytics,
click Enable.
4. Check that the correct Google Account is selected in the
upper right corner of the "Google Publisher Toolbar" page.
5. Click Accept to grant the Google Publisher Toolbar access
to your Google Analytics account.
6. Browse to a page of your site and click the Google
Publisher Toolbar icon .
You can now see Google Analytics data for your current
page in the "Analytics for this page" section.
Shortcuts remember your settings so you don't have to
reconfigure a report each time you open it. Any setting
you apply to a report, like adding an advanced
segment or a new metric, stays applied in a shortcut
until you manually change the settings. The settings
are saved even if you sign out and sign back in to your
account. All report customizations and settings are
saved in a shortcut except the date range. Check the
dates each time you use a shortcut to make sure the
time period you need is applied.
SHORTCUTS
Google Analytics Intelligence Events are one of the
most powerful and underutilized tools in Google
Analytics.
Google Analytics is collecting data about your
website. And, if they detect something out of the
ordinary, it will register in your Google Analytics
Intelligence Reports.
INTELLIGENCE EVENTS
Real-Time allows you to monitor activity as it happens
on your site or app. The reports are updated
continuously and each hit is reported seconds after it
occurs. For example, you can see how many people are
on your site right now, which pages or events they're
interacting with, and which goal conversions have
occurred.
REAL-TIME
Audience Overview
The Audience Overview provides you a holistic view of
traffic in your community within defined date
parameters. The data available to you in the overview is
drilled down further in various sub-sections.
Google Analytics uses a metric called active users
which refers to real time users, when used in the
context of real time reports. Real time users are the
people who are on your website right now.
ACTIVE USER
A cohort is a group of users who share a common
characteristic that is identified in this report by an
Analytics dimension. For example, all users with the
same Acquisition Date belong to the same cohort. The
Cohort Analysis report lets you isolate and analyze
cohort behavior.
COHORT ANALYSIS
User Explorer
Isolate and examine individual rather than aggregate user
behavior. Individual user behavior is associated with
either Client-ID or User-ID.
Demographics
Understanding the age-and-gender composition of your
audience gives you an opportunity to precisely tailor
your content and advertising, from the graphics,
language, and technical sophistication you employ on
your site to the creative contents and placements for
your ads.
Interests
Interest information gives you context for expanding
your advertising into related markets (Affinity
Categories), and for focusing your advertising on exactly
the users who demonstrate a likelihood to consume
your content or purchase your products (In-Market
Segments, Other Categories).
Geo
It’s important to know whether you’re getting a
response from users to whom you direct different
language versions of your advertising, but you also want
to know what kind of traffic you’re getting from users
outside those targets. Maybe you’re advertising in
English and Spanish, but also getting high-conversion
users who speak French and Italian, indicating an
opportunity to localize your ads to those languages and
speak more directly to a lucrative market.
You want information from the areas you already target
in your advertising, but you should also know about
traffic from other geographic areas whose users exhibit
a natural interest in your products.
Behavior
Measure the gravitational pull of your site, and the
extent to which you’re encouraging first-time users to
return. You can also see the economic impact of new
vs. returning users (e.g., the 30% of users who are
returning account for 45% of total transactions).
Technology
Understanding the technologies users employ to reach
and consume your content lets you fine tune current
versions, and plan upcoming implementations. For
example, you want to be sure your site is fully
functional in current browsers, but you also want to
stay abreast of the extent to which users are migrating
away from desktop to mobile browsers and apps, and
plan your development accordingly.
Custom
You can use Custom Variables to extend the scope of
your Segments. User-level custom variables let you
identify users by aggregate behavior over a date
range rather than by discrete, single-session
interactions with your site.
Benchmarking
Benchmarking allows you to compare your data
with aggregated industry data from other
companies who share their data. This provides
valuable context, helping you to set meaningful
targets, gain insight into trends occurring across
your industry, and find out how you are doing
compared to your competition.
Users Flow
Users Flow is a graphical representation of the paths
users took through your site, from the source, through
the various pages, and where along their paths they
exited your site.
Acquisition, Google Analytics’ information on how
visitors arrive to your website.
Acquisition is broken down into 10 sub-categories:
Overview, Channels, All Traffic, Referrals,
Campaigns, Keywords, Cost Analysis, AdWords,
Social and Search Engine Optimization.
Acquisition
User behavior analytics (UBA) is the tracking,
collecting and assessing of user data and activities
using monitoring systems.
Behavior
Conversion tracking is a free tool that shows you what
happens after a customer clicks on your ads -- whether
they purchased a product, signed up for your
newsletter, called your business, or downloaded your
app. When a customer completes an action that
you've defined as valuable, these customer actions are
called conversions.
Conversions
Types of Analystics Reports:
• Audience Reports
• Audience reports on Google Analytics provide you with a broad
overview of who is visiting your site. You can analyze audience by
location and language, and determine how the audience connects to
your site – for example, through specific browsers or through mobile
devices. In addition, audience reports will give you an indication of the
loyalty and engagement of visitors. You can determine what percentage
of your visitors are repeat visitors, see how long they stay on the site,
which pages they view and the point at which they leave your site.
• Keyword Reports
• Keyword reports on Google Analytics can give you an indication of the
types of words and phrases that are leading people to your site. These
words and phrases may match well with your identified search terms
that you use in your search engine optimization efforts – or they may
suggest new words and phrases that you wish to add to your website.
Your analytics will tell you which words and phrases are being used the
most frequently and will give you valuable information that can help you
boost Web traffic to your site.
Types of Analystics Reports:
• Traffic Sources
• A review of traffic source reports will give you an indication of how
people come to your site – whether through direct traffic, or through
referrals. Direct traffic represents visitors who enter your URL into their
browser to come directly to your site. Referrals are visitors who accessed
your site through another site. This can help you determine, for instance,
whether an article you wrote, a tweet that you sent, a blog or a mention
on another website generated visits.
• AdWords
• If you advertise through Google, the AdWords reports will give you a good
indication of the effectiveness of your advertising efforts. Through these
reports you will be able to view individual campaigns and keywords to see
how widely accessed or used they have been. You will be able to analyze
response by day parts to determine the time of day when you get the
most traffic, and you will be able to see which areas of your website were
visited once these individuals responded to your ad.

More Related Content

What's hot

Module 2 onsite webanalytics
Module 2   onsite webanalyticsModule 2   onsite webanalytics
Module 2 onsite webanalytics
Gayathri Choda
 
Module3 offsite webanalytics
Module3   offsite webanalyticsModule3   offsite webanalytics
Module3 offsite webanalytics
Gayathri Choda
 
Module5 other analytics
Module5   other analyticsModule5   other analytics
Module5 other analytics
Gayathri Choda
 
Module4 multichannel analytics
Module4   multichannel analyticsModule4   multichannel analytics
Module4 multichannel analytics
Gayathri Choda
 
Civic1647 Social Media Analytics
Civic1647 Social Media AnalyticsCivic1647 Social Media Analytics
Civic1647 Social Media Analytics
ecambry
 
Module 1 introduction to web analytics
Module 1   introduction to web analyticsModule 1   introduction to web analytics
Module 1 introduction to web analytics
Gayathri Choda
 

What's hot (19)

Module 2 onsite webanalytics
Module 2   onsite webanalyticsModule 2   onsite webanalytics
Module 2 onsite webanalytics
 
Web analytics
Web analyticsWeb analytics
Web analytics
 
An introduction to google analytics for educational marketers
An introduction to google analytics for educational marketersAn introduction to google analytics for educational marketers
An introduction to google analytics for educational marketers
 
Introduction to Google Analytics
Introduction to Google AnalyticsIntroduction to Google Analytics
Introduction to Google Analytics
 
Google analytics
Google analyticsGoogle analytics
Google analytics
 
Module3 offsite webanalytics
Module3   offsite webanalyticsModule3   offsite webanalytics
Module3 offsite webanalytics
 
Module5 other analytics
Module5   other analyticsModule5   other analytics
Module5 other analytics
 
Module4 multichannel analytics
Module4   multichannel analyticsModule4   multichannel analytics
Module4 multichannel analytics
 
Metrics to Track Using Google Analytics for a SAAS company
Metrics to Track Using Google Analytics for a SAAS companyMetrics to Track Using Google Analytics for a SAAS company
Metrics to Track Using Google Analytics for a SAAS company
 
6 th project navigating, reports, and dashboards
6 th project navigating, reports, and dashboards6 th project navigating, reports, and dashboards
6 th project navigating, reports, and dashboards
 
One Point Solution Assignments, Projects, Synopsis
One Point Solution  Assignments, Projects, SynopsisOne Point Solution  Assignments, Projects, Synopsis
One Point Solution Assignments, Projects, Synopsis
 
Google Analytics 101
Google Analytics 101Google Analytics 101
Google Analytics 101
 
Google Analytics Training
Google Analytics TrainingGoogle Analytics Training
Google Analytics Training
 
Web Analytics 101
Web Analytics 101Web Analytics 101
Web Analytics 101
 
Civic1647 Social Media Analytics
Civic1647 Social Media AnalyticsCivic1647 Social Media Analytics
Civic1647 Social Media Analytics
 
Module 1 introduction to web analytics
Module 1   introduction to web analyticsModule 1   introduction to web analytics
Module 1 introduction to web analytics
 
Introduction to Google Analytics
Introduction to Google AnalyticsIntroduction to Google Analytics
Introduction to Google Analytics
 
analytics_def
analytics_defanalytics_def
analytics_def
 
Introduction to Google Analytics
Introduction to Google AnalyticsIntroduction to Google Analytics
Introduction to Google Analytics
 

Viewers also liked

Advanced Google Analytics: Top 10 Things Your Association Should be Measuring...
Advanced Google Analytics: Top 10 Things Your Association Should be Measuring...Advanced Google Analytics: Top 10 Things Your Association Should be Measuring...
Advanced Google Analytics: Top 10 Things Your Association Should be Measuring...
WebLink International
 
Google Analytics, Your Online P&L Statment
Google Analytics, Your Online P&L StatmentGoogle Analytics, Your Online P&L Statment
Google Analytics, Your Online P&L Statment
Rich Benjamin
 
Google Analytics Dashboard designed as an Infographic
Google Analytics Dashboard designed as an InfographicGoogle Analytics Dashboard designed as an Infographic
Google Analytics Dashboard designed as an Infographic
Ritvvij Parrikh
 
Google Analytics Dashboard Design
Google Analytics Dashboard DesignGoogle Analytics Dashboard Design
Google Analytics Dashboard Design
Ritvvij Parrikh
 

Viewers also liked (19)

Advanced Google Analytics: Top 10 Things Your Association Should be Measuring...
Advanced Google Analytics: Top 10 Things Your Association Should be Measuring...Advanced Google Analytics: Top 10 Things Your Association Should be Measuring...
Advanced Google Analytics: Top 10 Things Your Association Should be Measuring...
 
HOW TO USE COHORTS OF GOOGLE ANALYTICS
HOW TO USE COHORTS OF GOOGLE ANALYTICSHOW TO USE COHORTS OF GOOGLE ANALYTICS
HOW TO USE COHORTS OF GOOGLE ANALYTICS
 
How do you measure the sucess of AP automation
How do you measure the sucess of AP automationHow do you measure the sucess of AP automation
How do you measure the sucess of AP automation
 
Data analysis copy
Data analysis   copyData analysis   copy
Data analysis copy
 
Ms Excel Anlysis Tools Project #1
Ms Excel Anlysis Tools  Project #1Ms Excel Anlysis Tools  Project #1
Ms Excel Anlysis Tools Project #1
 
Google Analytics, Your Online P&L Statment
Google Analytics, Your Online P&L StatmentGoogle Analytics, Your Online P&L Statment
Google Analytics, Your Online P&L Statment
 
DiSo Dashboard Outline
DiSo Dashboard OutlineDiSo Dashboard Outline
DiSo Dashboard Outline
 
Google Analytics Dashboard designed as an Infographic
Google Analytics Dashboard designed as an InfographicGoogle Analytics Dashboard designed as an Infographic
Google Analytics Dashboard designed as an Infographic
 
Google Analytics Dashboard Design
Google Analytics Dashboard DesignGoogle Analytics Dashboard Design
Google Analytics Dashboard Design
 
SMX Israel 2012 - Dashboard in Google Analytics
SMX Israel 2012 - Dashboard in Google AnalyticsSMX Israel 2012 - Dashboard in Google Analytics
SMX Israel 2012 - Dashboard in Google Analytics
 
Google Analytics Web Report
Google Analytics Web Report Google Analytics Web Report
Google Analytics Web Report
 
Logicentrix Dashboards And Scorecards
Logicentrix Dashboards And ScorecardsLogicentrix Dashboards And Scorecards
Logicentrix Dashboards And Scorecards
 
Balanced Scorecard powered by Basecamp
Balanced Scorecard powered by BasecampBalanced Scorecard powered by Basecamp
Balanced Scorecard powered by Basecamp
 
Social Media Mining - Chapter 10 (Behavior Analytics)
Social Media Mining - Chapter 10 (Behavior Analytics)Social Media Mining - Chapter 10 (Behavior Analytics)
Social Media Mining - Chapter 10 (Behavior Analytics)
 
IgniteNM - Google Analytics: Beyond the Dashboard
IgniteNM - Google Analytics: Beyond the DashboardIgniteNM - Google Analytics: Beyond the Dashboard
IgniteNM - Google Analytics: Beyond the Dashboard
 
Online dashboard using Google Analytics API Measure Camp
Online dashboard using Google Analytics API Measure CampOnline dashboard using Google Analytics API Measure Camp
Online dashboard using Google Analytics API Measure Camp
 
An Interactive Visual Analytics Dashboard for the Employment Situation Report
An Interactive Visual Analytics Dashboard for the Employment Situation ReportAn Interactive Visual Analytics Dashboard for the Employment Situation Report
An Interactive Visual Analytics Dashboard for the Employment Situation Report
 
Analytics Dashboard
Analytics DashboardAnalytics Dashboard
Analytics Dashboard
 
Creating Interactive Dashboards with Microsoft Excel
Creating Interactive Dashboards with Microsoft ExcelCreating Interactive Dashboards with Microsoft Excel
Creating Interactive Dashboards with Microsoft Excel
 

Similar to Google Analytics ( Digital Marketing ) Dashboard , Sessions, Technology

Webtrends presentation
Webtrends presentationWebtrends presentation
Webtrends presentation
citsweb
 
Analytics For Leaders
Analytics For LeadersAnalytics For Leaders
Analytics For Leaders
Tunheim
 
Google Analytics Ppt Final
Google Analytics Ppt FinalGoogle Analytics Ppt Final
Google Analytics Ppt Final
barbwhite325
 

Similar to Google Analytics ( Digital Marketing ) Dashboard , Sessions, Technology (20)

An Introduction to Web Analytics
An Introduction to Web AnalyticsAn Introduction to Web Analytics
An Introduction to Web Analytics
 
Google Analytics ppt
Google Analytics  pptGoogle Analytics  ppt
Google Analytics ppt
 
Google Analytics
Google AnalyticsGoogle Analytics
Google Analytics
 
SUNY Purchase Social Media Certificate Program - Session 4
SUNY Purchase Social Media Certificate Program - Session 4SUNY Purchase Social Media Certificate Program - Session 4
SUNY Purchase Social Media Certificate Program - Session 4
 
Hotjar vs Google Analytics.pdf
Hotjar vs Google Analytics.pdfHotjar vs Google Analytics.pdf
Hotjar vs Google Analytics.pdf
 
Google analytics
Google analyticsGoogle analytics
Google analytics
 
Google Analytics Training
Google Analytics TrainingGoogle Analytics Training
Google Analytics Training
 
Google Analytics 101
Google Analytics 101Google Analytics 101
Google Analytics 101
 
Google analytics version 4 in details
Google analytics version 4 in detailsGoogle analytics version 4 in details
Google analytics version 4 in details
 
Web Analytics
Web AnalyticsWeb Analytics
Web Analytics
 
Google analytics glossary
Google analytics glossaryGoogle analytics glossary
Google analytics glossary
 
Webtrends presentation
Webtrends presentationWebtrends presentation
Webtrends presentation
 
Understanding Google Analytics
Understanding Google AnalyticsUnderstanding Google Analytics
Understanding Google Analytics
 
How Much Traffic Does This Website Get.pdf
How Much Traffic Does This Website Get.pdfHow Much Traffic Does This Website Get.pdf
How Much Traffic Does This Website Get.pdf
 
Introduction about Quora, Google analytics and Google Ad Words
Introduction about Quora, Google analytics and Google Ad WordsIntroduction about Quora, Google analytics and Google Ad Words
Introduction about Quora, Google analytics and Google Ad Words
 
Google Analytics.pptx
Google Analytics.pptxGoogle Analytics.pptx
Google Analytics.pptx
 
Analytics For Leaders
Analytics For LeadersAnalytics For Leaders
Analytics For Leaders
 
Minutes Of Class Google Ads (team G).pdf
Minutes Of Class Google Ads (team G).pdfMinutes Of Class Google Ads (team G).pdf
Minutes Of Class Google Ads (team G).pdf
 
Google analytics glossary
Google analytics glossaryGoogle analytics glossary
Google analytics glossary
 
Google Analytics Ppt Final
Google Analytics Ppt FinalGoogle Analytics Ppt Final
Google Analytics Ppt Final
 

More from IMM Graduate School

More from IMM Graduate School (13)

METRO Cash & Carry India
METRO Cash & Carry IndiaMETRO Cash & Carry India
METRO Cash & Carry India
 
Designing banner and logo (Digital Marketing) Web Design and Development
Designing  banner and logo (Digital Marketing) Web Design and DevelopmentDesigning  banner and logo (Digital Marketing) Web Design and Development
Designing banner and logo (Digital Marketing) Web Design and Development
 
CMS ( Content Management System ) Digital Marketing
CMS ( Content Management System ) Digital MarketingCMS ( Content Management System ) Digital Marketing
CMS ( Content Management System ) Digital Marketing
 
SEO (Search Engine Opimization) Digital Marketing
SEO (Search Engine Opimization) Digital MarketingSEO (Search Engine Opimization) Digital Marketing
SEO (Search Engine Opimization) Digital Marketing
 
SMO ( Social Media Optimization ) Digital Marketing
SMO ( Social Media Optimization ) Digital MarketingSMO ( Social Media Optimization ) Digital Marketing
SMO ( Social Media Optimization ) Digital Marketing
 
Harley Davidson ( Strategic Management Report) Mission, Vision
Harley Davidson ( Strategic Management Report) Mission, VisionHarley Davidson ( Strategic Management Report) Mission, Vision
Harley Davidson ( Strategic Management Report) Mission, Vision
 
Flipkart (Consumer Behavior Buying Decision Process)
Flipkart (Consumer Behavior Buying Decision Process)Flipkart (Consumer Behavior Buying Decision Process)
Flipkart (Consumer Behavior Buying Decision Process)
 
Blue ocean strategy ( IPL example )
Blue ocean strategy ( IPL example ) Blue ocean strategy ( IPL example )
Blue ocean strategy ( IPL example )
 
Terminal 4, Changi airport Singapore
Terminal 4, Changi airport SingaporeTerminal 4, Changi airport Singapore
Terminal 4, Changi airport Singapore
 
Listening (Process of communication)
Listening (Process of communication)Listening (Process of communication)
Listening (Process of communication)
 
Lux (H.U.L.) positioning of Lux
Lux (H.U.L.) positioning of LuxLux (H.U.L.) positioning of Lux
Lux (H.U.L.) positioning of Lux
 
Black Money
Black MoneyBlack Money
Black Money
 
Baby brand safffron (Most expensive spice in the world)
Baby brand safffron (Most expensive spice in the world)Baby brand safffron (Most expensive spice in the world)
Baby brand safffron (Most expensive spice in the world)
 

Recently uploaded

“To be integrated is to feel secure, to feel connected.” The views and experi...
“To be integrated is to feel secure, to feel connected.” The views and experi...“To be integrated is to feel secure, to feel connected.” The views and experi...
“To be integrated is to feel secure, to feel connected.” The views and experi...
AJHSSR Journal
 
Grow Your Instagram Profile Organically A Guide to Real Engagement.pdf
Grow Your Instagram Profile Organically A Guide to Real Engagement.pdfGrow Your Instagram Profile Organically A Guide to Real Engagement.pdf
Grow Your Instagram Profile Organically A Guide to Real Engagement.pdf
SocioCosmos
 
How to blow up on social media simple di
How to blow up on social media simple diHow to blow up on social media simple di
How to blow up on social media simple di
RachaelOnuche
 

Recently uploaded (16)

Multilingual SEO Services | Multilingual Keyword Research | Filose
Multilingual SEO Services |  Multilingual Keyword Research | FiloseMultilingual SEO Services |  Multilingual Keyword Research | Filose
Multilingual SEO Services | Multilingual Keyword Research | Filose
 
How social media marketing helps businesses in 2024.pdf
How social media marketing helps businesses in 2024.pdfHow social media marketing helps businesses in 2024.pdf
How social media marketing helps businesses in 2024.pdf
 
LORRAINE ANDREI_LEQUIGAN_HOW TO USE TRELLO.pptx
LORRAINE ANDREI_LEQUIGAN_HOW TO USE TRELLO.pptxLORRAINE ANDREI_LEQUIGAN_HOW TO USE TRELLO.pptx
LORRAINE ANDREI_LEQUIGAN_HOW TO USE TRELLO.pptx
 
Looking to Drive Traffic from Pinterest?
Looking to Drive Traffic from Pinterest?Looking to Drive Traffic from Pinterest?
Looking to Drive Traffic from Pinterest?
 
7 Tips on Social Media Marketing strategy
7 Tips on Social Media Marketing strategy7 Tips on Social Media Marketing strategy
7 Tips on Social Media Marketing strategy
 
“To be integrated is to feel secure, to feel connected.” The views and experi...
“To be integrated is to feel secure, to feel connected.” The views and experi...“To be integrated is to feel secure, to feel connected.” The views and experi...
“To be integrated is to feel secure, to feel connected.” The views and experi...
 
Grow Your Instagram Profile Organically A Guide to Real Engagement.pdf
Grow Your Instagram Profile Organically A Guide to Real Engagement.pdfGrow Your Instagram Profile Organically A Guide to Real Engagement.pdf
Grow Your Instagram Profile Organically A Guide to Real Engagement.pdf
 
How to blow up on social media simple di
How to blow up on social media simple diHow to blow up on social media simple di
How to blow up on social media simple di
 
Non-Financial Information and Firm Risk Non-Financial Information and Firm Risk
Non-Financial Information and Firm Risk Non-Financial Information and Firm RiskNon-Financial Information and Firm Risk Non-Financial Information and Firm Risk
Non-Financial Information and Firm Risk Non-Financial Information and Firm Risk
 
Get Ahead with YouTube Growth Services....
Get Ahead with YouTube Growth Services....Get Ahead with YouTube Growth Services....
Get Ahead with YouTube Growth Services....
 
Children's Data Privacy_April-22_2024.pdf
Children's Data Privacy_April-22_2024.pdfChildren's Data Privacy_April-22_2024.pdf
Children's Data Privacy_April-22_2024.pdf
 
Experience genuine and sustainable growth on TikTok.
Experience genuine and sustainable growth on TikTok.Experience genuine and sustainable growth on TikTok.
Experience genuine and sustainable growth on TikTok.
 
Want to Amplify Your Pinterest Content?...
Want to Amplify Your Pinterest Content?...Want to Amplify Your Pinterest Content?...
Want to Amplify Your Pinterest Content?...
 
Social Media kdjhadhnjbdsjbdff fjkjasfkl
Social Media kdjhadhnjbdsjbdff fjkjasfklSocial Media kdjhadhnjbdsjbdff fjkjasfkl
Social Media kdjhadhnjbdsjbdff fjkjasfkl
 
Top 10 Best Motivational Movies Of Bollywood
Top 10 Best Motivational Movies Of BollywoodTop 10 Best Motivational Movies Of Bollywood
Top 10 Best Motivational Movies Of Bollywood
 
Call Girls Dehradun | ₹,9500 Pay Cash 9719300533 Free Home Delivery Escorts S...
Call Girls Dehradun | ₹,9500 Pay Cash 9719300533 Free Home Delivery Escorts S...Call Girls Dehradun | ₹,9500 Pay Cash 9719300533 Free Home Delivery Escorts S...
Call Girls Dehradun | ₹,9500 Pay Cash 9719300533 Free Home Delivery Escorts S...
 

Google Analytics ( Digital Marketing ) Dashboard , Sessions, Technology

  • 1. Google Analytics By : Rohit Agarwal( IMM, Delhi)
  • 2. What is Google Analytics ? • “Google analytics is the analysis of qualitative and quantitative data from your business and the competition to drive a continual improvement of the online experience that your customers and potential customers have which translates to your desired outcomes (both online and offline).”
  • 3. • How many people visit my website? • Where do my visitors live? • Do I need a mobile-friendly website? • What websites send traffic to my websites? • What marketing tactics drive the most traffic to my website? • Which pages on my websites are the most popular? • How many visitors have I converted into leads or customers? • Where did my converting visitors come from and go on my website? • How can I improve my website’s speed? • What blog content do my visitors like the most? Why every website owner needs Google Analytics
  • 4. How to view Google Analytics data To view data from your Google Analytics account in the Google Publisher Toolbar: 1. In the top right of your Chrome browser, click the Google Publisher Toolbar icon . 2. Click the gear icon and select Accounts. 3. In the "Enabled accounts" page, next to Google Analytics, click Enable. 4. Check that the correct Google Account is selected in the upper right corner of the "Google Publisher Toolbar" page. 5. Click Accept to grant the Google Publisher Toolbar access to your Google Analytics account. 6. Browse to a page of your site and click the Google Publisher Toolbar icon . You can now see Google Analytics data for your current page in the "Analytics for this page" section.
  • 5.
  • 6.
  • 7.
  • 8.
  • 9.
  • 10.
  • 11.
  • 12. Shortcuts remember your settings so you don't have to reconfigure a report each time you open it. Any setting you apply to a report, like adding an advanced segment or a new metric, stays applied in a shortcut until you manually change the settings. The settings are saved even if you sign out and sign back in to your account. All report customizations and settings are saved in a shortcut except the date range. Check the dates each time you use a shortcut to make sure the time period you need is applied. SHORTCUTS
  • 13.
  • 14. Google Analytics Intelligence Events are one of the most powerful and underutilized tools in Google Analytics. Google Analytics is collecting data about your website. And, if they detect something out of the ordinary, it will register in your Google Analytics Intelligence Reports. INTELLIGENCE EVENTS
  • 15.
  • 16. Real-Time allows you to monitor activity as it happens on your site or app. The reports are updated continuously and each hit is reported seconds after it occurs. For example, you can see how many people are on your site right now, which pages or events they're interacting with, and which goal conversions have occurred. REAL-TIME
  • 17.
  • 18.
  • 19. Audience Overview The Audience Overview provides you a holistic view of traffic in your community within defined date parameters. The data available to you in the overview is drilled down further in various sub-sections.
  • 20.
  • 21.
  • 22.
  • 23.
  • 24.
  • 25.
  • 26.
  • 27.
  • 28. Google Analytics uses a metric called active users which refers to real time users, when used in the context of real time reports. Real time users are the people who are on your website right now. ACTIVE USER
  • 29.
  • 30.
  • 31. A cohort is a group of users who share a common characteristic that is identified in this report by an Analytics dimension. For example, all users with the same Acquisition Date belong to the same cohort. The Cohort Analysis report lets you isolate and analyze cohort behavior. COHORT ANALYSIS
  • 32.
  • 33.
  • 34.
  • 35.
  • 36. User Explorer Isolate and examine individual rather than aggregate user behavior. Individual user behavior is associated with either Client-ID or User-ID.
  • 37.
  • 38.
  • 39. Demographics Understanding the age-and-gender composition of your audience gives you an opportunity to precisely tailor your content and advertising, from the graphics, language, and technical sophistication you employ on your site to the creative contents and placements for your ads.
  • 40.
  • 41. Interests Interest information gives you context for expanding your advertising into related markets (Affinity Categories), and for focusing your advertising on exactly the users who demonstrate a likelihood to consume your content or purchase your products (In-Market Segments, Other Categories).
  • 42. Geo It’s important to know whether you’re getting a response from users to whom you direct different language versions of your advertising, but you also want to know what kind of traffic you’re getting from users outside those targets. Maybe you’re advertising in English and Spanish, but also getting high-conversion users who speak French and Italian, indicating an opportunity to localize your ads to those languages and speak more directly to a lucrative market. You want information from the areas you already target in your advertising, but you should also know about traffic from other geographic areas whose users exhibit a natural interest in your products.
  • 43.
  • 44.
  • 45.
  • 46.
  • 47. Behavior Measure the gravitational pull of your site, and the extent to which you’re encouraging first-time users to return. You can also see the economic impact of new vs. returning users (e.g., the 30% of users who are returning account for 45% of total transactions).
  • 48.
  • 49.
  • 50.
  • 51.
  • 52. Technology Understanding the technologies users employ to reach and consume your content lets you fine tune current versions, and plan upcoming implementations. For example, you want to be sure your site is fully functional in current browsers, but you also want to stay abreast of the extent to which users are migrating away from desktop to mobile browsers and apps, and plan your development accordingly.
  • 53.
  • 54.
  • 55.
  • 56.
  • 57. Custom You can use Custom Variables to extend the scope of your Segments. User-level custom variables let you identify users by aggregate behavior over a date range rather than by discrete, single-session interactions with your site.
  • 58.
  • 59.
  • 60.
  • 61.
  • 62. Benchmarking Benchmarking allows you to compare your data with aggregated industry data from other companies who share their data. This provides valuable context, helping you to set meaningful targets, gain insight into trends occurring across your industry, and find out how you are doing compared to your competition.
  • 63.
  • 64.
  • 65.
  • 66.
  • 67.
  • 68.
  • 69. Users Flow Users Flow is a graphical representation of the paths users took through your site, from the source, through the various pages, and where along their paths they exited your site.
  • 70.
  • 71.
  • 72. Acquisition, Google Analytics’ information on how visitors arrive to your website. Acquisition is broken down into 10 sub-categories: Overview, Channels, All Traffic, Referrals, Campaigns, Keywords, Cost Analysis, AdWords, Social and Search Engine Optimization. Acquisition
  • 73.
  • 74.
  • 75. User behavior analytics (UBA) is the tracking, collecting and assessing of user data and activities using monitoring systems. Behavior
  • 76.
  • 77.
  • 78. Conversion tracking is a free tool that shows you what happens after a customer clicks on your ads -- whether they purchased a product, signed up for your newsletter, called your business, or downloaded your app. When a customer completes an action that you've defined as valuable, these customer actions are called conversions. Conversions
  • 79.
  • 80.
  • 81.
  • 82.
  • 83.
  • 84.
  • 85.
  • 86.
  • 87.
  • 88.
  • 89. Types of Analystics Reports: • Audience Reports • Audience reports on Google Analytics provide you with a broad overview of who is visiting your site. You can analyze audience by location and language, and determine how the audience connects to your site – for example, through specific browsers or through mobile devices. In addition, audience reports will give you an indication of the loyalty and engagement of visitors. You can determine what percentage of your visitors are repeat visitors, see how long they stay on the site, which pages they view and the point at which they leave your site. • Keyword Reports • Keyword reports on Google Analytics can give you an indication of the types of words and phrases that are leading people to your site. These words and phrases may match well with your identified search terms that you use in your search engine optimization efforts – or they may suggest new words and phrases that you wish to add to your website. Your analytics will tell you which words and phrases are being used the most frequently and will give you valuable information that can help you boost Web traffic to your site.
  • 90. Types of Analystics Reports: • Traffic Sources • A review of traffic source reports will give you an indication of how people come to your site – whether through direct traffic, or through referrals. Direct traffic represents visitors who enter your URL into their browser to come directly to your site. Referrals are visitors who accessed your site through another site. This can help you determine, for instance, whether an article you wrote, a tweet that you sent, a blog or a mention on another website generated visits. • AdWords • If you advertise through Google, the AdWords reports will give you a good indication of the effectiveness of your advertising efforts. Through these reports you will be able to view individual campaigns and keywords to see how widely accessed or used they have been. You will be able to analyze response by day parts to determine the time of day when you get the most traffic, and you will be able to see which areas of your website were visited once these individuals responded to your ad.