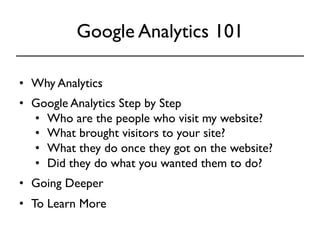
Google Analytics 101 
Francesca Lorenzoni 
September 16, 2014 
Start-up Chile Academy, CMI, Santiago
Google Analytics 101 
• Why Analytics 
• Google Analytics Step by Step 
• Who are the people who visit my website? 
• What brought visitors to your site? 
• What they do once they got on the website? 
• Did they do what you wanted them to do? 
• Going Deeper 
• To Learn More
Why Analytics
Web Analytics: Definition 
(1) the analysis of qualitative and 
quantitative data from your website and the 
competition, 
(2) to drive a continual improvement of the 
online experience that your customers, and 
potential customers have, 
(3) which translates into your desired 
outcomes (online and offline). 
*by Avinash Kaushik
Web Analytics: Definition 
(1) the analysis of qualitative and 
quantitative data from DATA 
your website and the 
competition, 
(2) to drive a continual improvement of the 
online experience that your customers, and 
potential customers have, 
(3) which translates into your desired 
outcomes (online and offline).
Web Analytics: Definition 
(1) the analysis of qualitative and 
quantitative data from DATA 
your website and the 
competition, 
(2) to drive a continual improvement of the 
online experience ACTION 
that your customers, and 
potential customers have, 
(3) which translates into your desired 
outcomes (onlineR aEnSd UofLfliTneS) .
Why you NEED Analytics? 
Web Analytics is the 
foundation for running 
a successful website. 
Without it, you are flying blind. 
Brian Clifton
Who Can Use Analytics? 
Executives can learn: 
• Which marketing initiatives are most effective 
• Which customer and customer segments are most valuable 
Marketers can learn: 
• Where users come from and what do they do on the site 
• How can the website convert more users into customers 
• Which keywords resonate with prospects and lead to conversions 
• Which online ad or creative is the most effective 
Content Creators can learn: 
• Where people leave the site 
• Which pages retain users the longest
Most Important Step: Identifying Goals 
A goal is the reason why 
you put up a website in the first place. 
Think of a goal as specific and measurable 
actions that you want your visitors to complete 
before they leave your website.
Examples 
• Visitors downloading a document 
• Visitors completing a contact form 
• Visitors completing a purchase 
• Visitors who spend more than 5 min on 
the website (engagement) 
• “Negative goals”: #of zero search results 
• ….
Why Google Analytics 
• Free 
• Easy to integrate in your website 
• Easy to read reports 
• Real-time reports 
• Custom reports
Limits of Google Analytics 
GA is not perfect: there are some errors. 
But while the numbers aren’t exact, 
the data is still very useful. 
Analytics is about identifying trends, 
not about getting hung up on precise numbers.
Google Analytics Step By Step
Standard Report
Standard Report 
A session is a group of interactions that take place on 
your website within a given time frame. 
There are two methods by which a session ends: 
Time-based expiry (including end of day): after 30 minutes of inactivity or at midnight 
Campaign change: if a user arrives via one campaign, leaves, and then comes back via a 
different campaign.
Standard Report 
How many users viewed or interacted with your 
content within a specific date range.
Standard Report 
A pageview is an instance of a page being loaded 
by a browser. 
The Pageviews metric is the total number of pages viewed. 
Repeated views of a single page are also counted.
Standard Report 
The Pages/Session metric displays the average 
number of pages viewed per session. 
Repeated views of a single page are counted in this calculation.
Standard Report 
Average session duration is: 
total duration of all sessions (in seconds) 
number of sessions.
Standard Report 
Bounce rate is the percentage of visits in which users 
view only a single page of your site.
Standard Report 
% New Session is the percent of total users who 
came your site for the first time
Standard Report
Your favourites, all in one page. 
Quick links. 
Out of the ordinary events 
Use intelligence to identify important changes and 
predict the future based on that information. 
What’s happening right NOW? 
Use real time reporting when you launch, announce 
something, to see if it’s working, and to test new 
campaigns, to ensure that tracking is ok.
Who are the people who visit my website? 
What brought visitors to your site? 
What they do once they got on the website? 
Did they do what you wanted them to do?
Who are the people who visit 
my website? 
Audience
Demographics: age and gender
Demographics: age and gender 
DATA 
• Which age groups and 
gender visit your website. 
• Which age groups and 
gender are mostly likely to 
convert. 
ACTION 
• Target the most converting 
groups to increase the 
likelihood of making a 
conversion.
Interests
Interests 
DATA ACTION 
• Affinity Category: potential 
customers, higher in the purchase 
funnel or near the beginning of 
the process. 
• In-Market Segment: users 
likely to be ready to purchase in 
the specified category, near the 
end of the purchase funnel. 
• Other Category: users who 
are not in those other categories. 
• Target ads based on the 
interest group that is mostly 
likely to convert. 
• Target your content toward 
the main interests of 
audiences that already come 
to your website.
Geo: Language and Location
Geo: Language and Location 
DATA ACTION 
• Check and improve the 
effectiveness of existing 
geotargeted campaigns. 
• Target the locations and 
languages of visitors most 
likely to convert. 
• Market Discovery. 
• Which language and 
location groups visit your 
website. 
• Which language and 
location groups are mostly 
likely to convert.
Behaviour: New vs Returning
Behaviour: Frequency & Recency 
Count of sessions
Behaviour: Frequency & Recency 
Days since last session
Behaviour: Engagement
Behaviour: New vs Returning 
DATA ACTION 
• If returning visitors are more 
likely to convert, get first-time 
visitors back onto the website 
by having them subscribe or 
remarketing them. 
• If new visitors are more likely 
to convert, aim for conversion 
optimization strategies that 
grab people on their first visit. 
• Which between new and 
returning visitors are mostly 
likely to convert. 
• How and when people return 
to the website. 
• Engagement with the website.
Technology
Technology 
DATA ACTION 
• Fix any problem that some 
browsers could have. 
• Check constantly if the 
website is working well in 
the top three browsers the 
visitors use. 
• What are the browsers 
with problems. 
• What are the most used 
browsers.
Mobile Report
Mobile Report 
DATA ACTION 
• Focus your effort on target 
the devices converting 
more. 
• Is it time to create an app? 
• The percentage of visits 
from mobile, tablet and 
desktop. 
• Whick between mobile, 
table and desktop is more 
likely to convert.
Users Flow
Users Flow 
DATA ACTION 
• Identify and improve the 
pages on your website 
leading visitors to view even 
more pages. 
• Traffic patterns and flow 
(note: you can also highlight 
segments!) from the starting 
page through as many 
interactions users make or 
pages they view.
What brought visitors 
to your site? 
Aquisition
Channels 
ORGANIC SEARCH PAID SEARCH DIRECT 
Visitors from search 
engines. 
Visitors from paid 
search ads 
(AdWords…). 
Visitors without a 
traceable referral source 
(URL into the browser 
or bookmarks). 
REFERRAL SOCIAL OTHER 
Visitors from other 
websites. 
Visitors from social 
networks. 
Visitors from links with 
UTM parameters for 
custom campaign 
tracking.
Url Builder 
www.analytics101.com/? 
utm_source=newsletter-06-2014&utm_medium=email&utm_term=analytics&ut 
m_content=version1&utm_campaign=startupchile
Channels
Channels 
DATA ACTION 
• Invest more on the traffic 
sources that are bringing 
you more conversion. 
• Adjust the investments in 
the sources that are not 
bringing enough 
conversions. 
• Which are your top traffic 
sources. 
• Which traffic source 
convert more and which are 
not working good.
All Traffic
All Traffic 
DATA ACTION 
• Where most of your traffic 
comes from. 
• What is the engagement rate for 
each source. 
• What sources are bringing you 
converting visitors. 
• Changes in time (sudden drop or 
rise in traffic). 
• Improve your advertising 
efforts investing more in the 
converting sources.
All Referrals
All Referrals 
DATA ACTION 
• Identify your strongest and 
most influential brand 
advocates on Twitter / 
Pinterest /Blogs and build a 
relationship with them so 
that they continue to do so 
• Details about traffic from 
other websites. 
• Which tweets* / pins / 
Google images are driving 
the most traffic to your 
website. 
* Use this plugin: 
www.campalyst.com/plugin
Campaigns
Campaigns 
DATA ACTION 
• Fix campaings with more 
spending than revenue. 
• Fix the landing pages 
associated with campaings 
bringing in lots of users, but 
not converting 
• How your paid campaigns 
are working. 
• Campaigns that are bringing 
in lots of users, but not 
converting.
Keywords: Paid/Organic
Keywords: Paid/Organic 
DATA ACTION 
• Chech if you rank for 
keywords related to your 
products or services and, if 
not, fix that. 
• Make sure that the 
keywords that appear in this 
report are the ones you 
want to be associated with 
you and your content. 
• Which keywords are 
bringing you traffic. 
• Comparison between 
branded and not branded 
keywords
Social
Social 
DATA ACTION 
• Focus on social networks 
bringing the most to ROI. 
• Make better, more efficient 
data-driven decisions in 
your social media marketing 
programs, focusing on the 
most converting content. 
• Value of traffic coming from 
social sites. 
• Which social networks 
visitors are using to engage 
with your content. 
• How people interact with 
your website, based on 
where they came from.
Search Engine Optimization
Search Engine Optimization 
DATA ACTION 
• Impressions (times any URL 
of your site appeared in 
Google) and average 
position of the words and 
phrases that your visitors 
have used to find your 
website. 
• Keyword discovery for paid 
campaigns (but be careful to 
not cannibalize your own free 
traffic). 
• Increase the number of clicks 
improving your copy and 
shoot for a click-through rate 
of at least 20% on keywords 
that are getting the biggest 
number of impressions.
What they do once they got on 
the website? 
Behaviour
Site Content: All Pages
Site Content: Content Drilldown
Site Content: Landing Pages
Site Content: Exit Pages
Site Content 
DATA ACTION 
• How your single pages are 
performing. 
• How different types of 
content are performing. 
• Identify and improve the 
copy and the design of the 
low-performing pages. 
• Grow the traffic to high 
converting landing pages.
Site Speed
Site Speed 
DATA ACTION 
• How fast are the pages in 
your website. 
• Increase the speed of very 
slow pages. 
Remember: tolerance for waiting on the Internet is super low: 
it’s too easy to go somewhere else. 
Your speed is closely correlated with your revenue.
Site Search
Site Search: Search Terms
Site Search 
DATA ACTION 
• What people are looking 
for in your website. 
• Make sure that people find 
what they are looking for, 
and easliy. 
Remember: Every time a visitor enter a keyword, 
he’s telling you exactly what he wants 
to find on your website.
In-Page Analytics
In-Page Analytics 
DATA ACTION 
• If users are not clicking 
where you want, test 
different design and copy of 
your pages. 
? 
• How visitors navigate on a 
given website page (where 
they click)?
Did they do what you wanted 
them to do? 
Conversions
Goals
Goals: Reverse Goal Path
Goals: Goal Flow
Goals 
DATA ACTION 
• Number of completions for 
each goal you set up. 
• What is the path to the 
conversion. 
• How much traffic is 
dropping off at each funnel 
step. 
• Identify unexpected exits 
from a step in the middle of 
the funnel. 
• Minimize the number of exit 
points in your funnel. 
• Focus on the most 
converting segments of 
traffic.
Ecommerce Report 
PRODUCTS TRANSACTIONS TIME TO PURCHASE 
The number of days 
and number of 
sessions it takes to 
purchase, starting 
from the most 
recent campaign 
through the 
completed 
transaction. 
Which products 
users buy, in what 
quantity, and the 
revenue generated 
by those products. 
The revenue, tax, 
shipping, and 
quantity 
information for 
each transaction 
(purchased order).
Ecommerce Report 
DATA ACTION 
• Top performing products 
• Top performing sources. 
• How long it takes 
customers to make the 
decision to purchase, and 
how many sessions to your 
site it takes to induce them 
to purchase. 
• Trace transactions back to a 
specific campaign and adjust 
your budget, investing more 
in the most converting 
sources and investing less in 
the less converting ones. 
• Plan marketing activities 
based on the time to 
conversion.
Multi-Channel Funnel
Multi-Channel: Top Conversion Paths
Multi-Channel: Assisted Conversions
Multi-Channel: Assisted Conversions 
Assisted / Last Click or Direct Conversions 
=0 this channel functioned primarly as final conversion. 
=1 equally assist and final. 
>1 The greater the value, the greater the assist role.
Multi-Channel 
DATA ACTION 
• Number of conversions 
involving more than one 
touch point. 
• Which referrals contributed 
to the final conversion. 
• Full-referral path and what 
impact each referral has on 
the final conversion. 
• Differentiate your marketing 
strategy for the channels 
that assist and the channels 
that tend to lead to 
immediate conversion.
Attribution
Attribution 
DATA ACTION 
• How many conversions are 
attributed to each channel. 
• Valuate if all your marketing 
channels worth the effort. 
Problem: How much credit for conversions 
should be attributed to various touch points in conversion paths?
Attribution
KEEP CALM 
CAUSE 
IT’S JUST 
THE BEGINNING
Going Deeper
Be careful with averages 
The interesting thing about 
averages is that they hide 
the truth very effectively. 
Avinash Kaushik
Compare Metrics 
Sunday
Compare Similar Periods
Compare days of the week 
0 = Sunday 1 = Monday
Compare Hours of the Day
Compare Metrics to Site Average
Compare Conversion Rate to Geo 
If you have set up goal tracking, you can look at 
conversion rates by geographic location. This 
will tell you if there are particular countries or 
cities where interest in your products or 
services are greater than others. If your 
business has local branches or retail outlets, 
this information can help you forecast demand 
and identify promising new locations. 
Sessions
Compare Conversion Rate to Geo 
Conversions
Compare Email to Demographic 
Demographic 
Email
To be continued…
Remember: include change in your strategy! 
Knowledge withouth action 
is meaningless. 
The real power of analytics 
Lies in what you do with the data. 
Brian Clifton
To learn more
Free Online Learning 
support.GA Help google.com/analytics/?hl=en#topic=3544906 
www.google.com/intl/en/analytics/learn/ 
www.youtube.com/user/googleanalytics 
GA Training 
analyticsacademy.withgoogle.com/explorer/ 
GA Academy 
GA Conversion University 
GA Youtube Channel 
www.youtube.com/user/ConversionUniversity
Blogs 
Official Google Analytics Blog 
http://analytics.blogspot.com/ 
Occam’s Razor, Avinash Kaushik 
www.kaushik.net/avinash/ 
Measuring Success, Brian Clifton 
www.advanced-web-metrics.com/blog/
Book #1 (technical) 
Advanced Web Metrics 
with Google Analytics 
Brian Clifton
Book #2 (less technical) 
Web Analytics 2.0 
Avinash Kaushik
Tools 
Google Tag Assistant 
Page Analytics
Doubts? 
Contact me! 
lorenzonif@gmail.com 
@FrancescaLor

Google Analytics 101

  • 1.
    Google Analytics 101 Francesca Lorenzoni September 16, 2014 Start-up Chile Academy, CMI, Santiago
  • 2.
    Google Analytics 101 • Why Analytics • Google Analytics Step by Step • Who are the people who visit my website? • What brought visitors to your site? • What they do once they got on the website? • Did they do what you wanted them to do? • Going Deeper • To Learn More
  • 3.
  • 4.
    Web Analytics: Definition (1) the analysis of qualitative and quantitative data from your website and the competition, (2) to drive a continual improvement of the online experience that your customers, and potential customers have, (3) which translates into your desired outcomes (online and offline). *by Avinash Kaushik
  • 5.
    Web Analytics: Definition (1) the analysis of qualitative and quantitative data from DATA your website and the competition, (2) to drive a continual improvement of the online experience that your customers, and potential customers have, (3) which translates into your desired outcomes (online and offline).
  • 6.
    Web Analytics: Definition (1) the analysis of qualitative and quantitative data from DATA your website and the competition, (2) to drive a continual improvement of the online experience ACTION that your customers, and potential customers have, (3) which translates into your desired outcomes (online and offline).
  • 7.
    Web Analytics: Definition (1) the analysis of qualitative and quantitative data from DATA your website and the competition, (2) to drive a continual improvement of the online experience ACTION that your customers, and potential customers have, (3) which translates into your desired outcomes (onlineR aEnSd UofLfliTneS) .
  • 8.
    Why you NEEDAnalytics? Web Analytics is the foundation for running a successful website. Without it, you are flying blind. Brian Clifton
  • 9.
    Who Can UseAnalytics? Executives can learn: • Which marketing initiatives are most effective • Which customer and customer segments are most valuable Marketers can learn: • Where users come from and what do they do on the site • How can the website convert more users into customers • Which keywords resonate with prospects and lead to conversions • Which online ad or creative is the most effective Content Creators can learn: • Where people leave the site • Which pages retain users the longest
  • 10.
    Most Important Step:Identifying Goals A goal is the reason why you put up a website in the first place. Think of a goal as specific and measurable actions that you want your visitors to complete before they leave your website.
  • 11.
    Examples • Visitorsdownloading a document • Visitors completing a contact form • Visitors completing a purchase • Visitors who spend more than 5 min on the website (engagement) • “Negative goals”: #of zero search results • ….
  • 12.
    Why Google Analytics • Free • Easy to integrate in your website • Easy to read reports • Real-time reports • Custom reports
  • 13.
    Limits of GoogleAnalytics GA is not perfect: there are some errors. But while the numbers aren’t exact, the data is still very useful. Analytics is about identifying trends, not about getting hung up on precise numbers.
  • 14.
  • 15.
  • 16.
    Standard Report Asession is a group of interactions that take place on your website within a given time frame. There are two methods by which a session ends: Time-based expiry (including end of day): after 30 minutes of inactivity or at midnight Campaign change: if a user arrives via one campaign, leaves, and then comes back via a different campaign.
  • 17.
    Standard Report Howmany users viewed or interacted with your content within a specific date range.
  • 18.
    Standard Report Apageview is an instance of a page being loaded by a browser. The Pageviews metric is the total number of pages viewed. Repeated views of a single page are also counted.
  • 19.
    Standard Report ThePages/Session metric displays the average number of pages viewed per session. Repeated views of a single page are counted in this calculation.
  • 20.
    Standard Report Averagesession duration is: total duration of all sessions (in seconds) number of sessions.
  • 21.
    Standard Report Bouncerate is the percentage of visits in which users view only a single page of your site.
  • 22.
    Standard Report %New Session is the percent of total users who came your site for the first time
  • 23.
  • 24.
    Your favourites, allin one page. Quick links. Out of the ordinary events Use intelligence to identify important changes and predict the future based on that information. What’s happening right NOW? Use real time reporting when you launch, announce something, to see if it’s working, and to test new campaigns, to ensure that tracking is ok.
  • 25.
    Who are thepeople who visit my website? What brought visitors to your site? What they do once they got on the website? Did they do what you wanted them to do?
  • 26.
    Who are thepeople who visit my website? Audience
  • 27.
  • 28.
    Demographics: age andgender DATA • Which age groups and gender visit your website. • Which age groups and gender are mostly likely to convert. ACTION • Target the most converting groups to increase the likelihood of making a conversion.
  • 29.
  • 30.
    Interests DATA ACTION • Affinity Category: potential customers, higher in the purchase funnel or near the beginning of the process. • In-Market Segment: users likely to be ready to purchase in the specified category, near the end of the purchase funnel. • Other Category: users who are not in those other categories. • Target ads based on the interest group that is mostly likely to convert. • Target your content toward the main interests of audiences that already come to your website.
  • 31.
  • 32.
  • 33.
  • 34.
    Geo: Language andLocation DATA ACTION • Check and improve the effectiveness of existing geotargeted campaigns. • Target the locations and languages of visitors most likely to convert. • Market Discovery. • Which language and location groups visit your website. • Which language and location groups are mostly likely to convert.
  • 35.
  • 36.
    Behaviour: Frequency &Recency Count of sessions
  • 37.
    Behaviour: Frequency &Recency Days since last session
  • 38.
  • 39.
    Behaviour: New vsReturning DATA ACTION • If returning visitors are more likely to convert, get first-time visitors back onto the website by having them subscribe or remarketing them. • If new visitors are more likely to convert, aim for conversion optimization strategies that grab people on their first visit. • Which between new and returning visitors are mostly likely to convert. • How and when people return to the website. • Engagement with the website.
  • 40.
  • 41.
    Technology DATA ACTION • Fix any problem that some browsers could have. • Check constantly if the website is working well in the top three browsers the visitors use. • What are the browsers with problems. • What are the most used browsers.
  • 42.
  • 43.
    Mobile Report DATAACTION • Focus your effort on target the devices converting more. • Is it time to create an app? • The percentage of visits from mobile, tablet and desktop. • Whick between mobile, table and desktop is more likely to convert.
  • 44.
  • 45.
    Users Flow DATAACTION • Identify and improve the pages on your website leading visitors to view even more pages. • Traffic patterns and flow (note: you can also highlight segments!) from the starting page through as many interactions users make or pages they view.
  • 46.
    What brought visitors to your site? Aquisition
  • 47.
    Channels ORGANIC SEARCHPAID SEARCH DIRECT Visitors from search engines. Visitors from paid search ads (AdWords…). Visitors without a traceable referral source (URL into the browser or bookmarks). REFERRAL SOCIAL OTHER Visitors from other websites. Visitors from social networks. Visitors from links with UTM parameters for custom campaign tracking.
  • 48.
    Url Builder www.analytics101.com/? utm_source=newsletter-06-2014&utm_medium=email&utm_term=analytics&ut m_content=version1&utm_campaign=startupchile
  • 49.
  • 50.
    Channels DATA ACTION • Invest more on the traffic sources that are bringing you more conversion. • Adjust the investments in the sources that are not bringing enough conversions. • Which are your top traffic sources. • Which traffic source convert more and which are not working good.
  • 51.
  • 52.
    All Traffic DATAACTION • Where most of your traffic comes from. • What is the engagement rate for each source. • What sources are bringing you converting visitors. • Changes in time (sudden drop or rise in traffic). • Improve your advertising efforts investing more in the converting sources.
  • 53.
  • 54.
    All Referrals DATAACTION • Identify your strongest and most influential brand advocates on Twitter / Pinterest /Blogs and build a relationship with them so that they continue to do so • Details about traffic from other websites. • Which tweets* / pins / Google images are driving the most traffic to your website. * Use this plugin: www.campalyst.com/plugin
  • 55.
  • 56.
    Campaigns DATA ACTION • Fix campaings with more spending than revenue. • Fix the landing pages associated with campaings bringing in lots of users, but not converting • How your paid campaigns are working. • Campaigns that are bringing in lots of users, but not converting.
  • 57.
  • 58.
    Keywords: Paid/Organic DATAACTION • Chech if you rank for keywords related to your products or services and, if not, fix that. • Make sure that the keywords that appear in this report are the ones you want to be associated with you and your content. • Which keywords are bringing you traffic. • Comparison between branded and not branded keywords
  • 59.
  • 60.
    Social DATA ACTION • Focus on social networks bringing the most to ROI. • Make better, more efficient data-driven decisions in your social media marketing programs, focusing on the most converting content. • Value of traffic coming from social sites. • Which social networks visitors are using to engage with your content. • How people interact with your website, based on where they came from.
  • 61.
  • 62.
    Search Engine Optimization DATA ACTION • Impressions (times any URL of your site appeared in Google) and average position of the words and phrases that your visitors have used to find your website. • Keyword discovery for paid campaigns (but be careful to not cannibalize your own free traffic). • Increase the number of clicks improving your copy and shoot for a click-through rate of at least 20% on keywords that are getting the biggest number of impressions.
  • 63.
    What they doonce they got on the website? Behaviour
  • 64.
  • 65.
  • 66.
  • 67.
  • 68.
    Site Content DATAACTION • How your single pages are performing. • How different types of content are performing. • Identify and improve the copy and the design of the low-performing pages. • Grow the traffic to high converting landing pages.
  • 69.
  • 70.
    Site Speed DATAACTION • How fast are the pages in your website. • Increase the speed of very slow pages. Remember: tolerance for waiting on the Internet is super low: it’s too easy to go somewhere else. Your speed is closely correlated with your revenue.
  • 71.
  • 72.
  • 73.
    Site Search DATAACTION • What people are looking for in your website. • Make sure that people find what they are looking for, and easliy. Remember: Every time a visitor enter a keyword, he’s telling you exactly what he wants to find on your website.
  • 74.
  • 75.
    In-Page Analytics DATAACTION • If users are not clicking where you want, test different design and copy of your pages. ? • How visitors navigate on a given website page (where they click)?
  • 76.
    Did they dowhat you wanted them to do? Conversions
  • 77.
  • 78.
  • 79.
  • 80.
    Goals DATA ACTION • Number of completions for each goal you set up. • What is the path to the conversion. • How much traffic is dropping off at each funnel step. • Identify unexpected exits from a step in the middle of the funnel. • Minimize the number of exit points in your funnel. • Focus on the most converting segments of traffic.
  • 81.
    Ecommerce Report PRODUCTSTRANSACTIONS TIME TO PURCHASE The number of days and number of sessions it takes to purchase, starting from the most recent campaign through the completed transaction. Which products users buy, in what quantity, and the revenue generated by those products. The revenue, tax, shipping, and quantity information for each transaction (purchased order).
  • 82.
    Ecommerce Report DATAACTION • Top performing products • Top performing sources. • How long it takes customers to make the decision to purchase, and how many sessions to your site it takes to induce them to purchase. • Trace transactions back to a specific campaign and adjust your budget, investing more in the most converting sources and investing less in the less converting ones. • Plan marketing activities based on the time to conversion.
  • 83.
  • 84.
  • 85.
  • 86.
    Multi-Channel: Assisted Conversions Assisted / Last Click or Direct Conversions =0 this channel functioned primarly as final conversion. =1 equally assist and final. >1 The greater the value, the greater the assist role.
  • 87.
    Multi-Channel DATA ACTION • Number of conversions involving more than one touch point. • Which referrals contributed to the final conversion. • Full-referral path and what impact each referral has on the final conversion. • Differentiate your marketing strategy for the channels that assist and the channels that tend to lead to immediate conversion.
  • 88.
  • 89.
    Attribution DATA ACTION • How many conversions are attributed to each channel. • Valuate if all your marketing channels worth the effort. Problem: How much credit for conversions should be attributed to various touch points in conversion paths?
  • 90.
  • 91.
    KEEP CALM CAUSE IT’S JUST THE BEGINNING
  • 92.
  • 93.
    Be careful withaverages The interesting thing about averages is that they hide the truth very effectively. Avinash Kaushik
  • 94.
  • 95.
  • 96.
    Compare days ofthe week 0 = Sunday 1 = Monday
  • 97.
  • 98.
    Compare Metrics toSite Average
  • 99.
    Compare Conversion Rateto Geo If you have set up goal tracking, you can look at conversion rates by geographic location. This will tell you if there are particular countries or cities where interest in your products or services are greater than others. If your business has local branches or retail outlets, this information can help you forecast demand and identify promising new locations. Sessions
  • 100.
    Compare Conversion Rateto Geo Conversions
  • 101.
    Compare Email toDemographic Demographic Email
  • 102.
  • 103.
    Remember: include changein your strategy! Knowledge withouth action is meaningless. The real power of analytics Lies in what you do with the data. Brian Clifton
  • 104.
  • 105.
    Free Online Learning support.GA Help google.com/analytics/?hl=en#topic=3544906 www.google.com/intl/en/analytics/learn/ www.youtube.com/user/googleanalytics GA Training analyticsacademy.withgoogle.com/explorer/ GA Academy GA Conversion University GA Youtube Channel www.youtube.com/user/ConversionUniversity
  • 106.
    Blogs Official GoogleAnalytics Blog http://analytics.blogspot.com/ Occam’s Razor, Avinash Kaushik www.kaushik.net/avinash/ Measuring Success, Brian Clifton www.advanced-web-metrics.com/blog/
  • 107.
    Book #1 (technical) Advanced Web Metrics with Google Analytics Brian Clifton
  • 108.
    Book #2 (lesstechnical) Web Analytics 2.0 Avinash Kaushik
  • 109.
    Tools Google TagAssistant Page Analytics
  • 110.
    Doubts? Contact me! lorenzonif@gmail.com @FrancescaLor