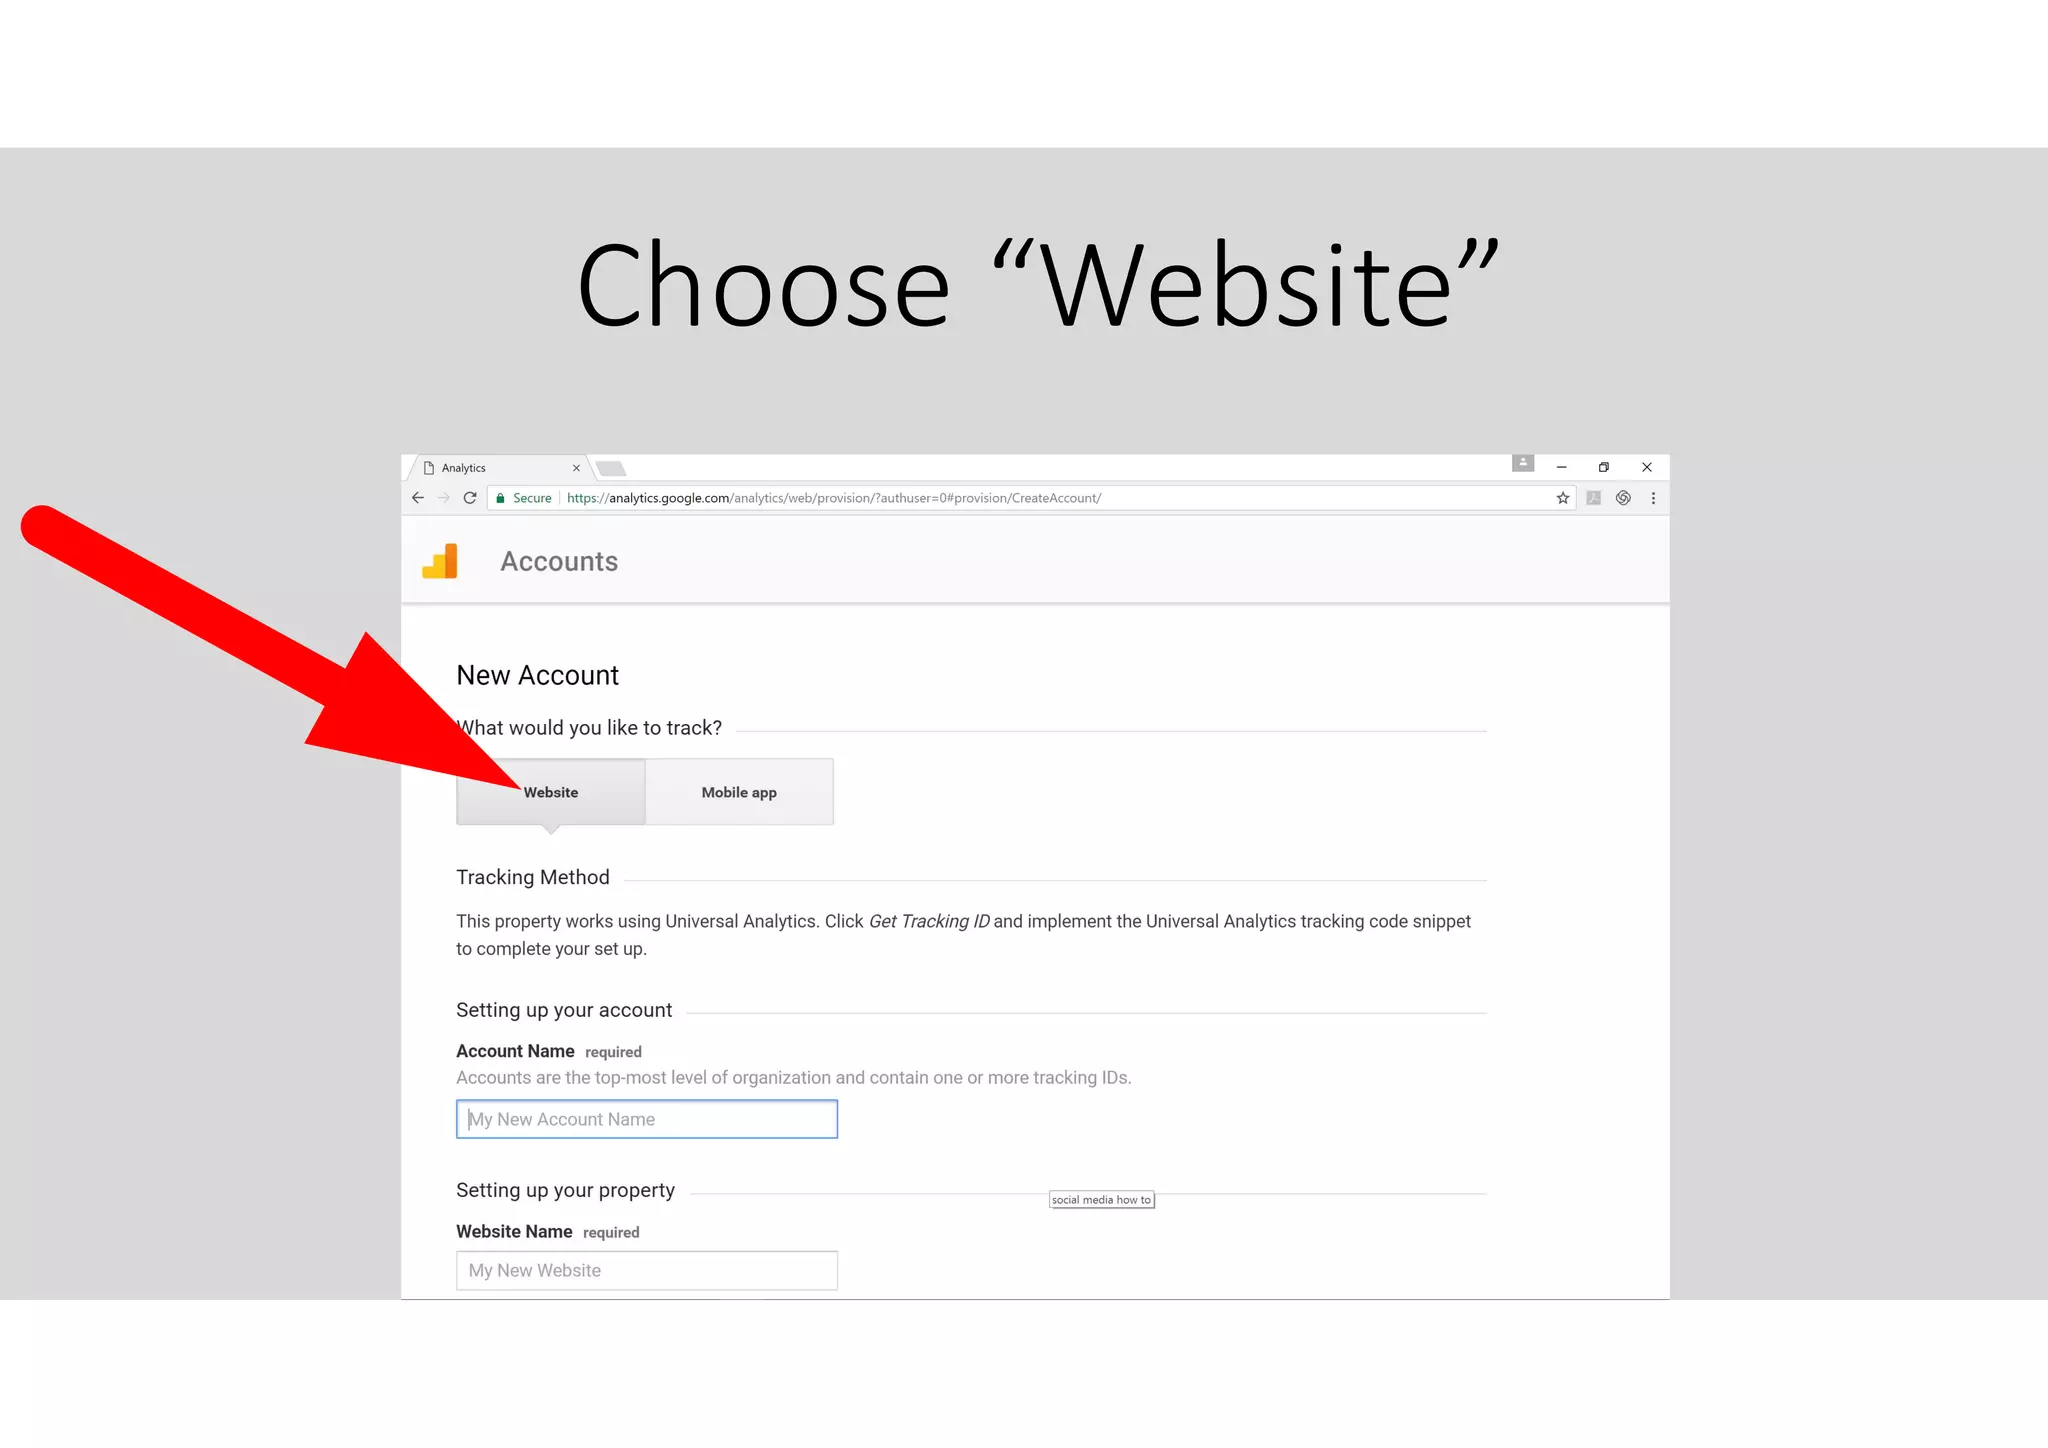
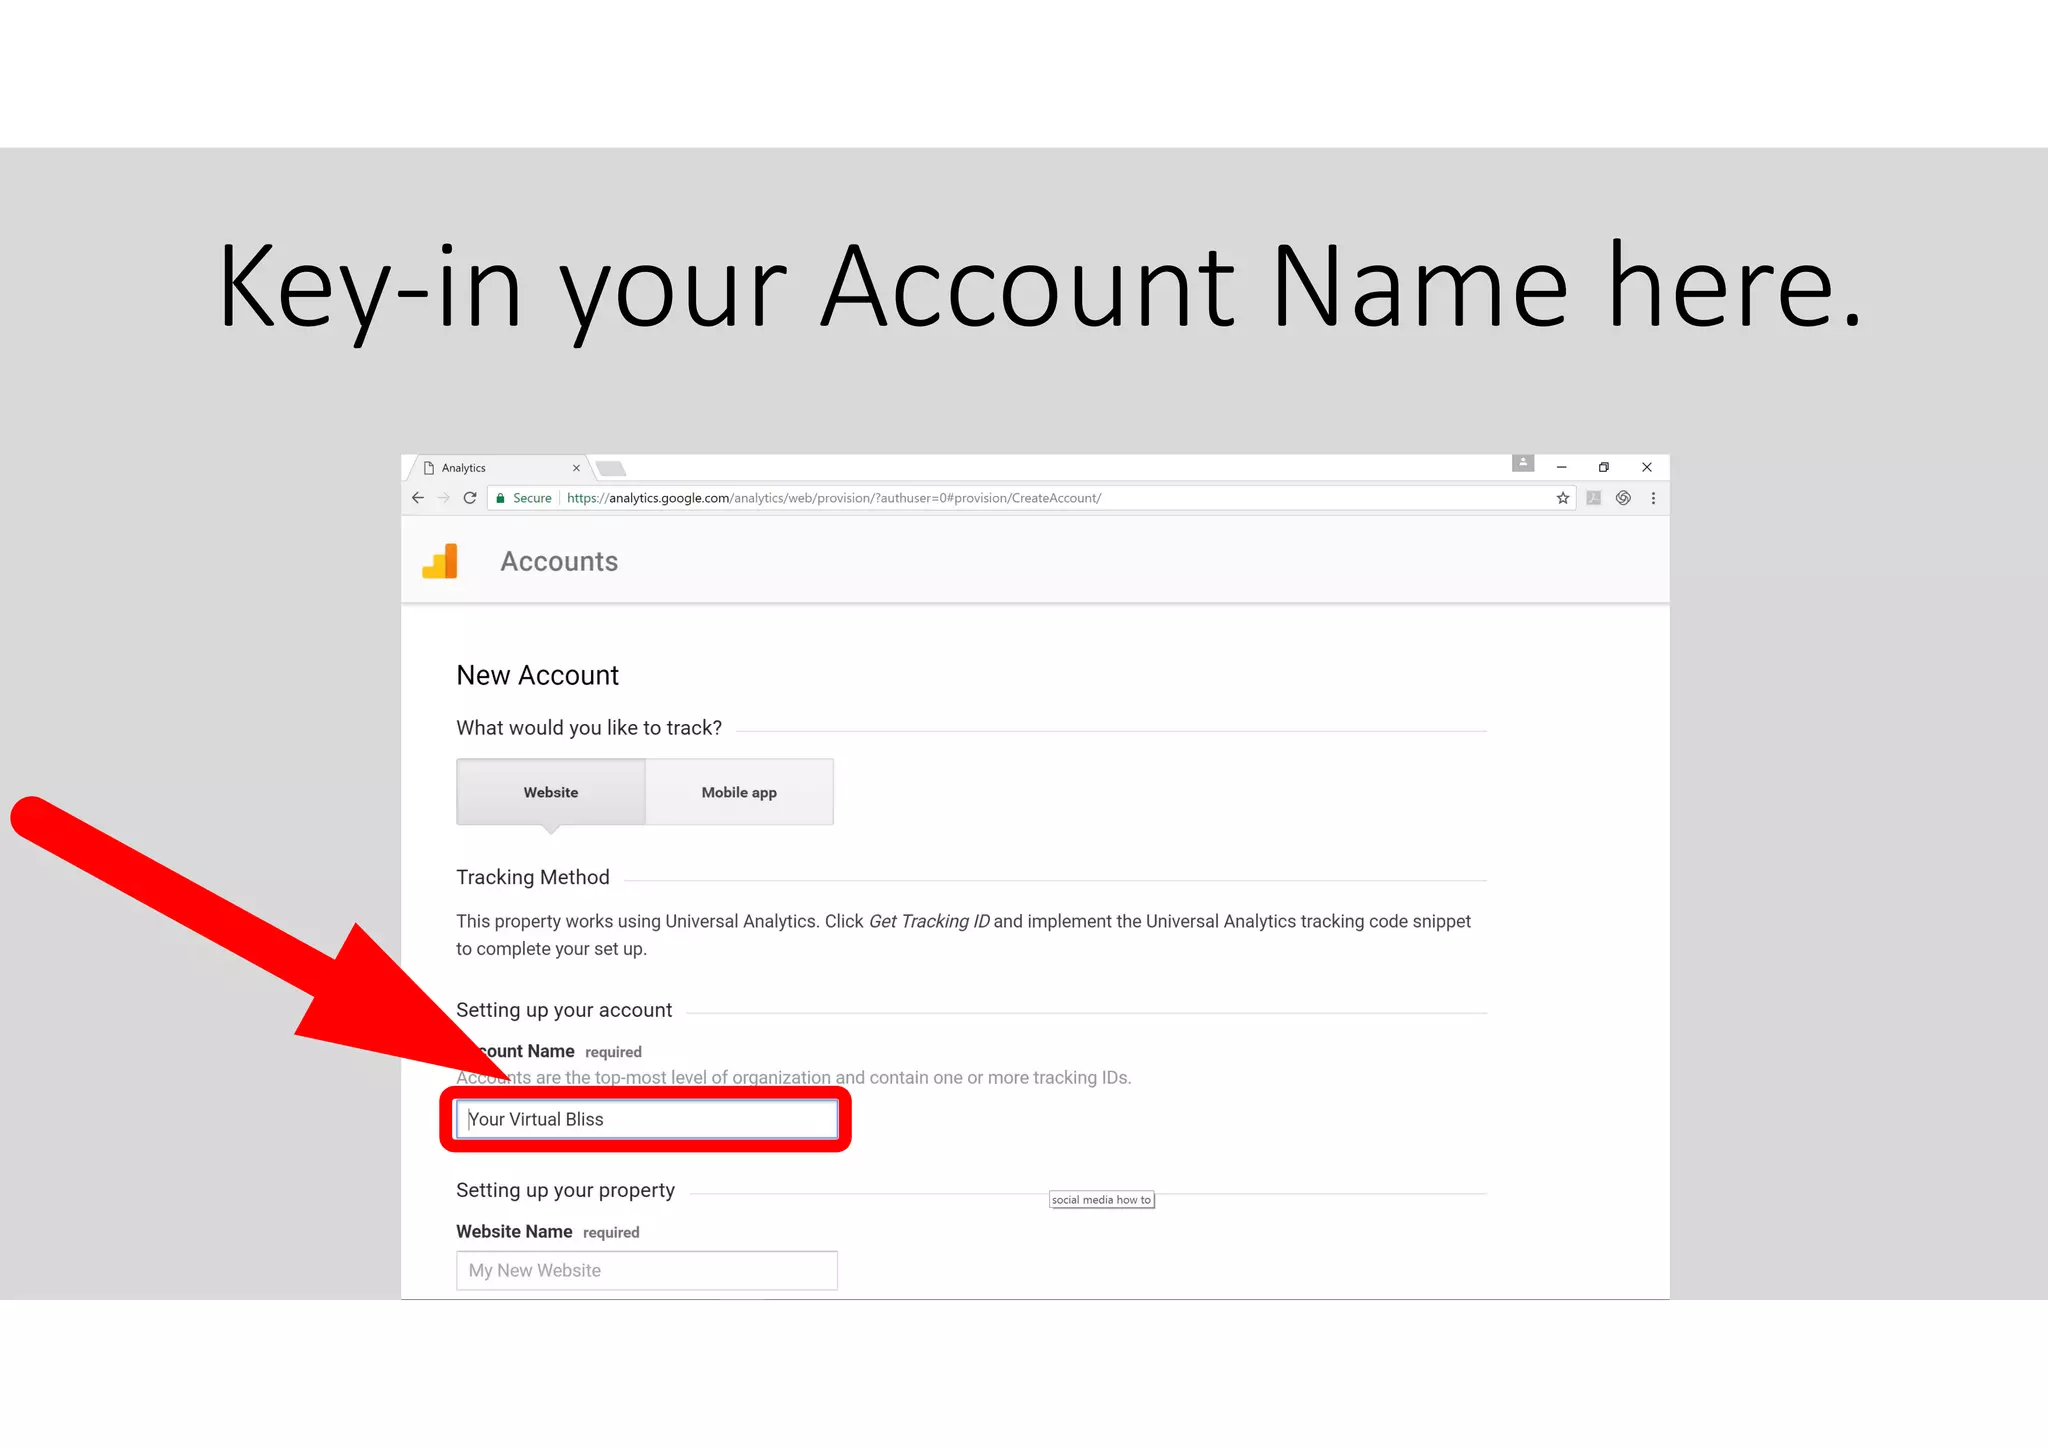
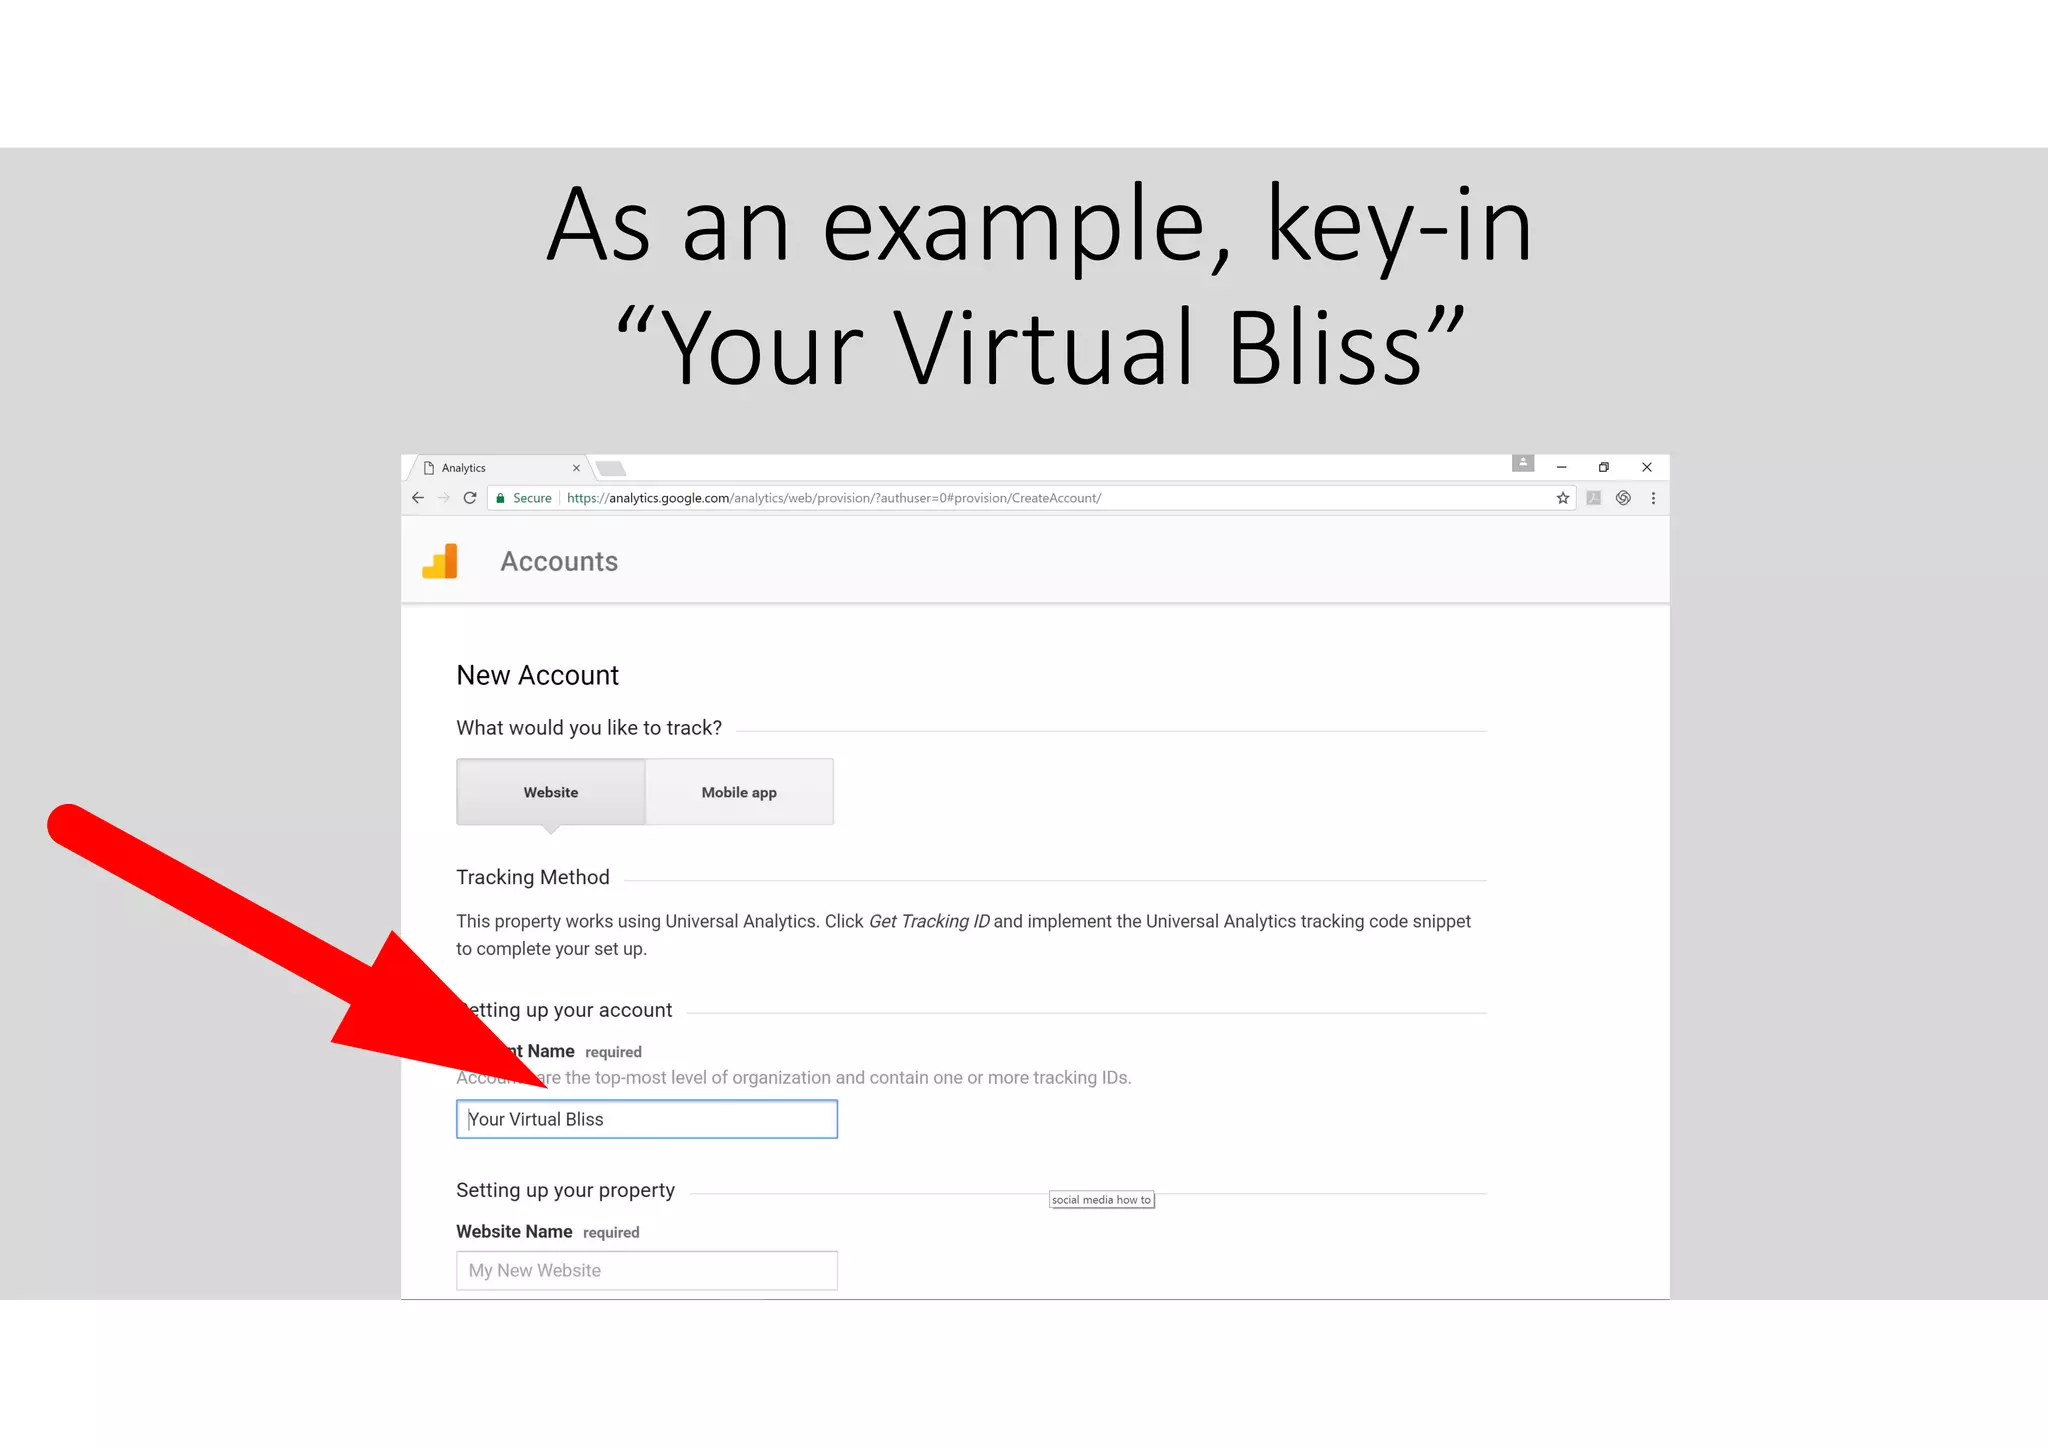
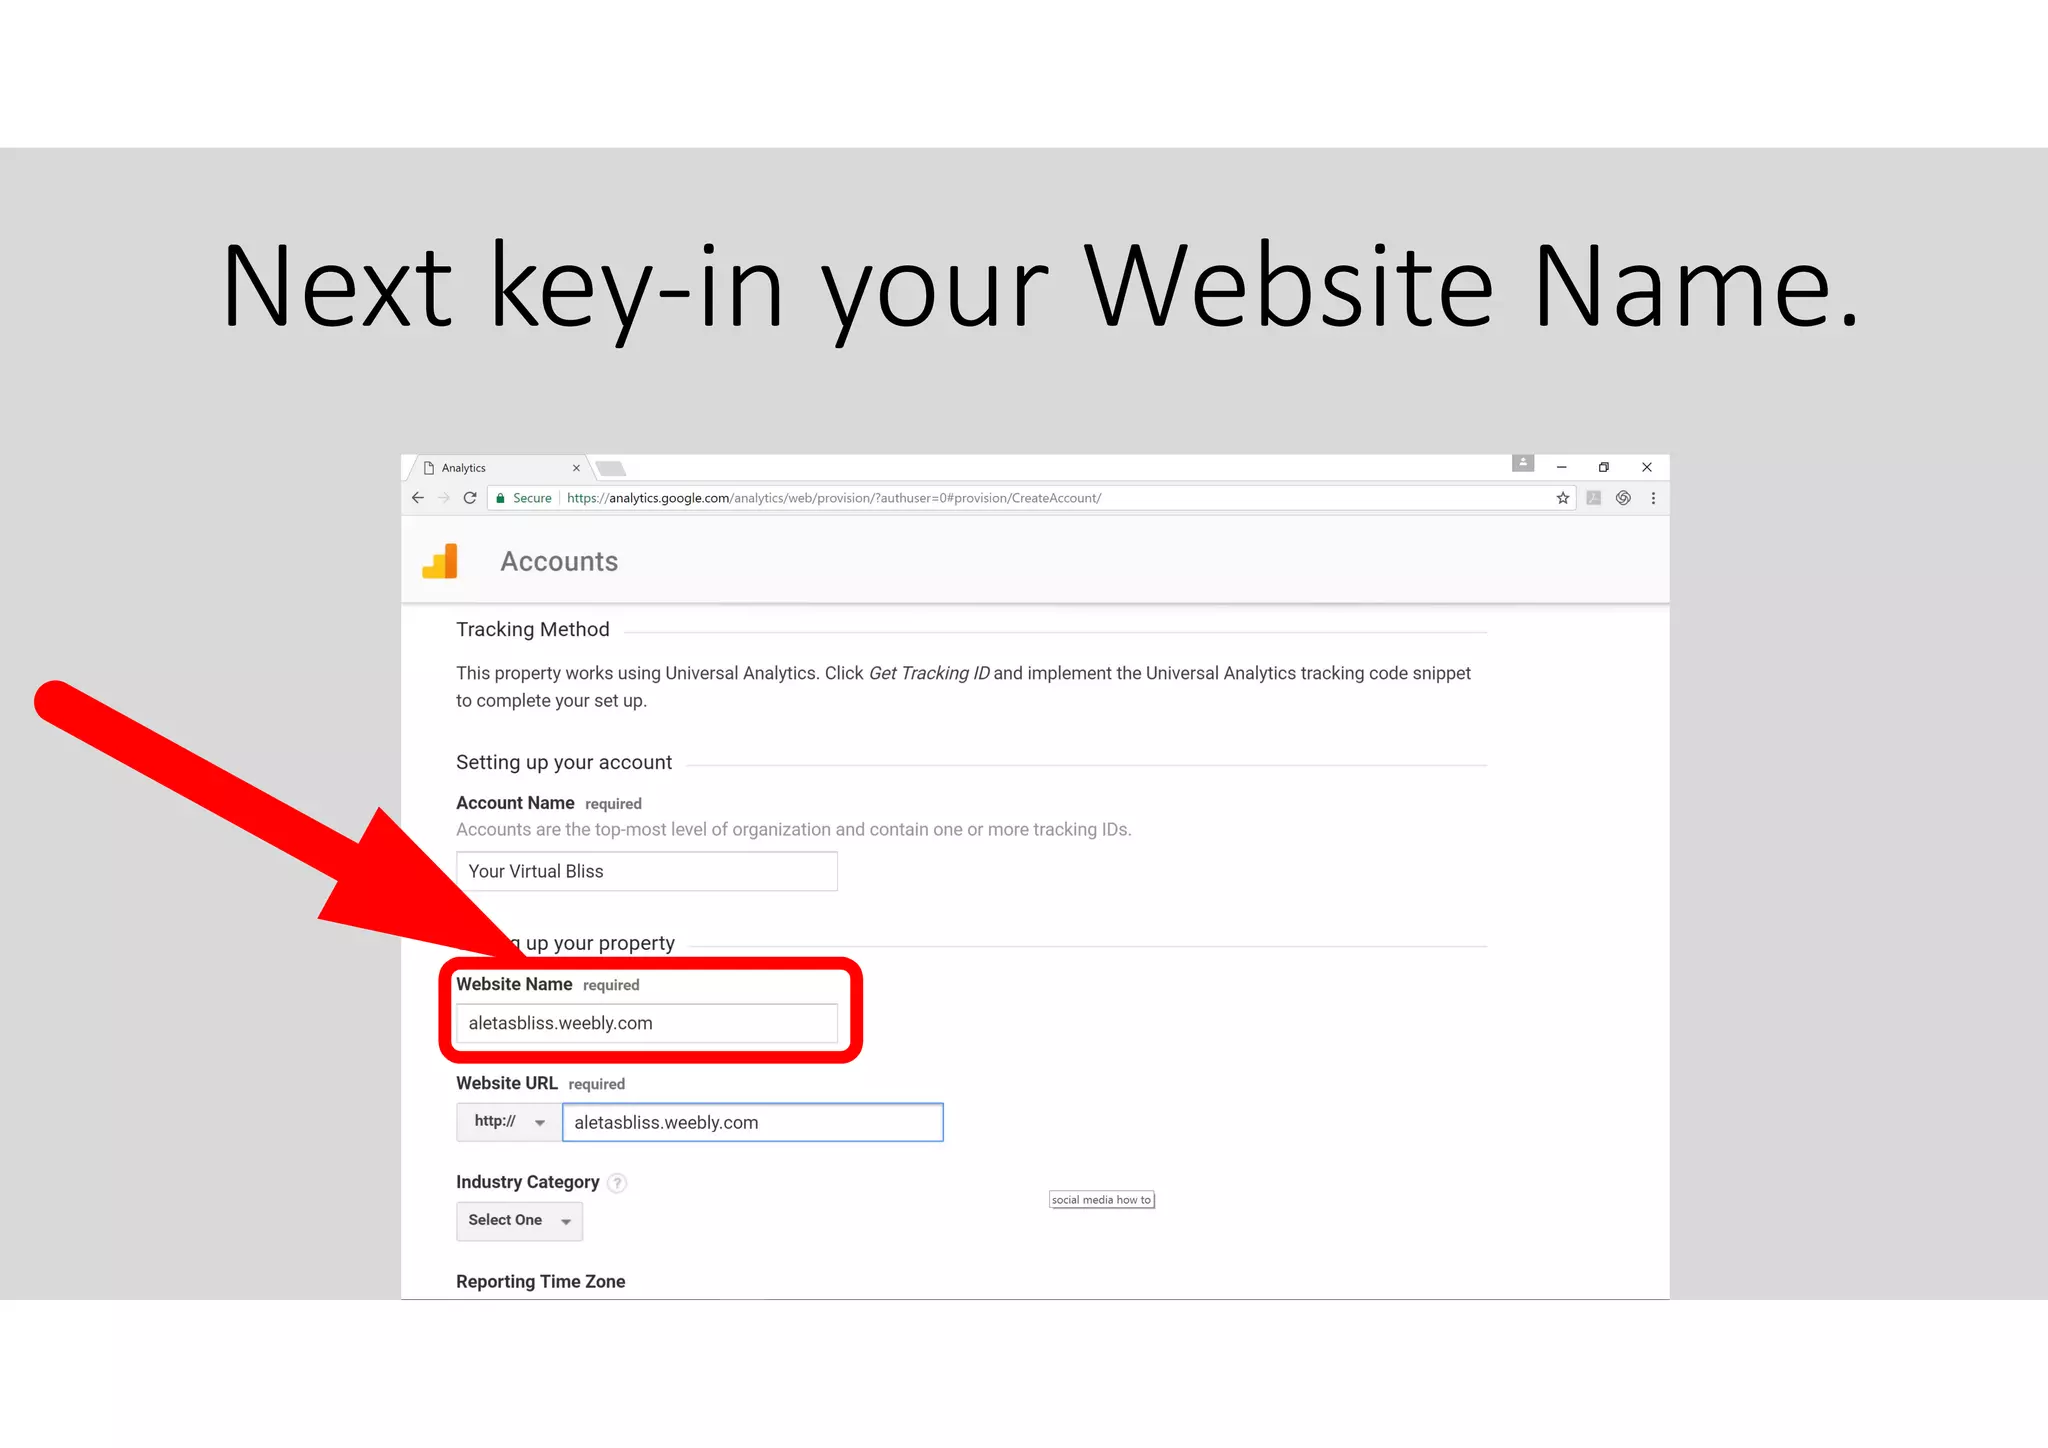
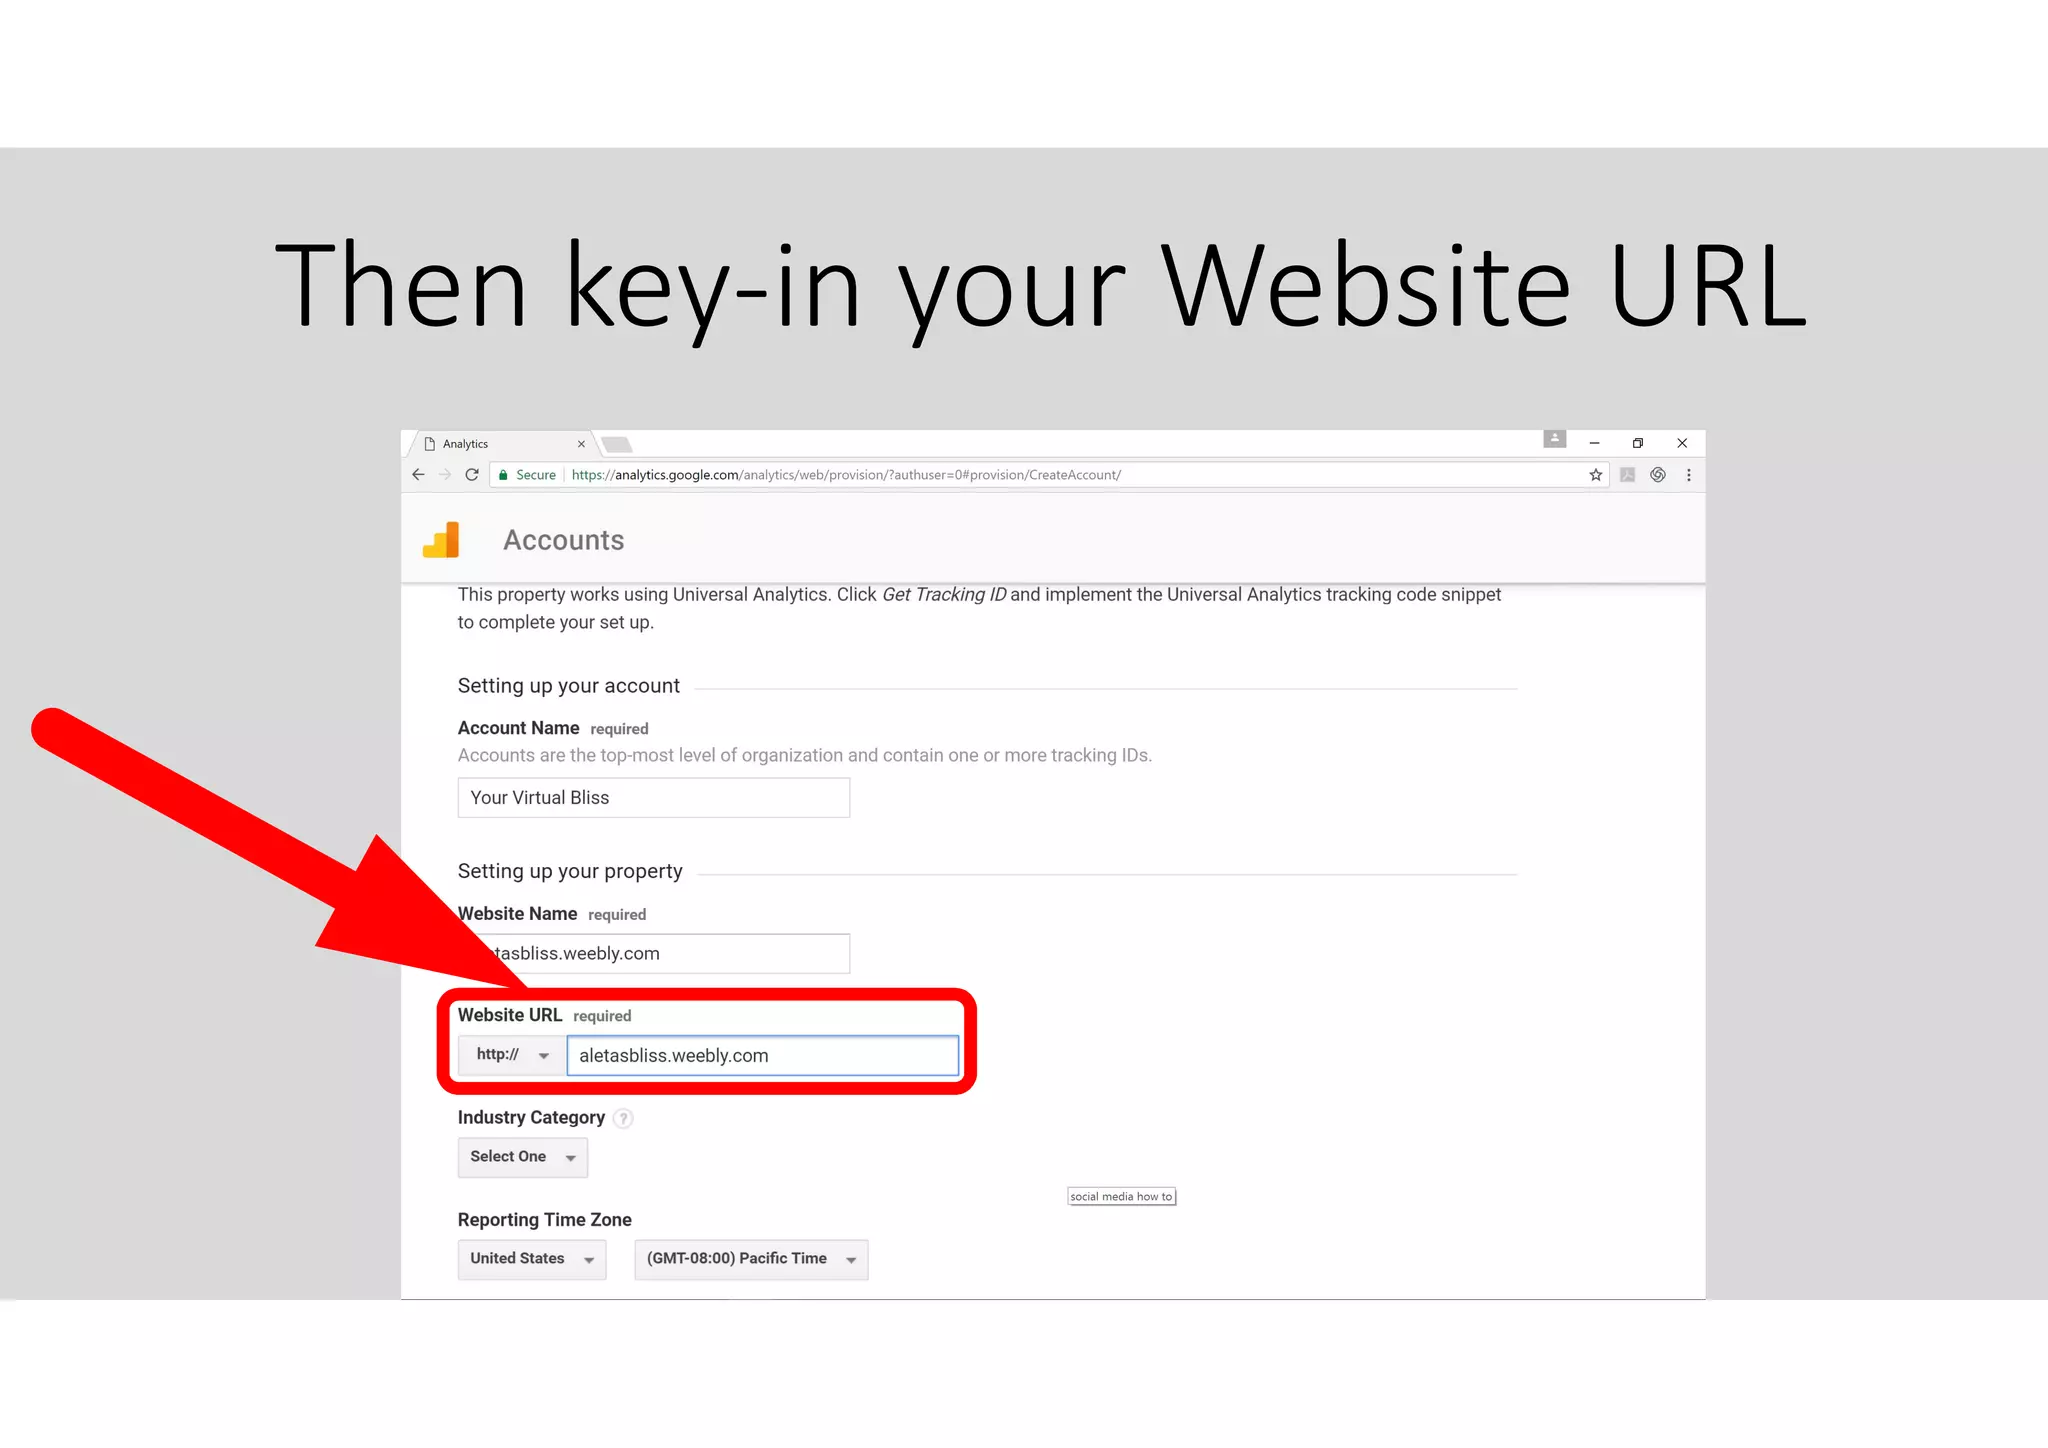
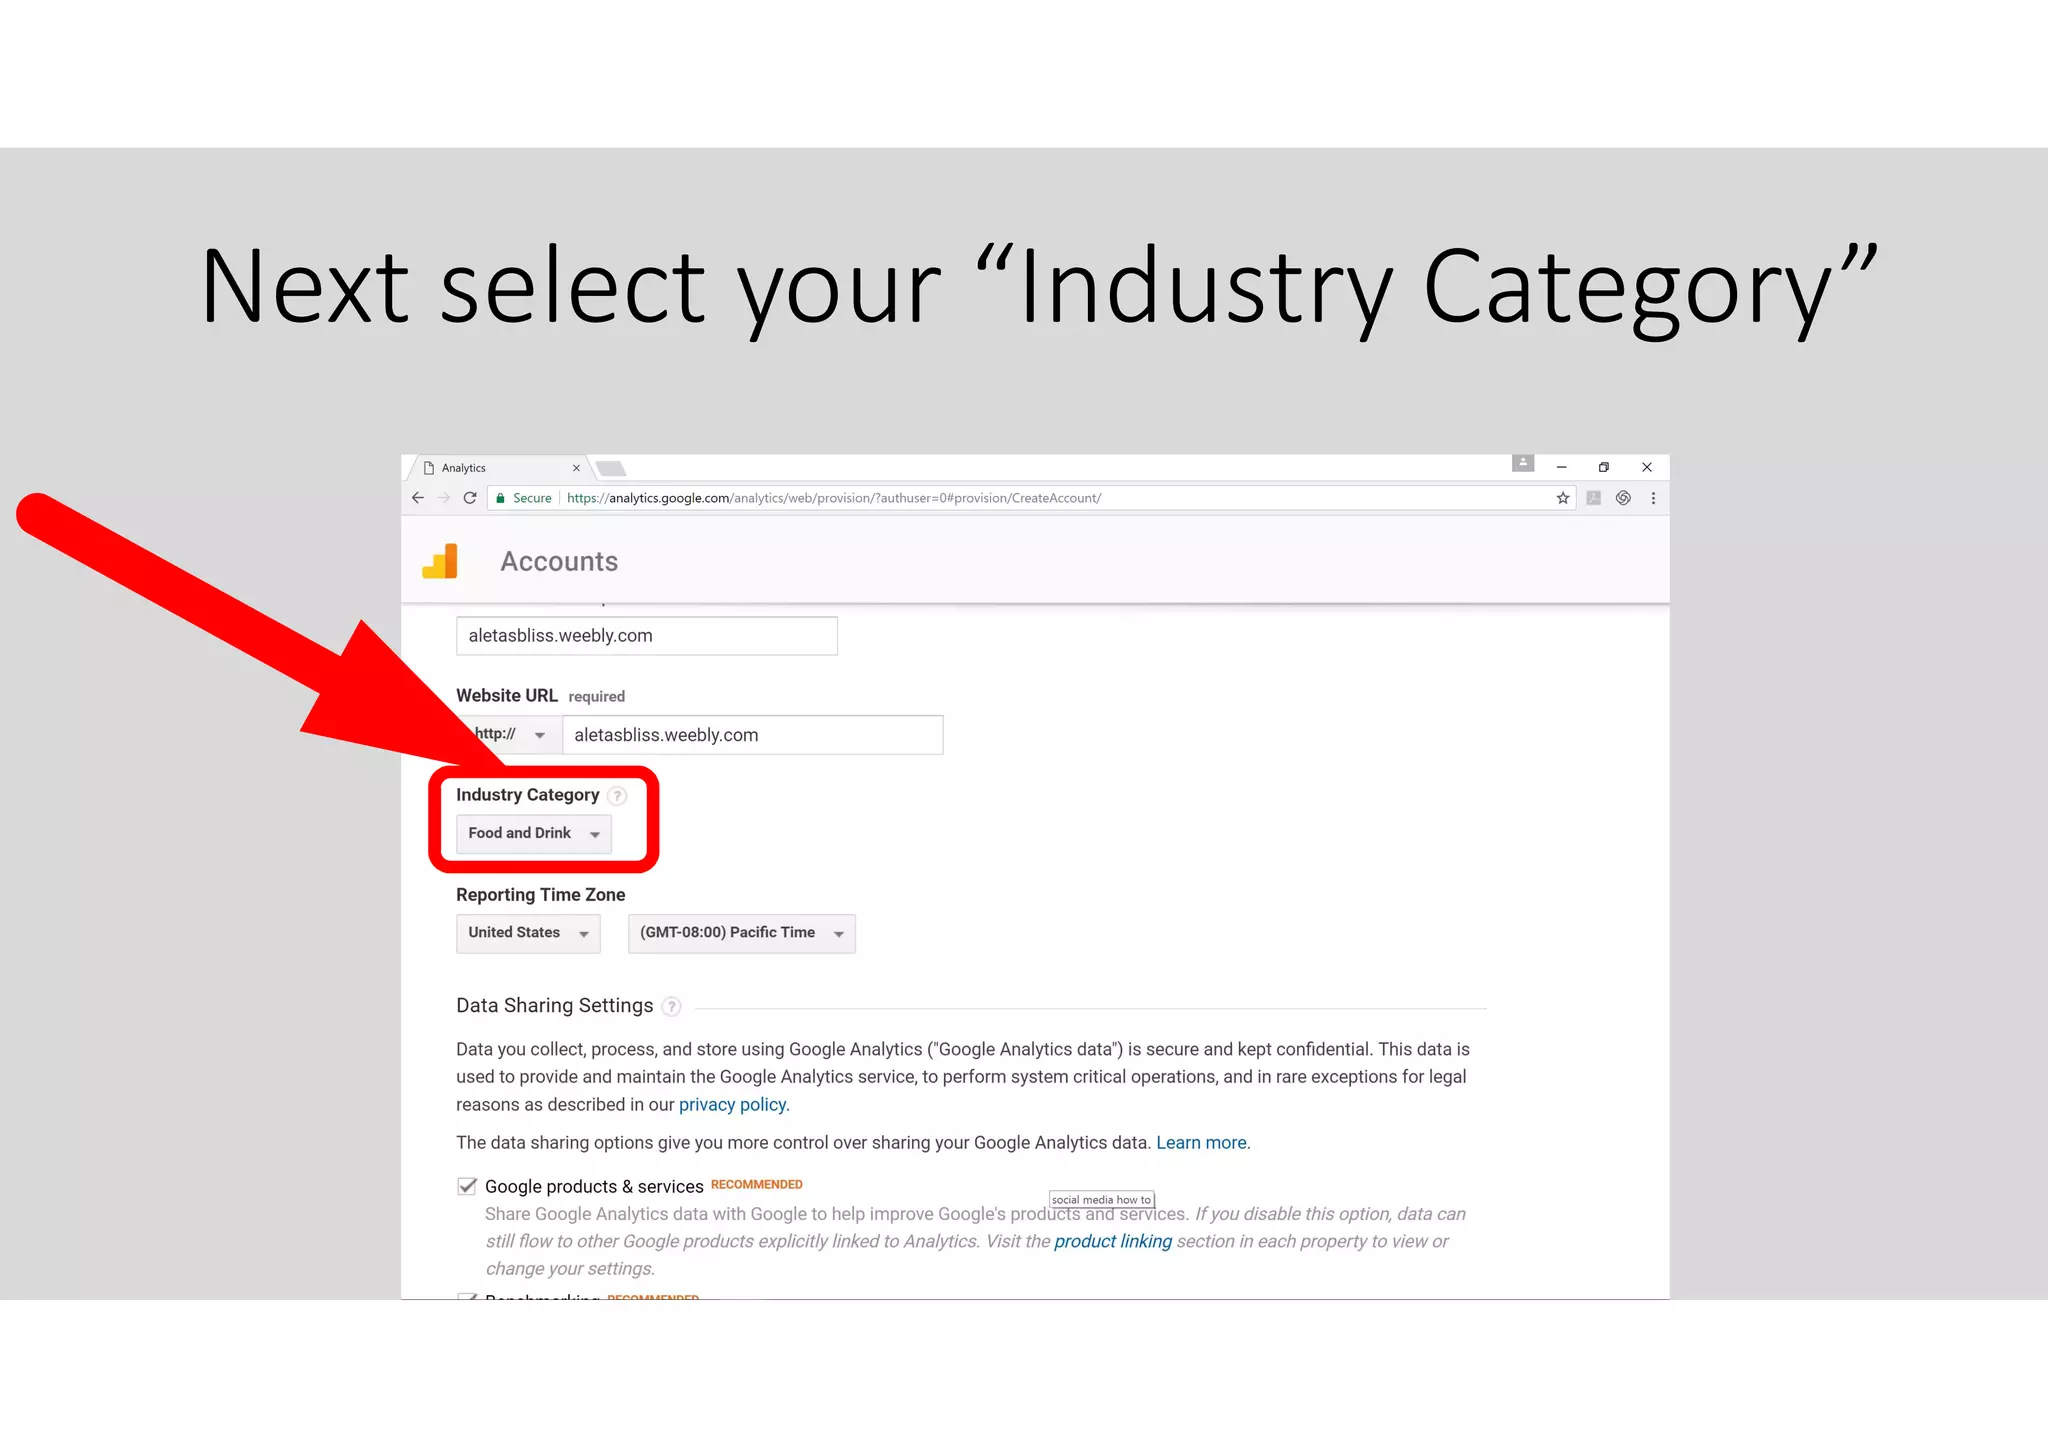
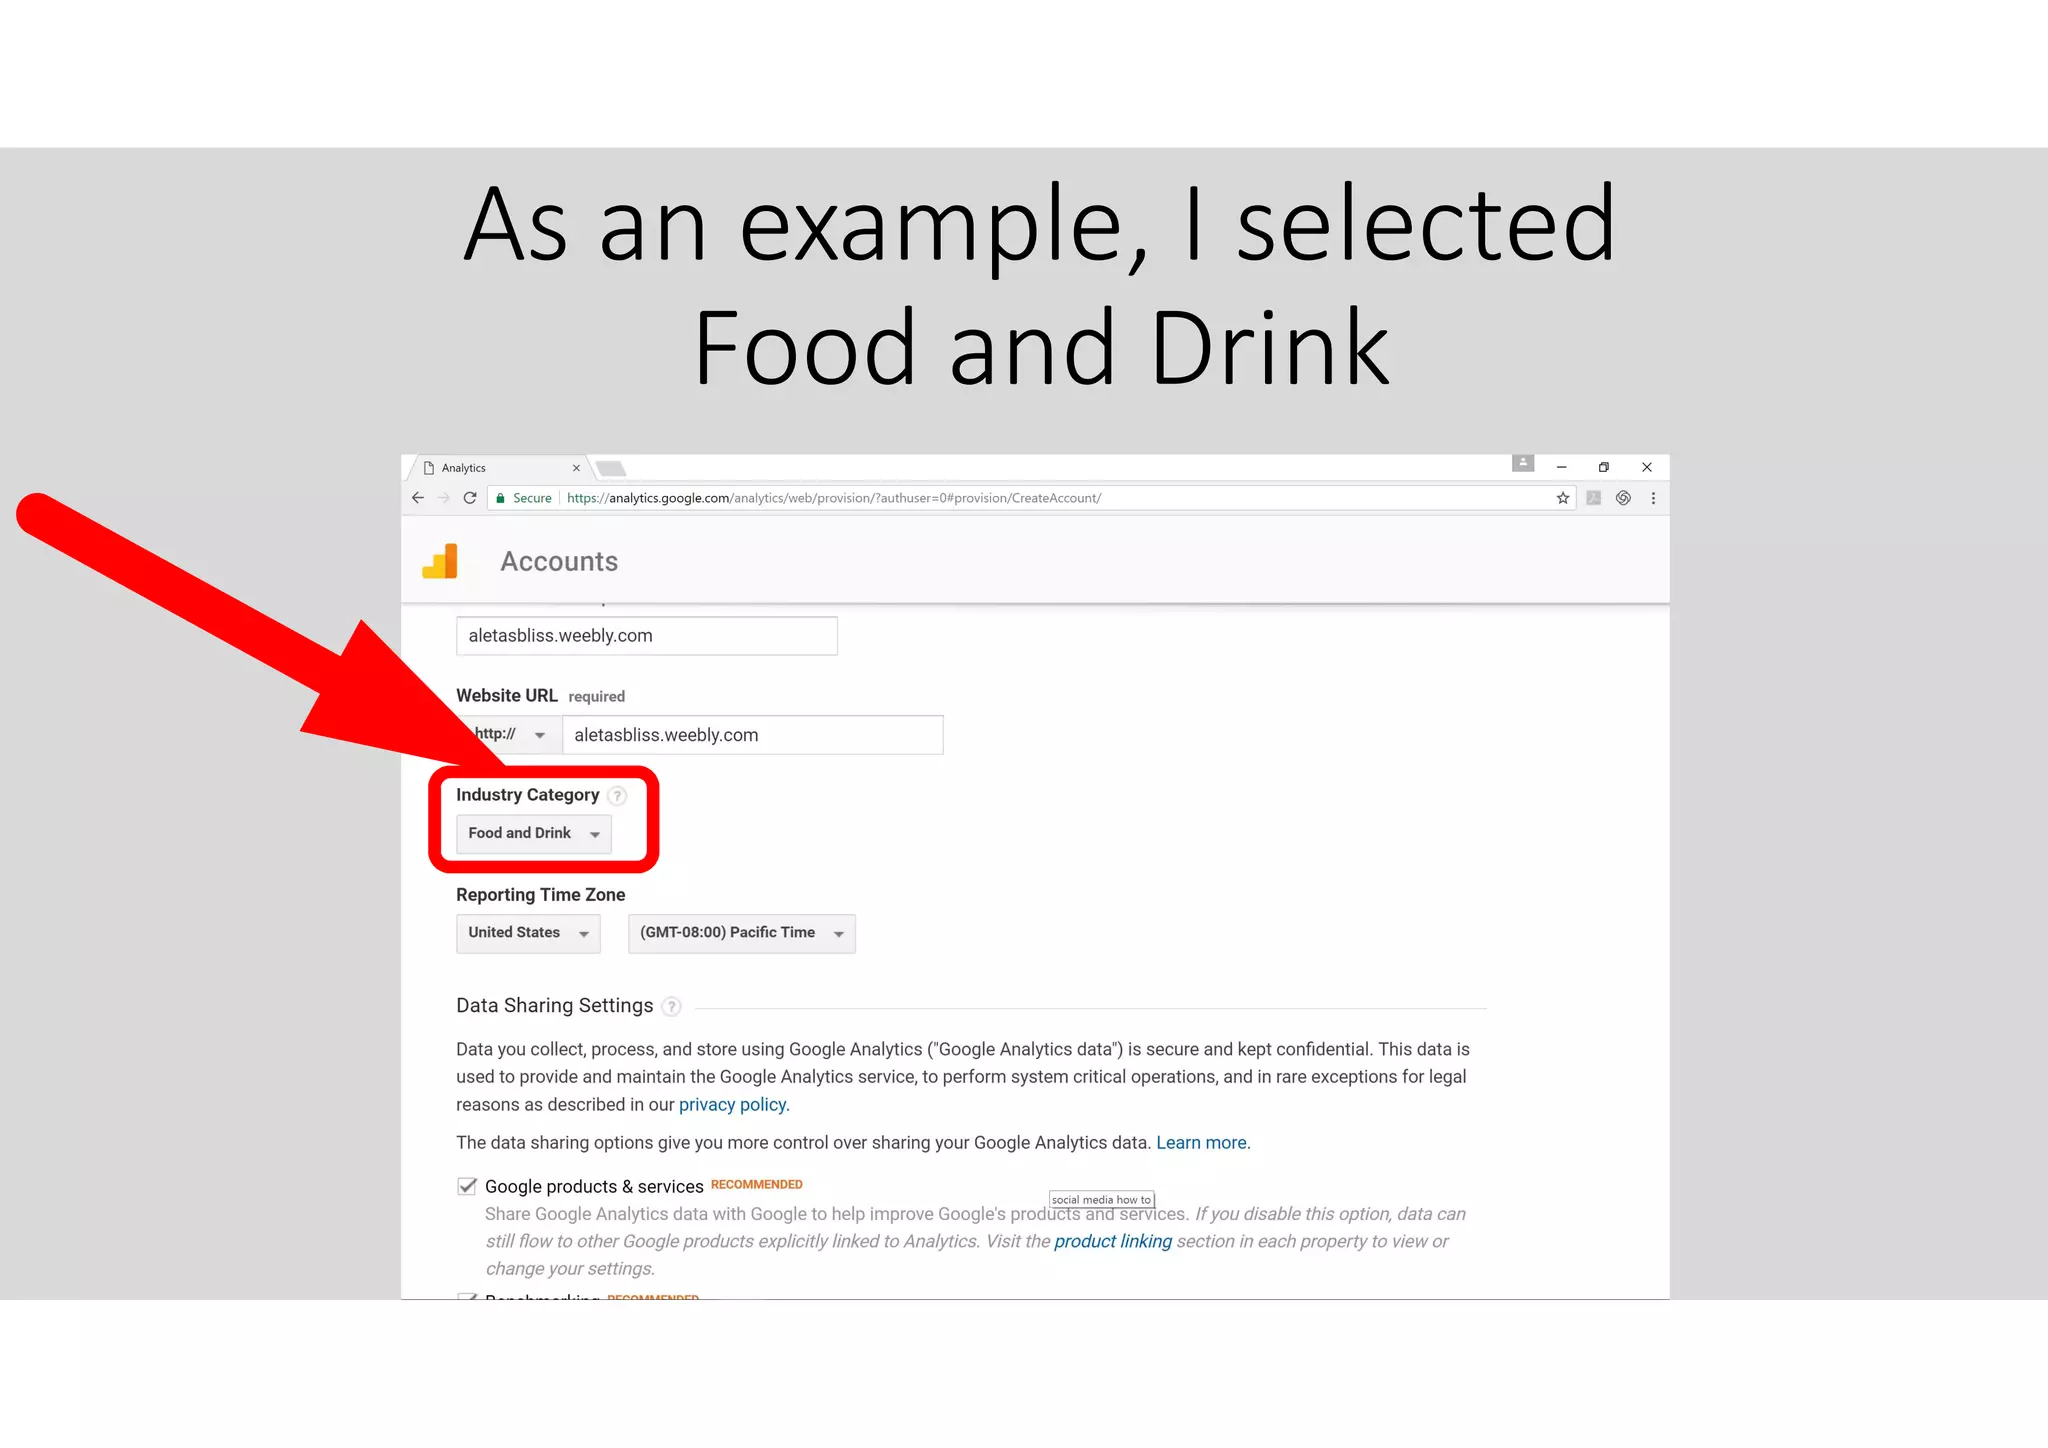
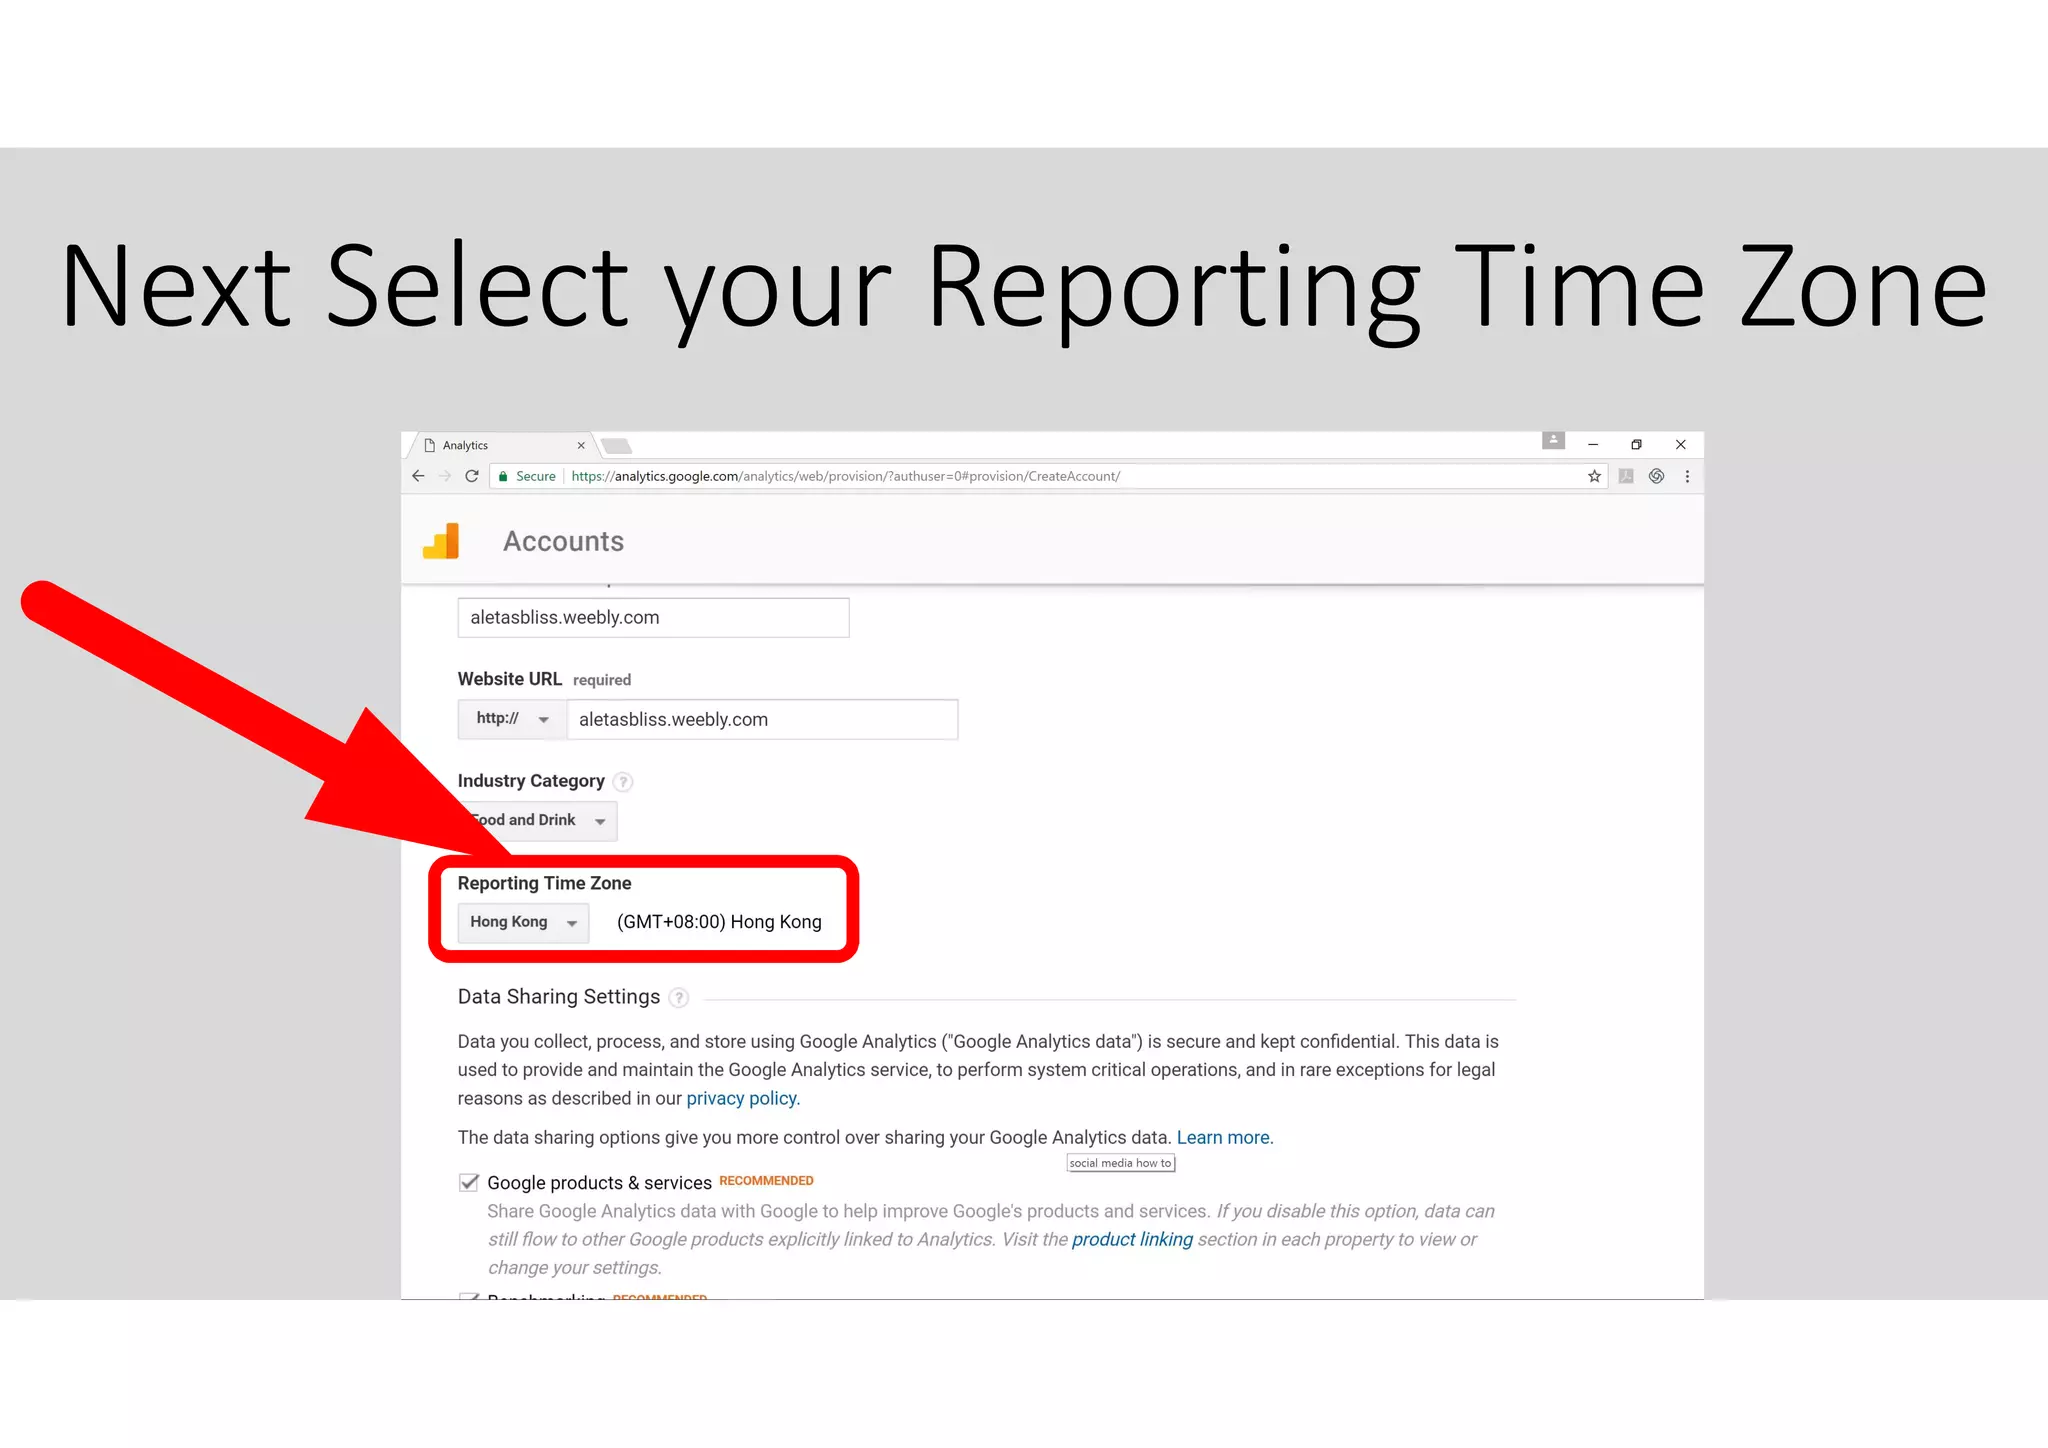
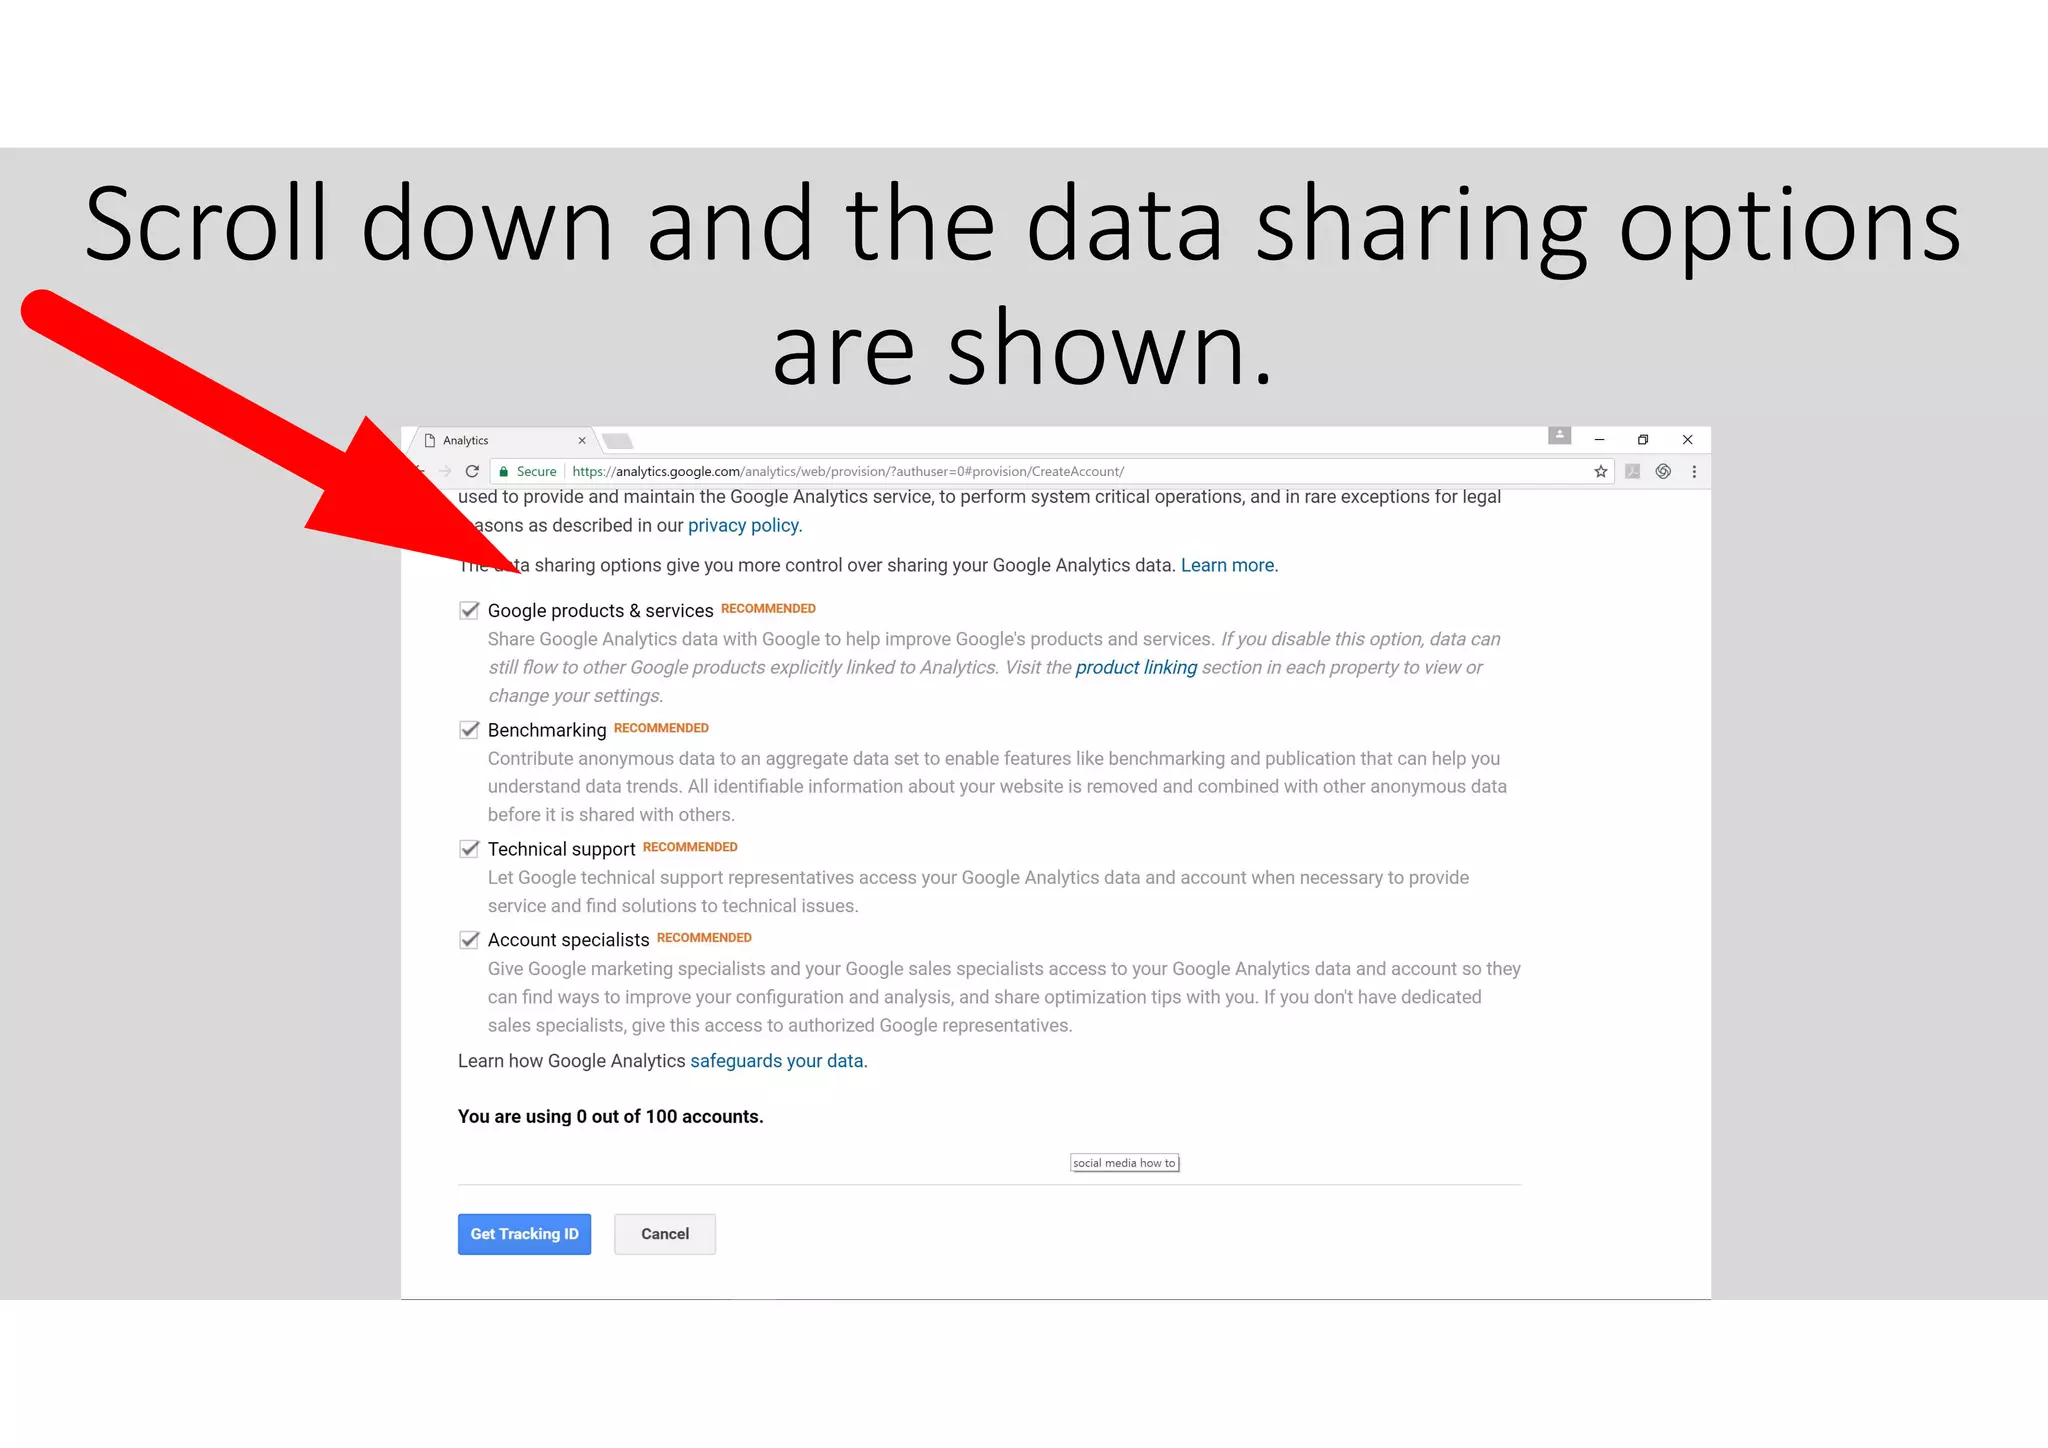
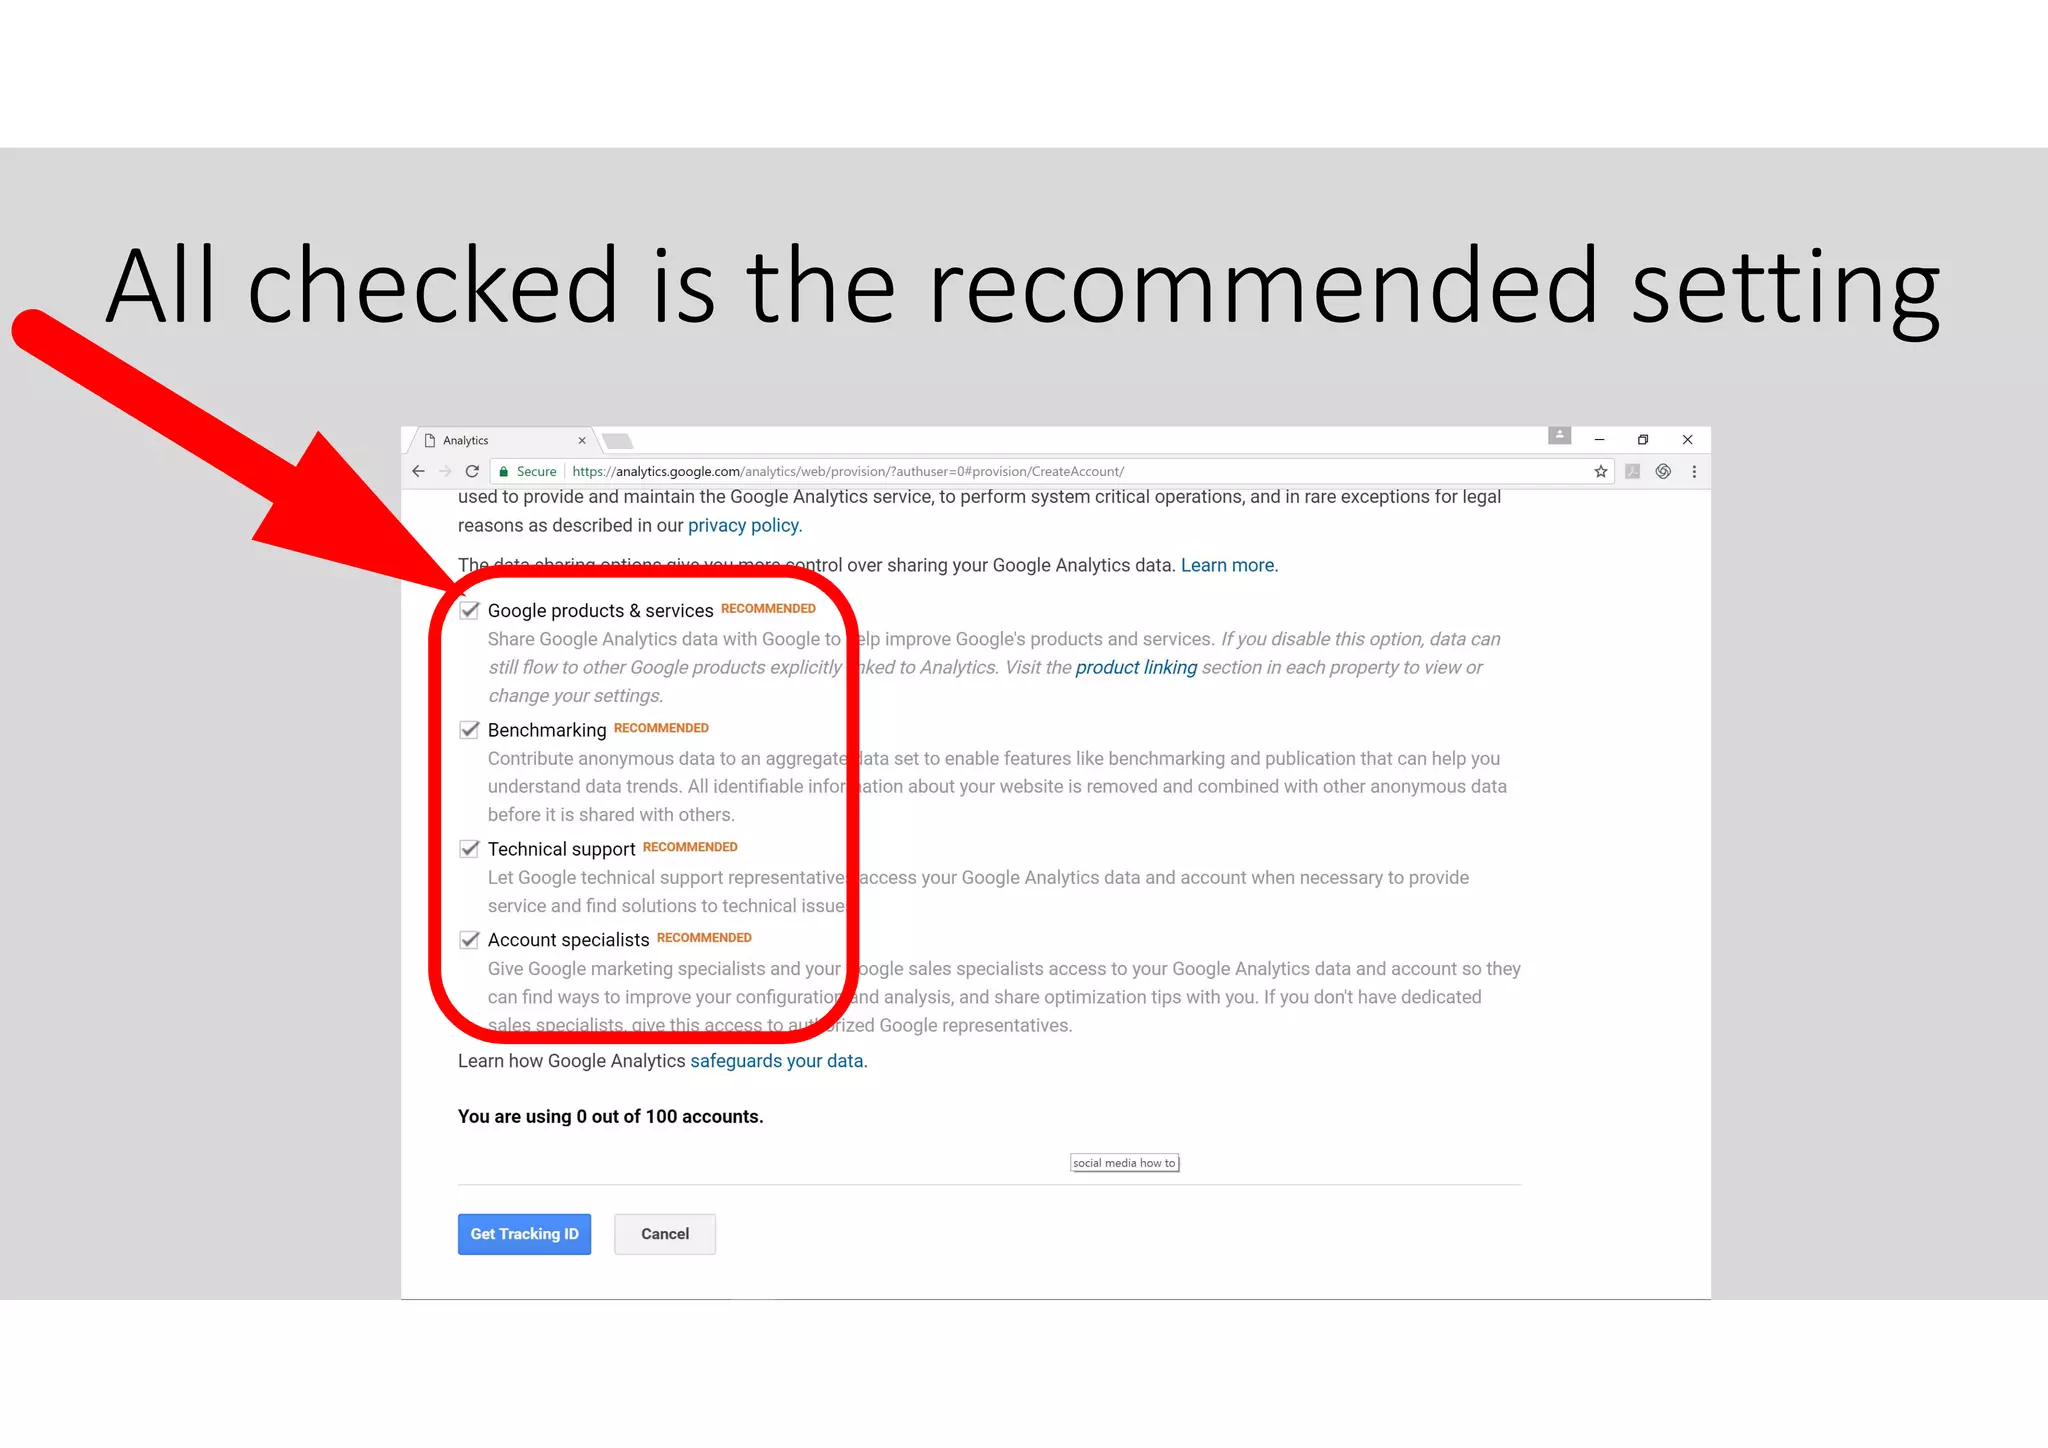
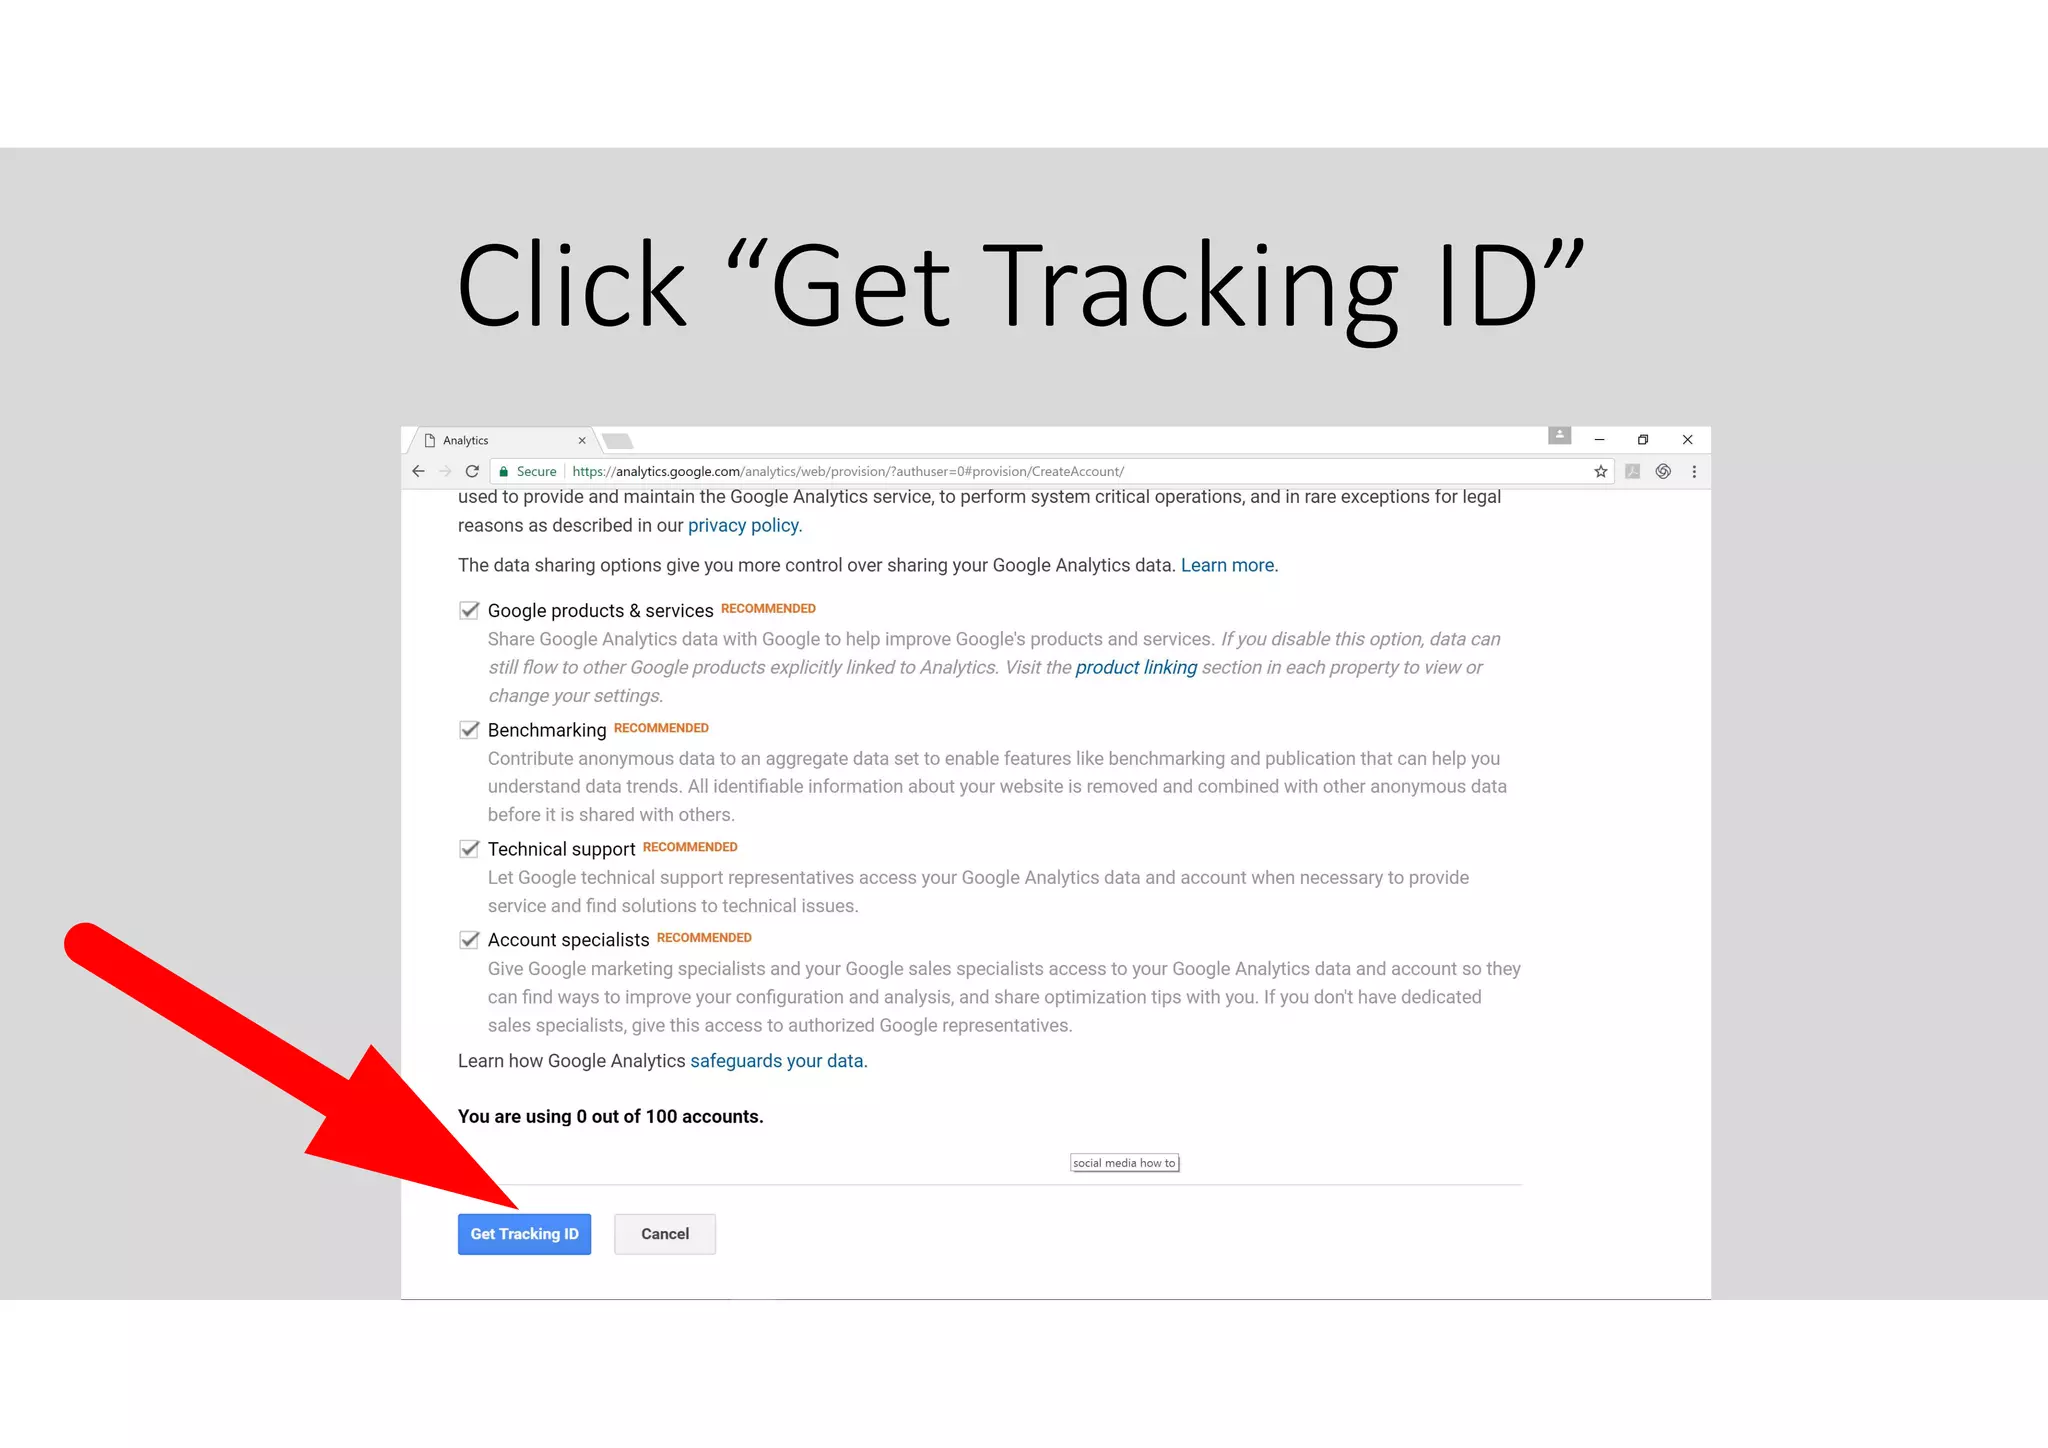
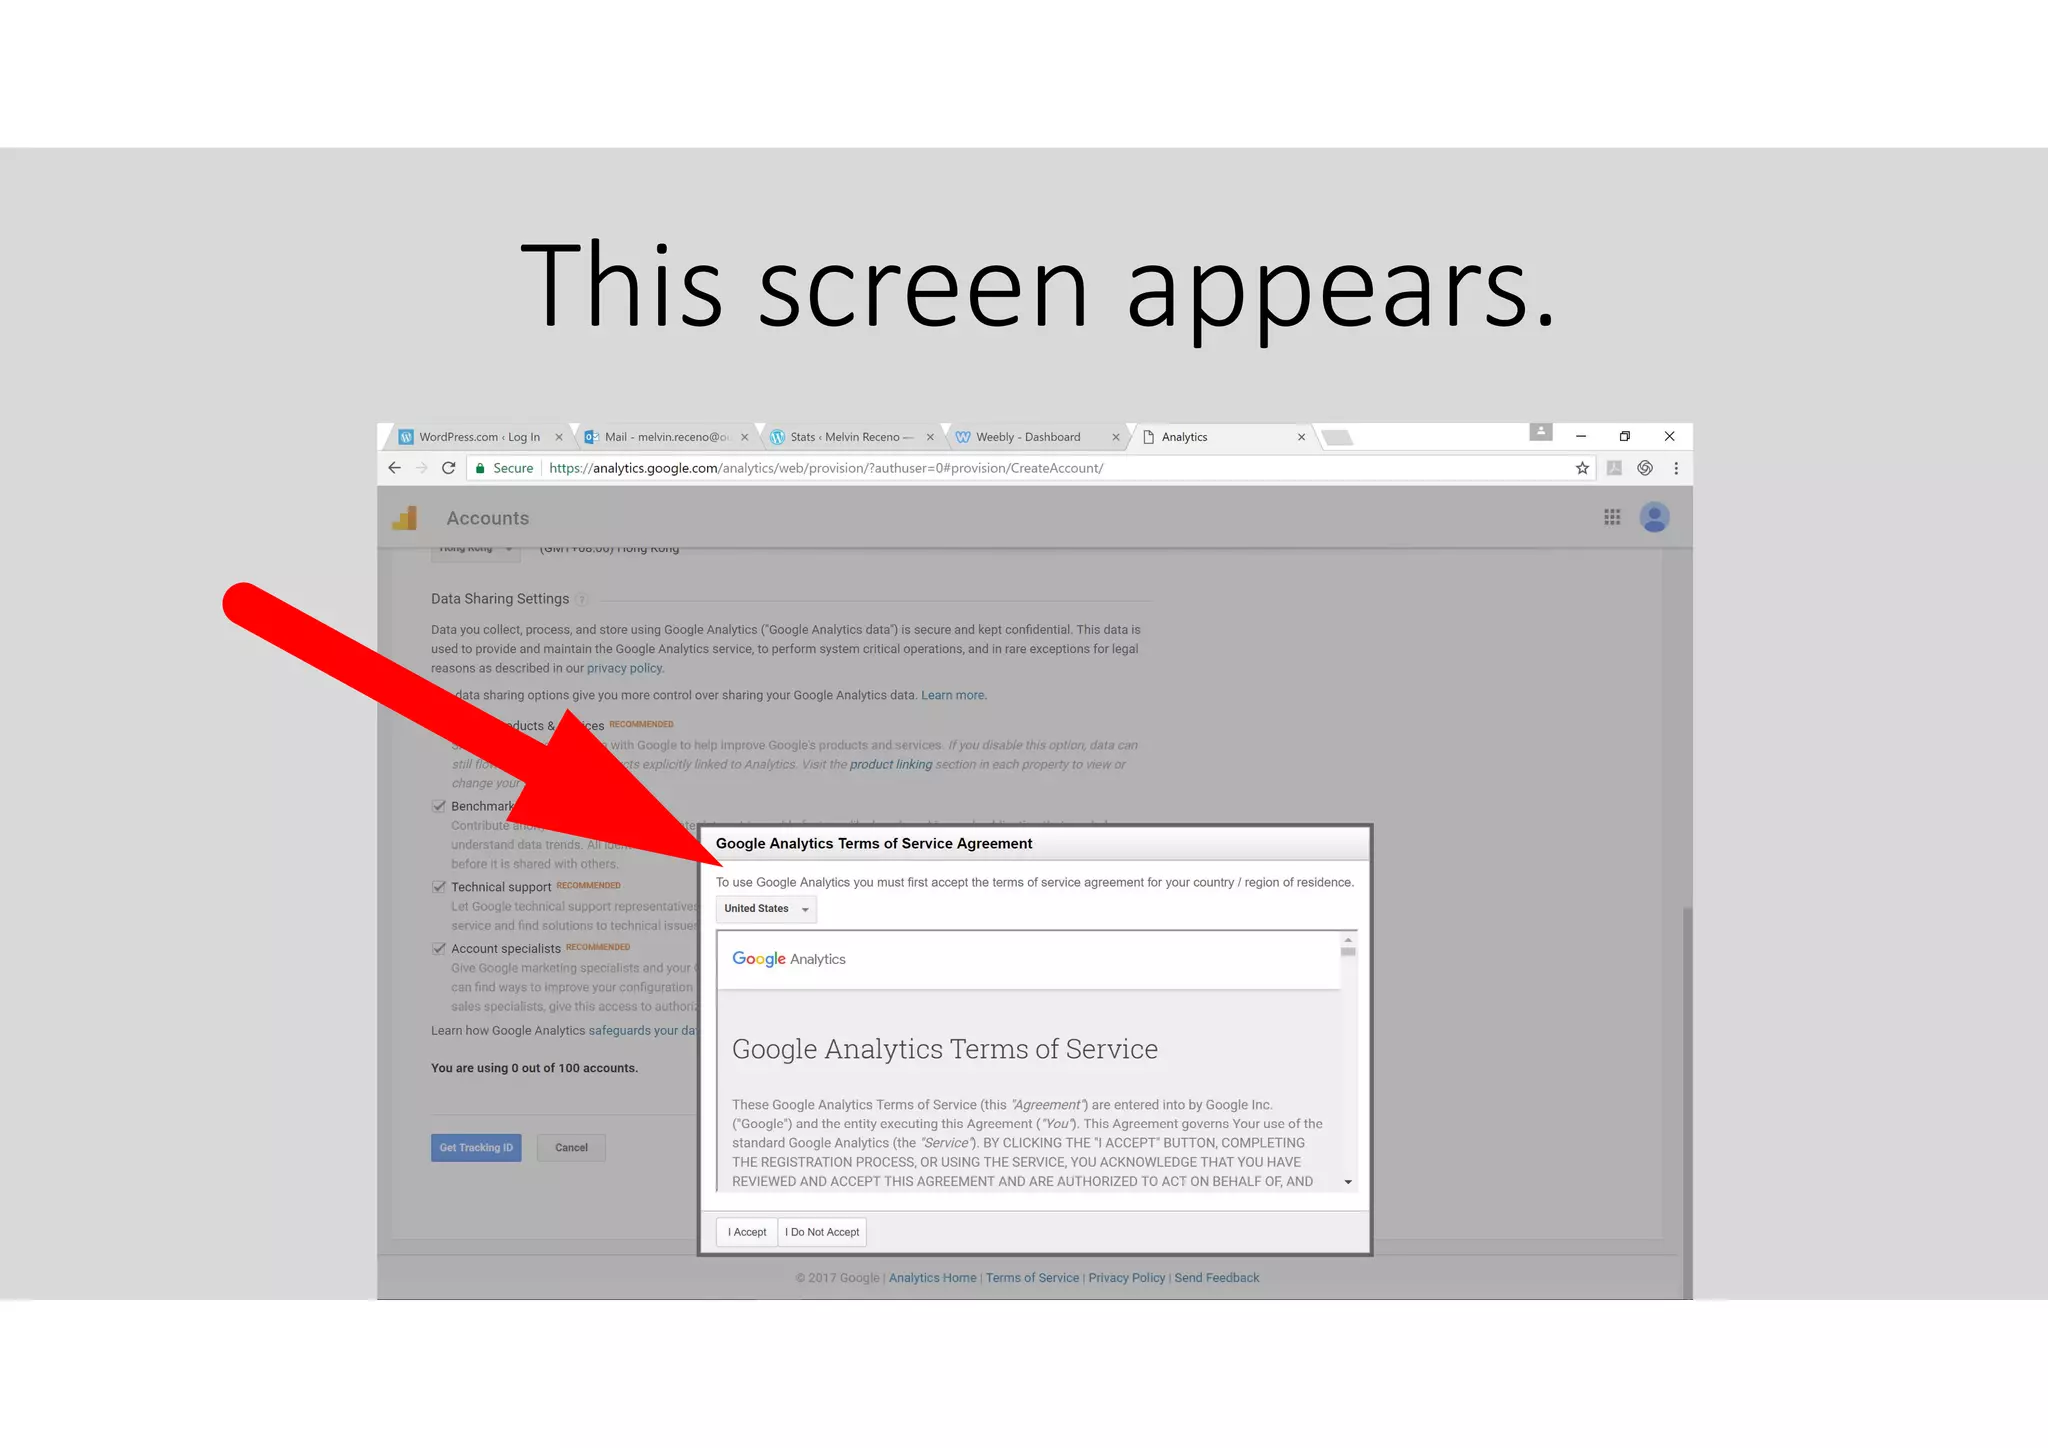
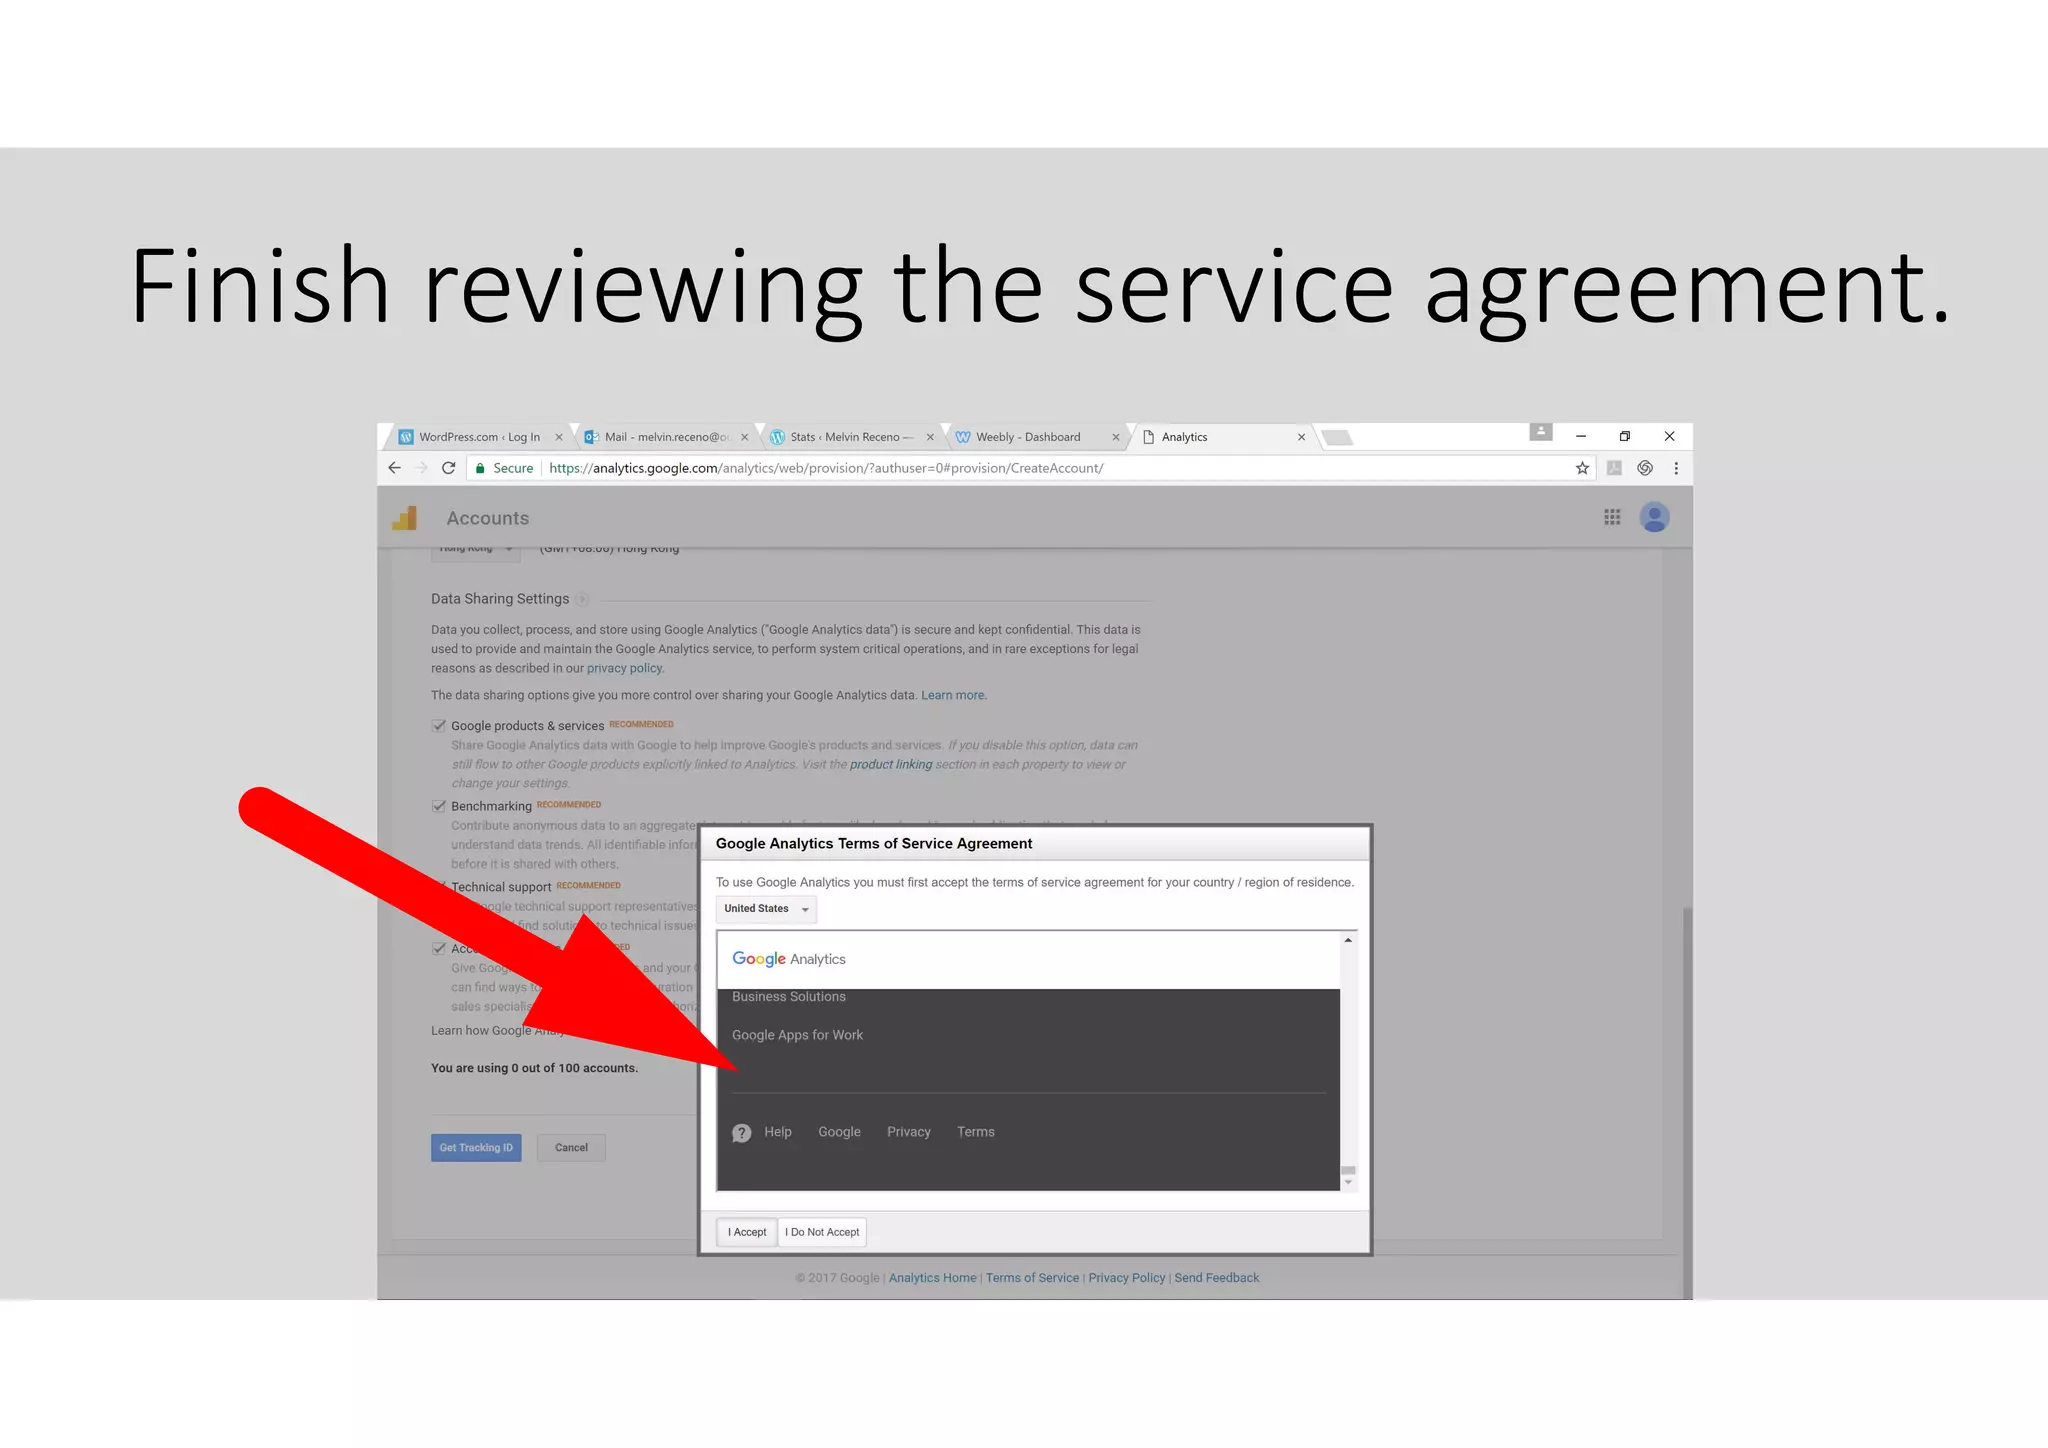
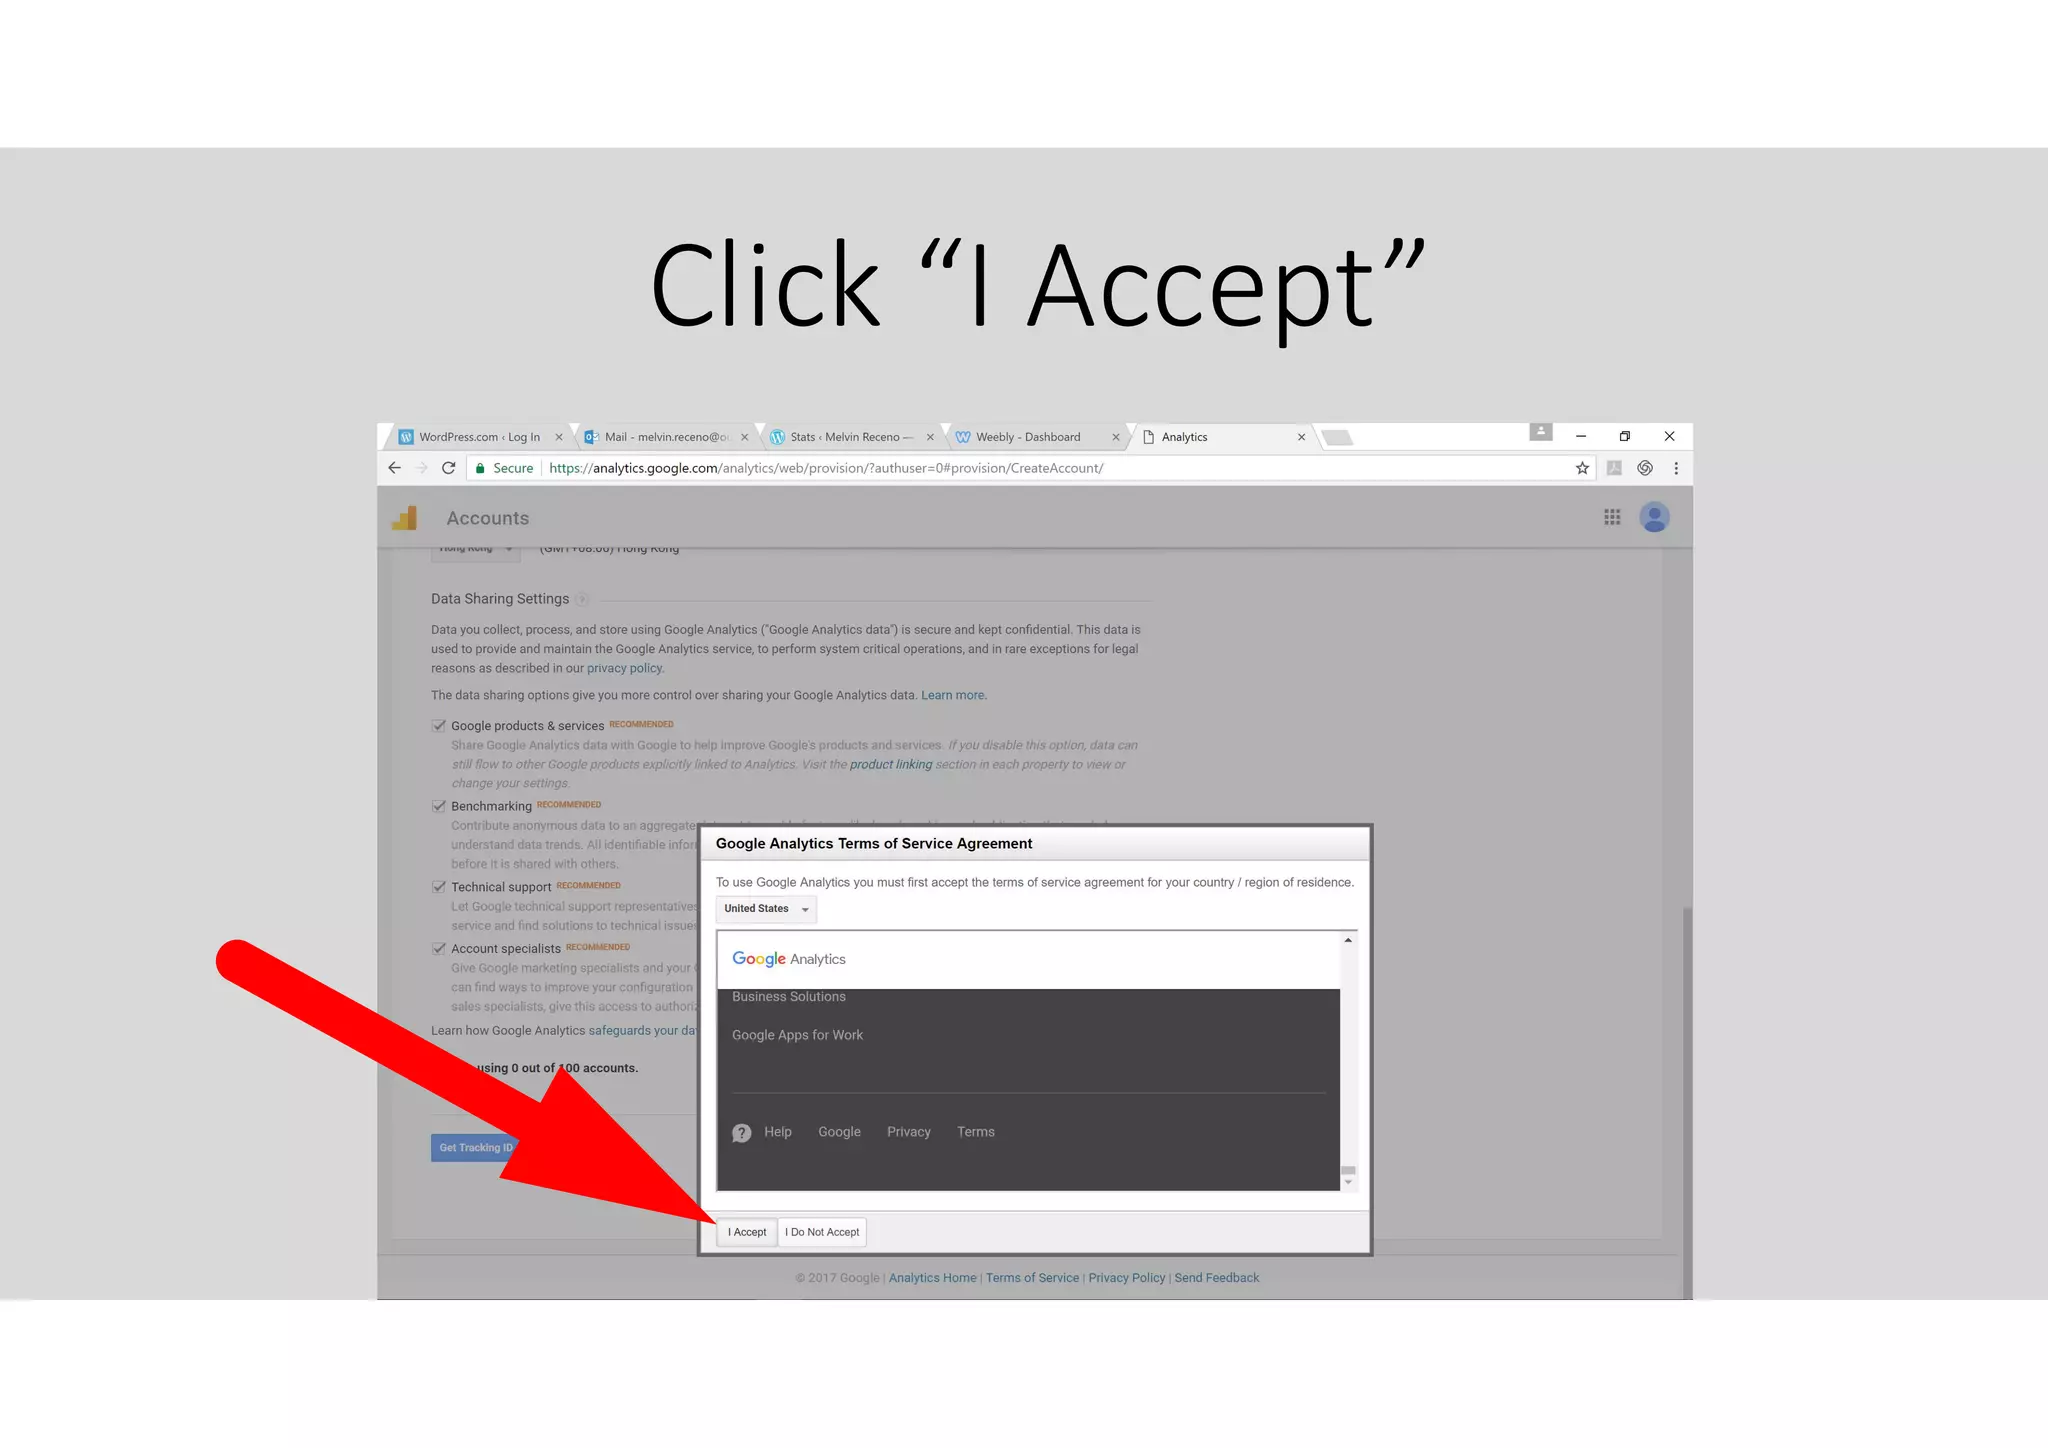
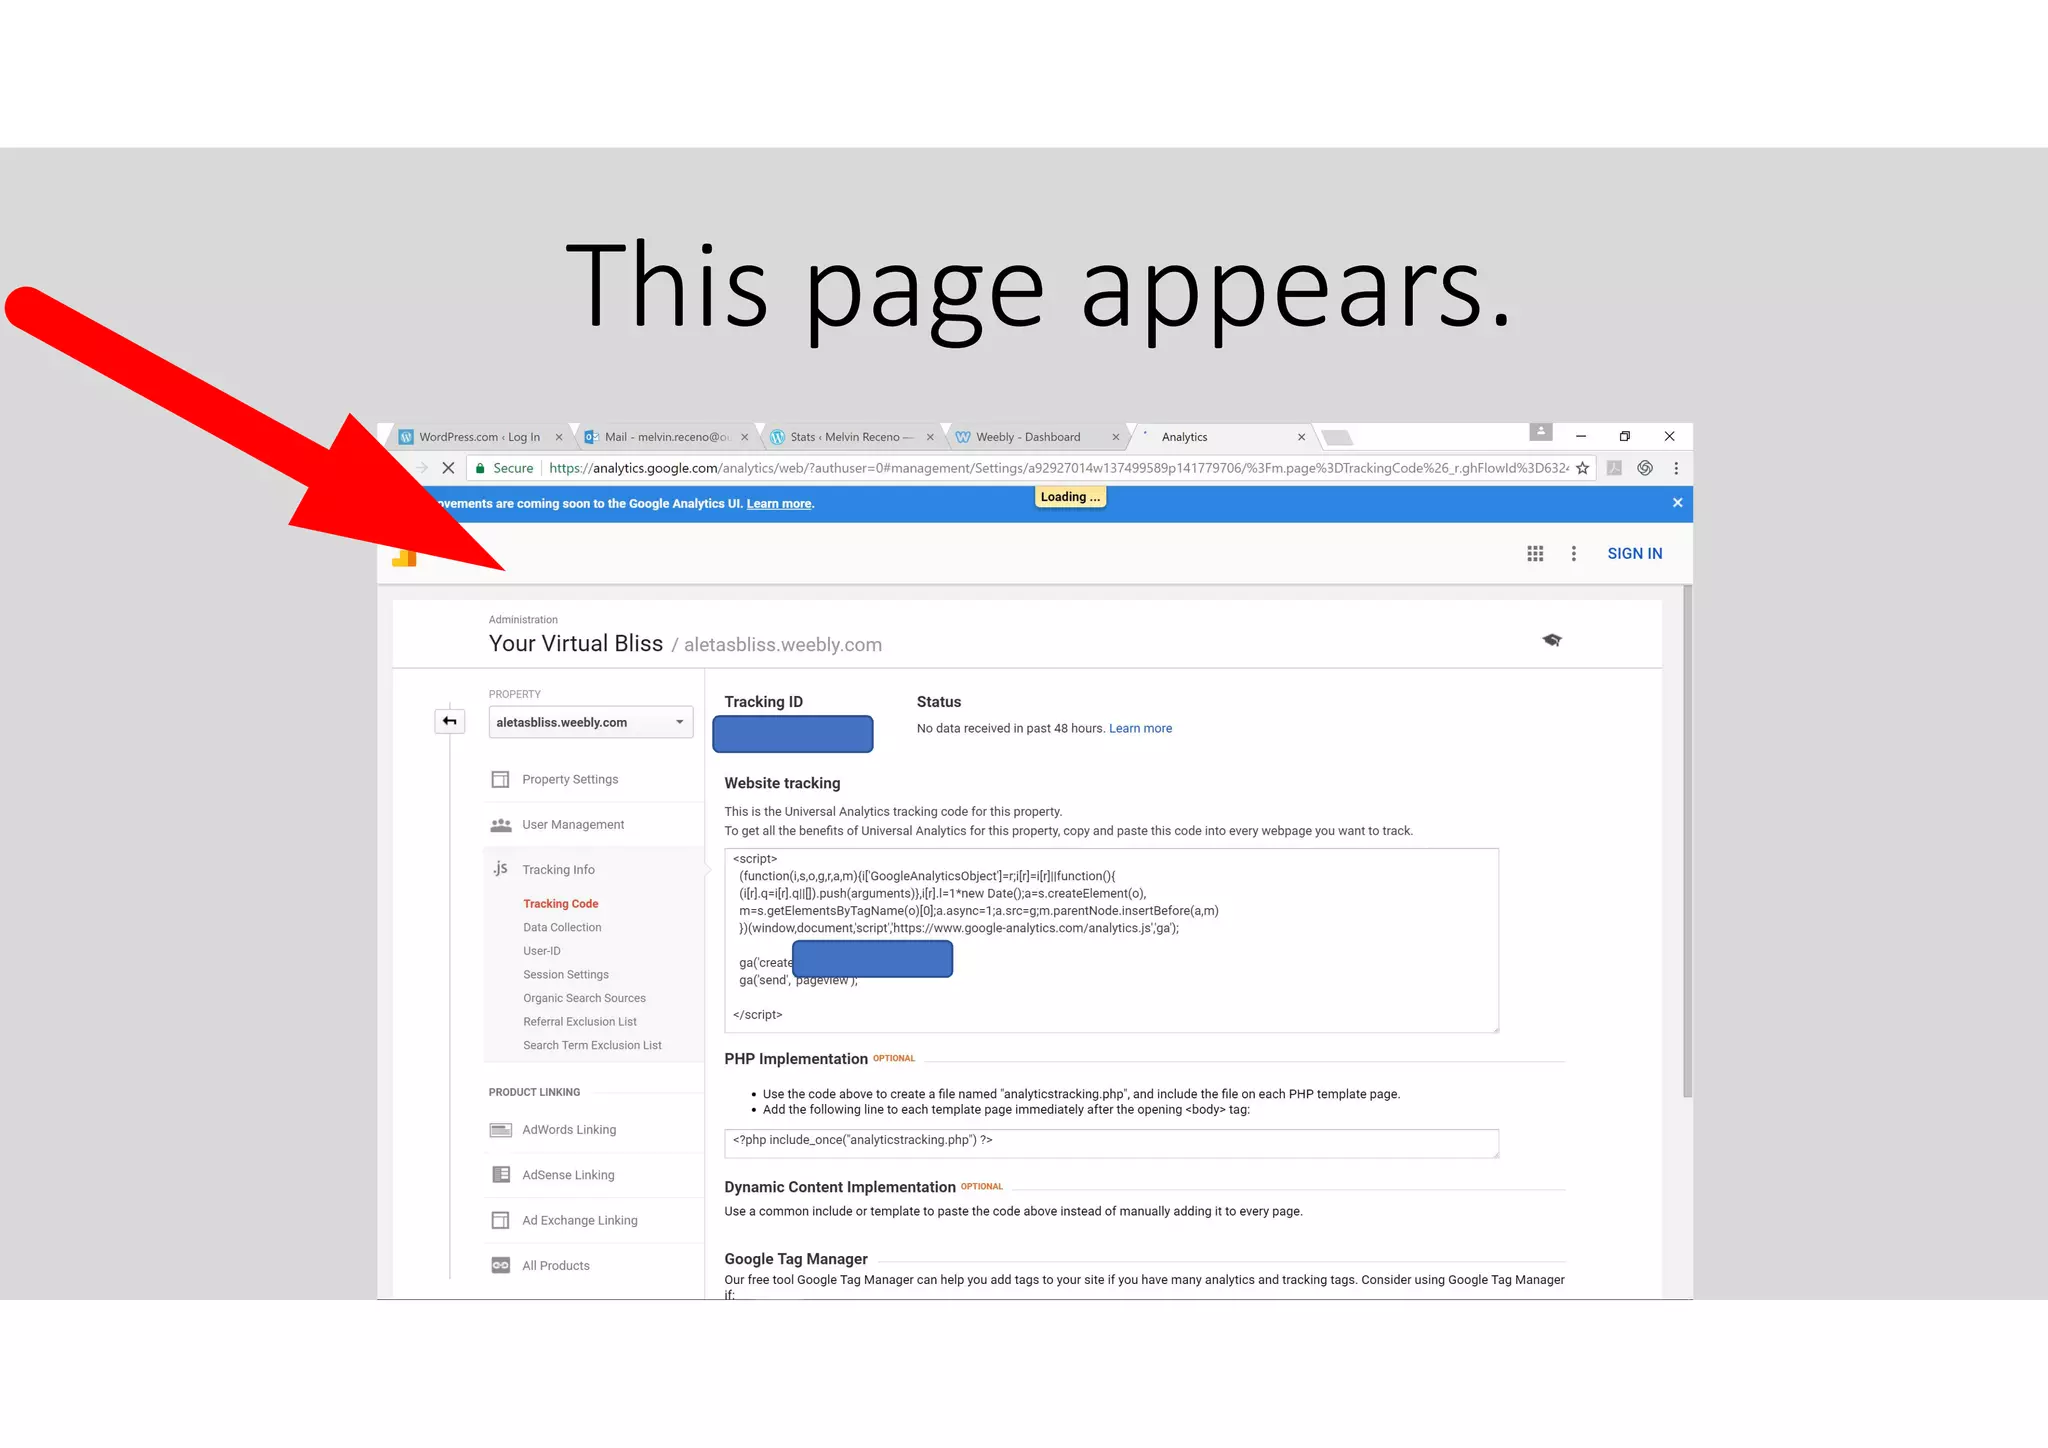
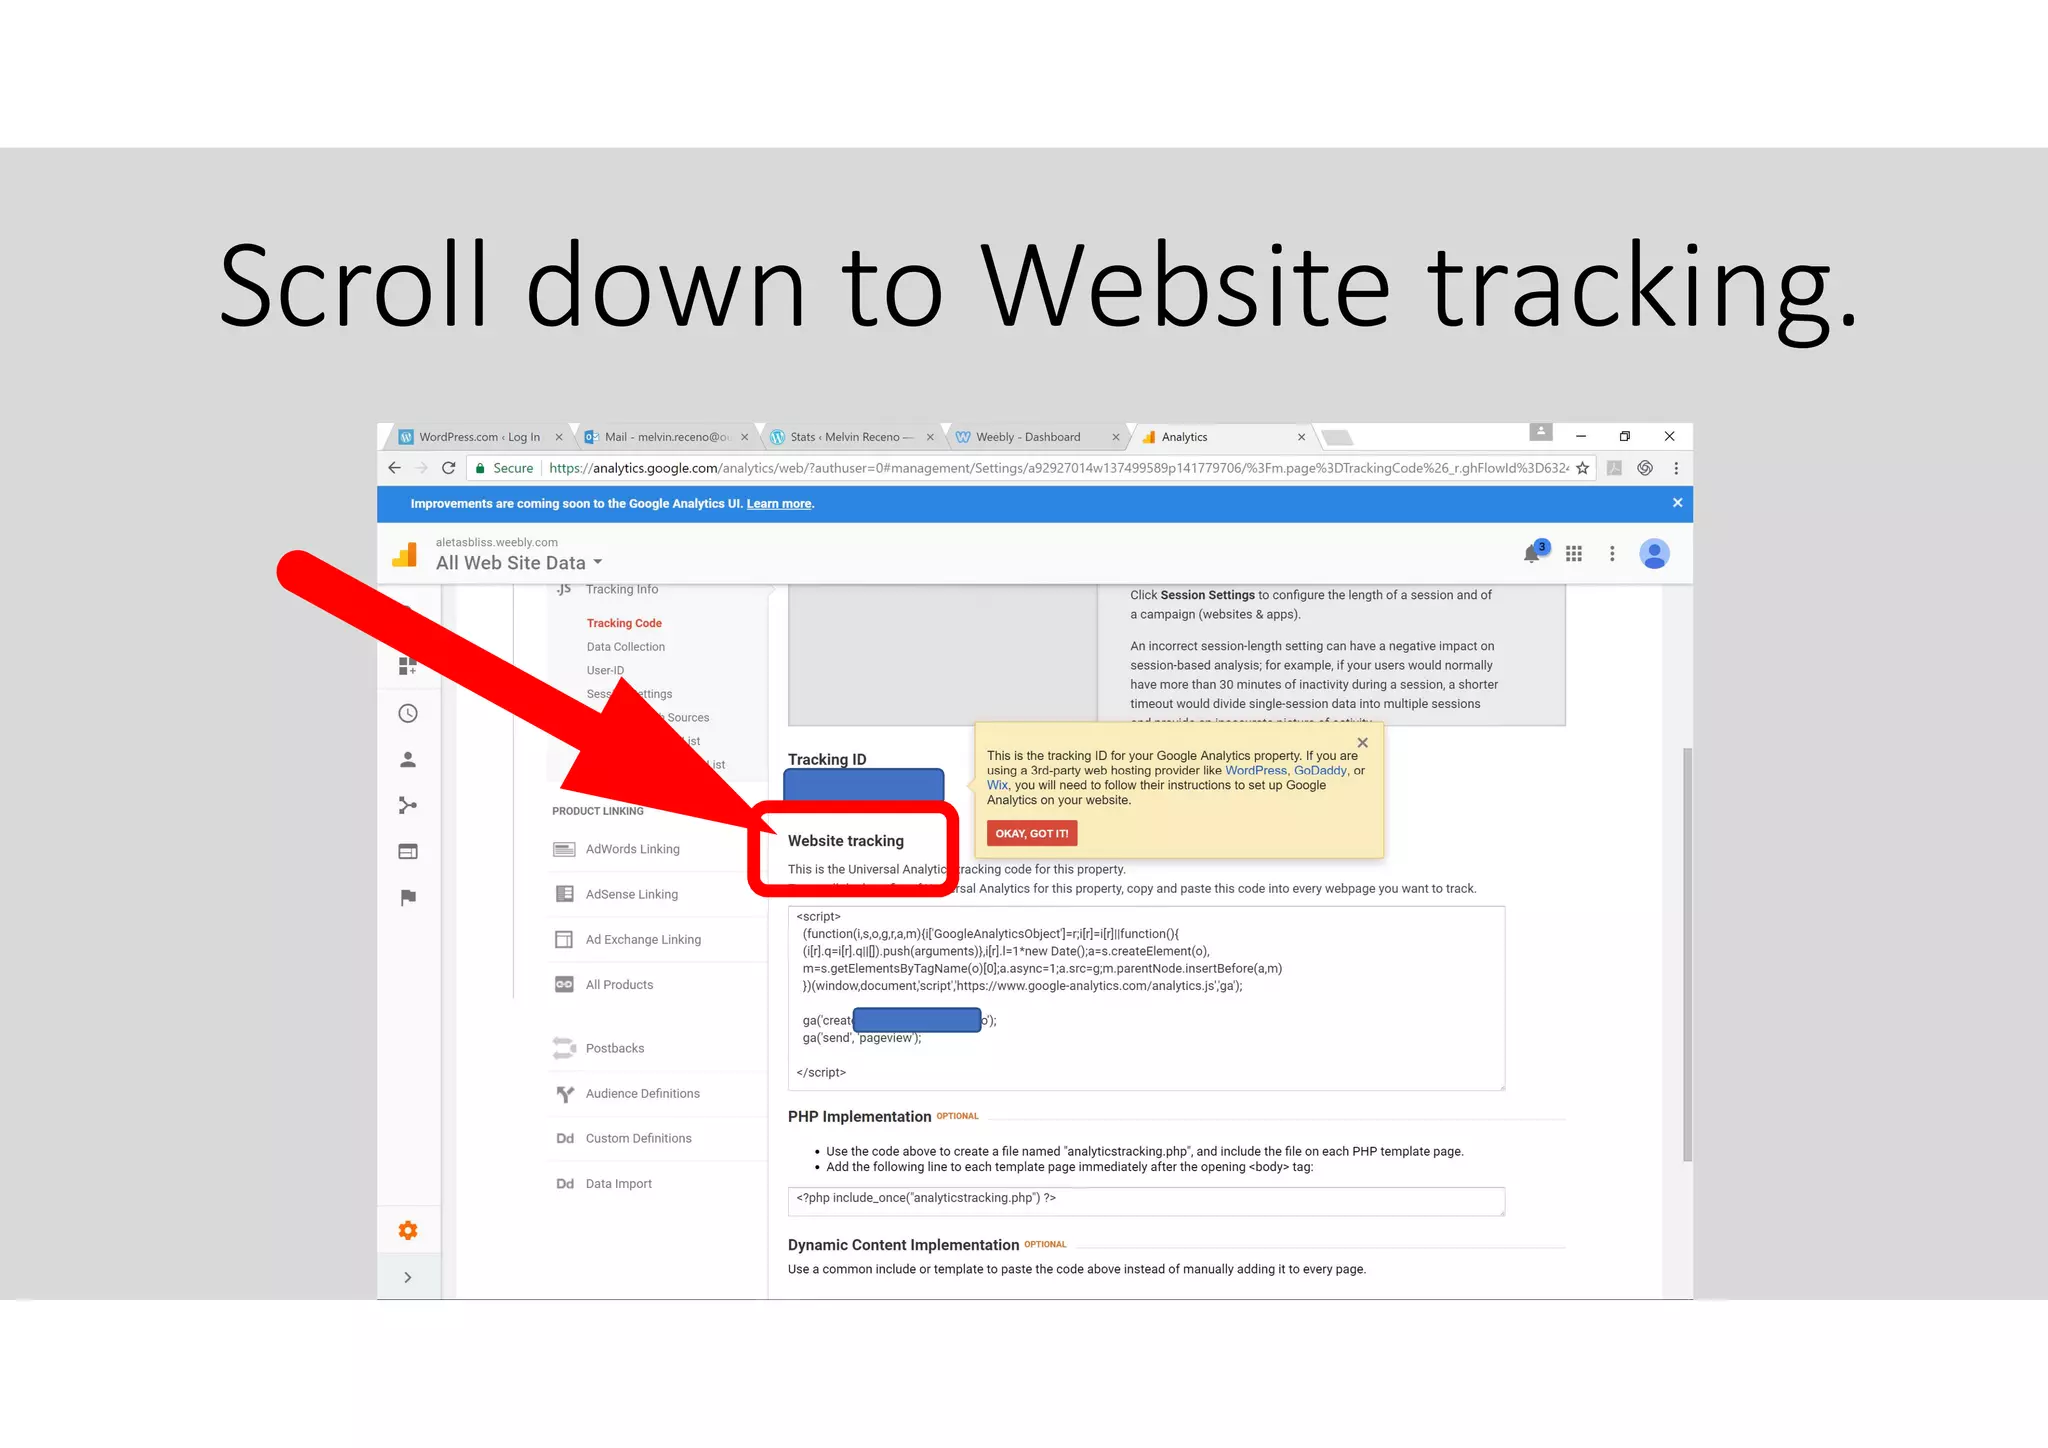
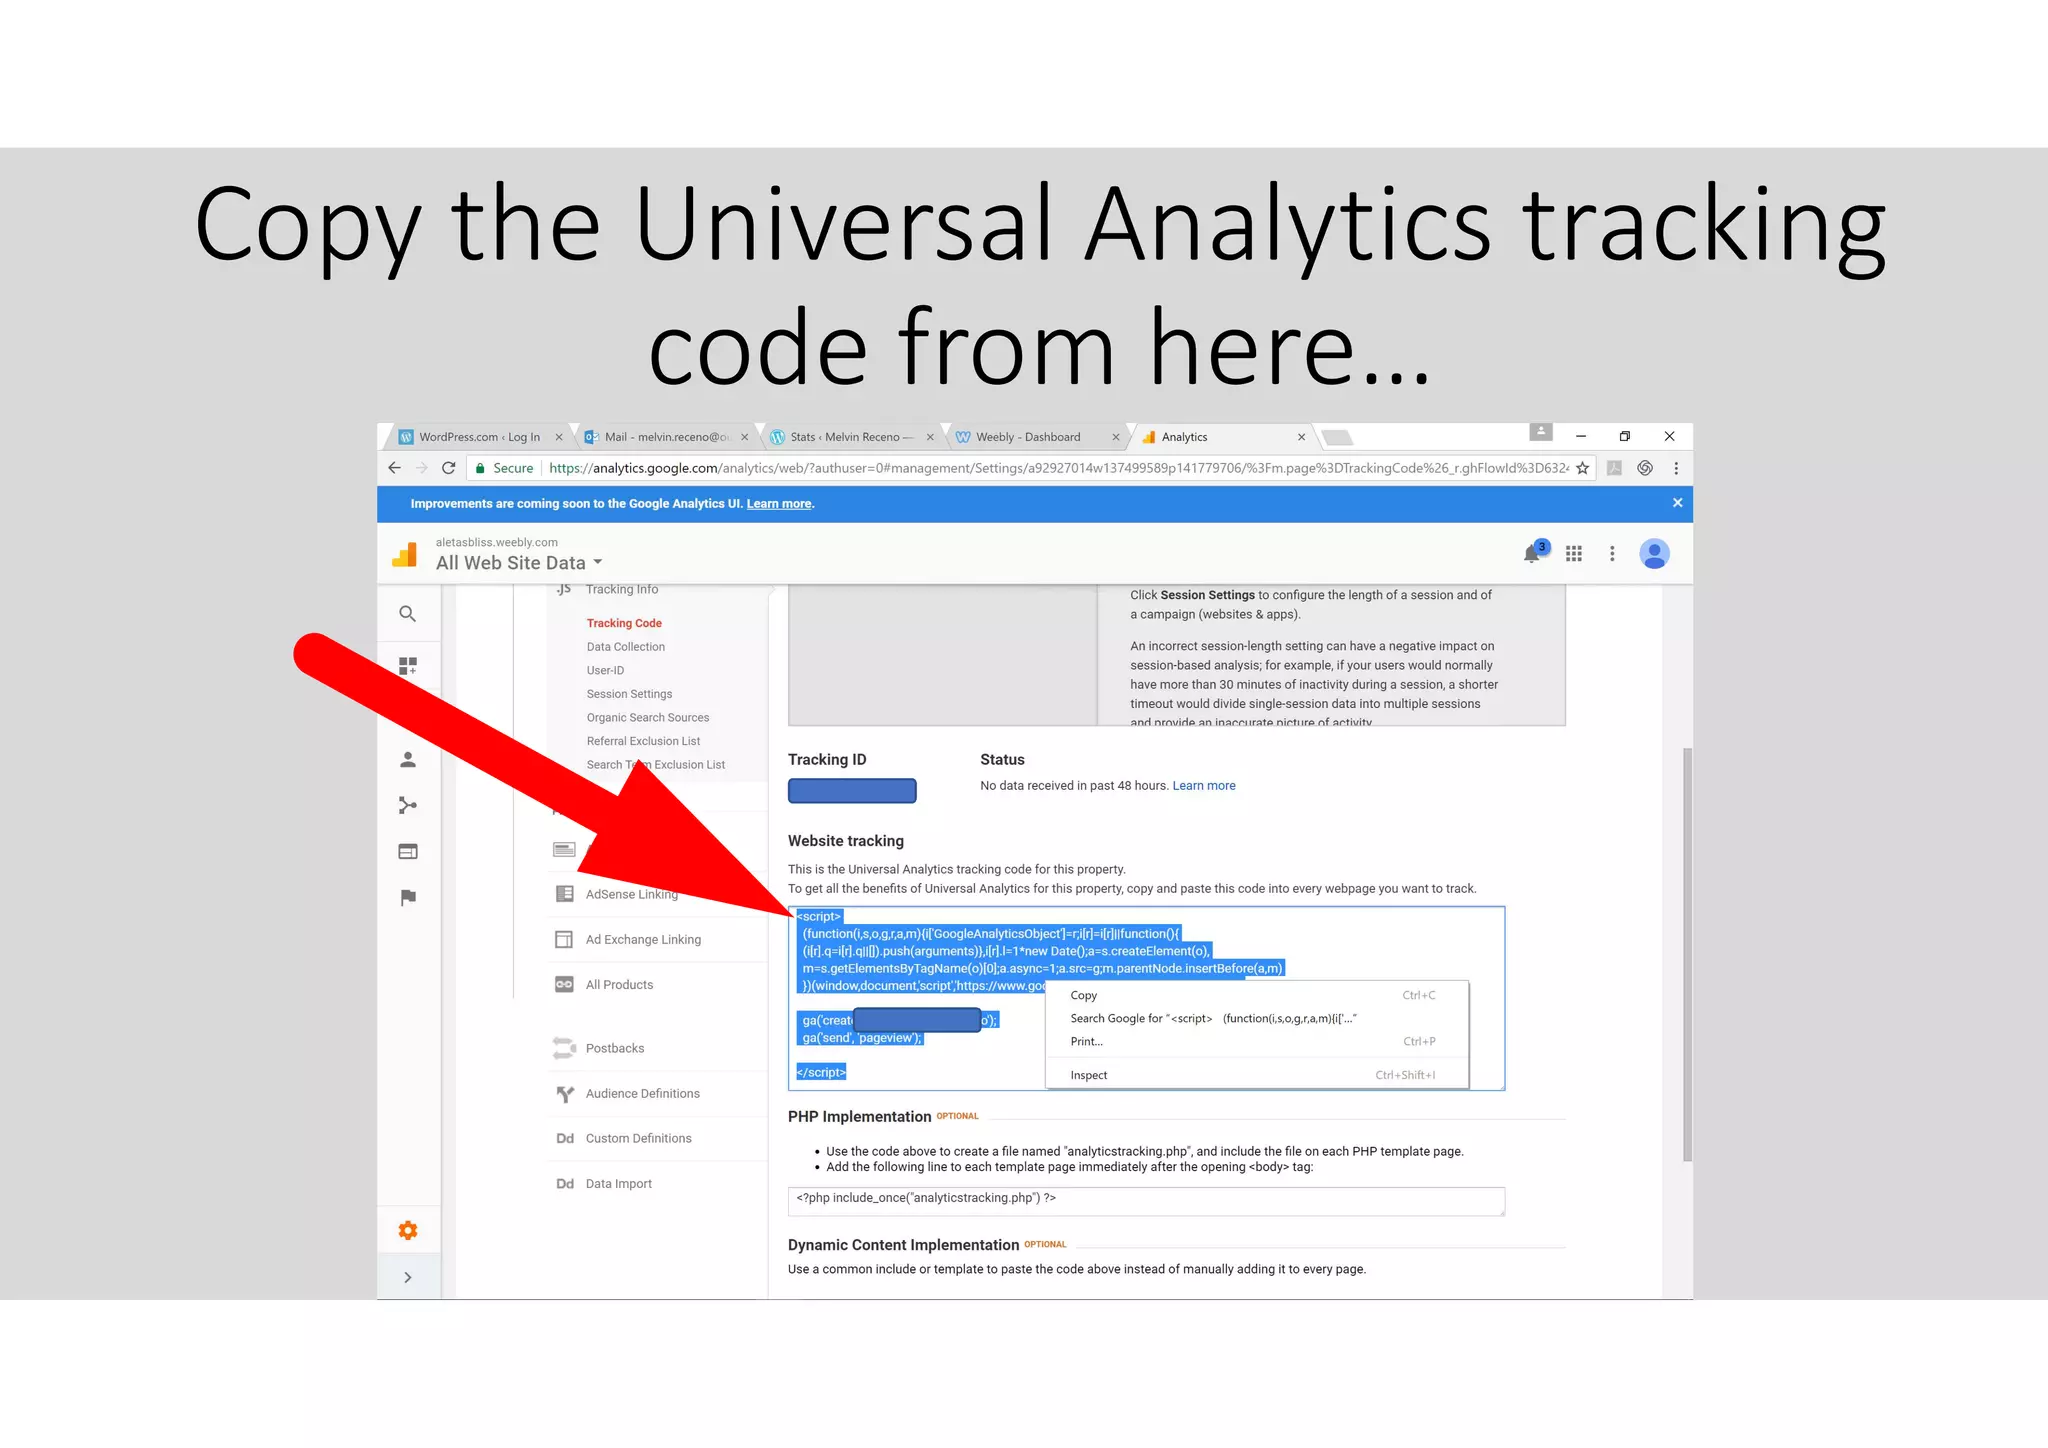
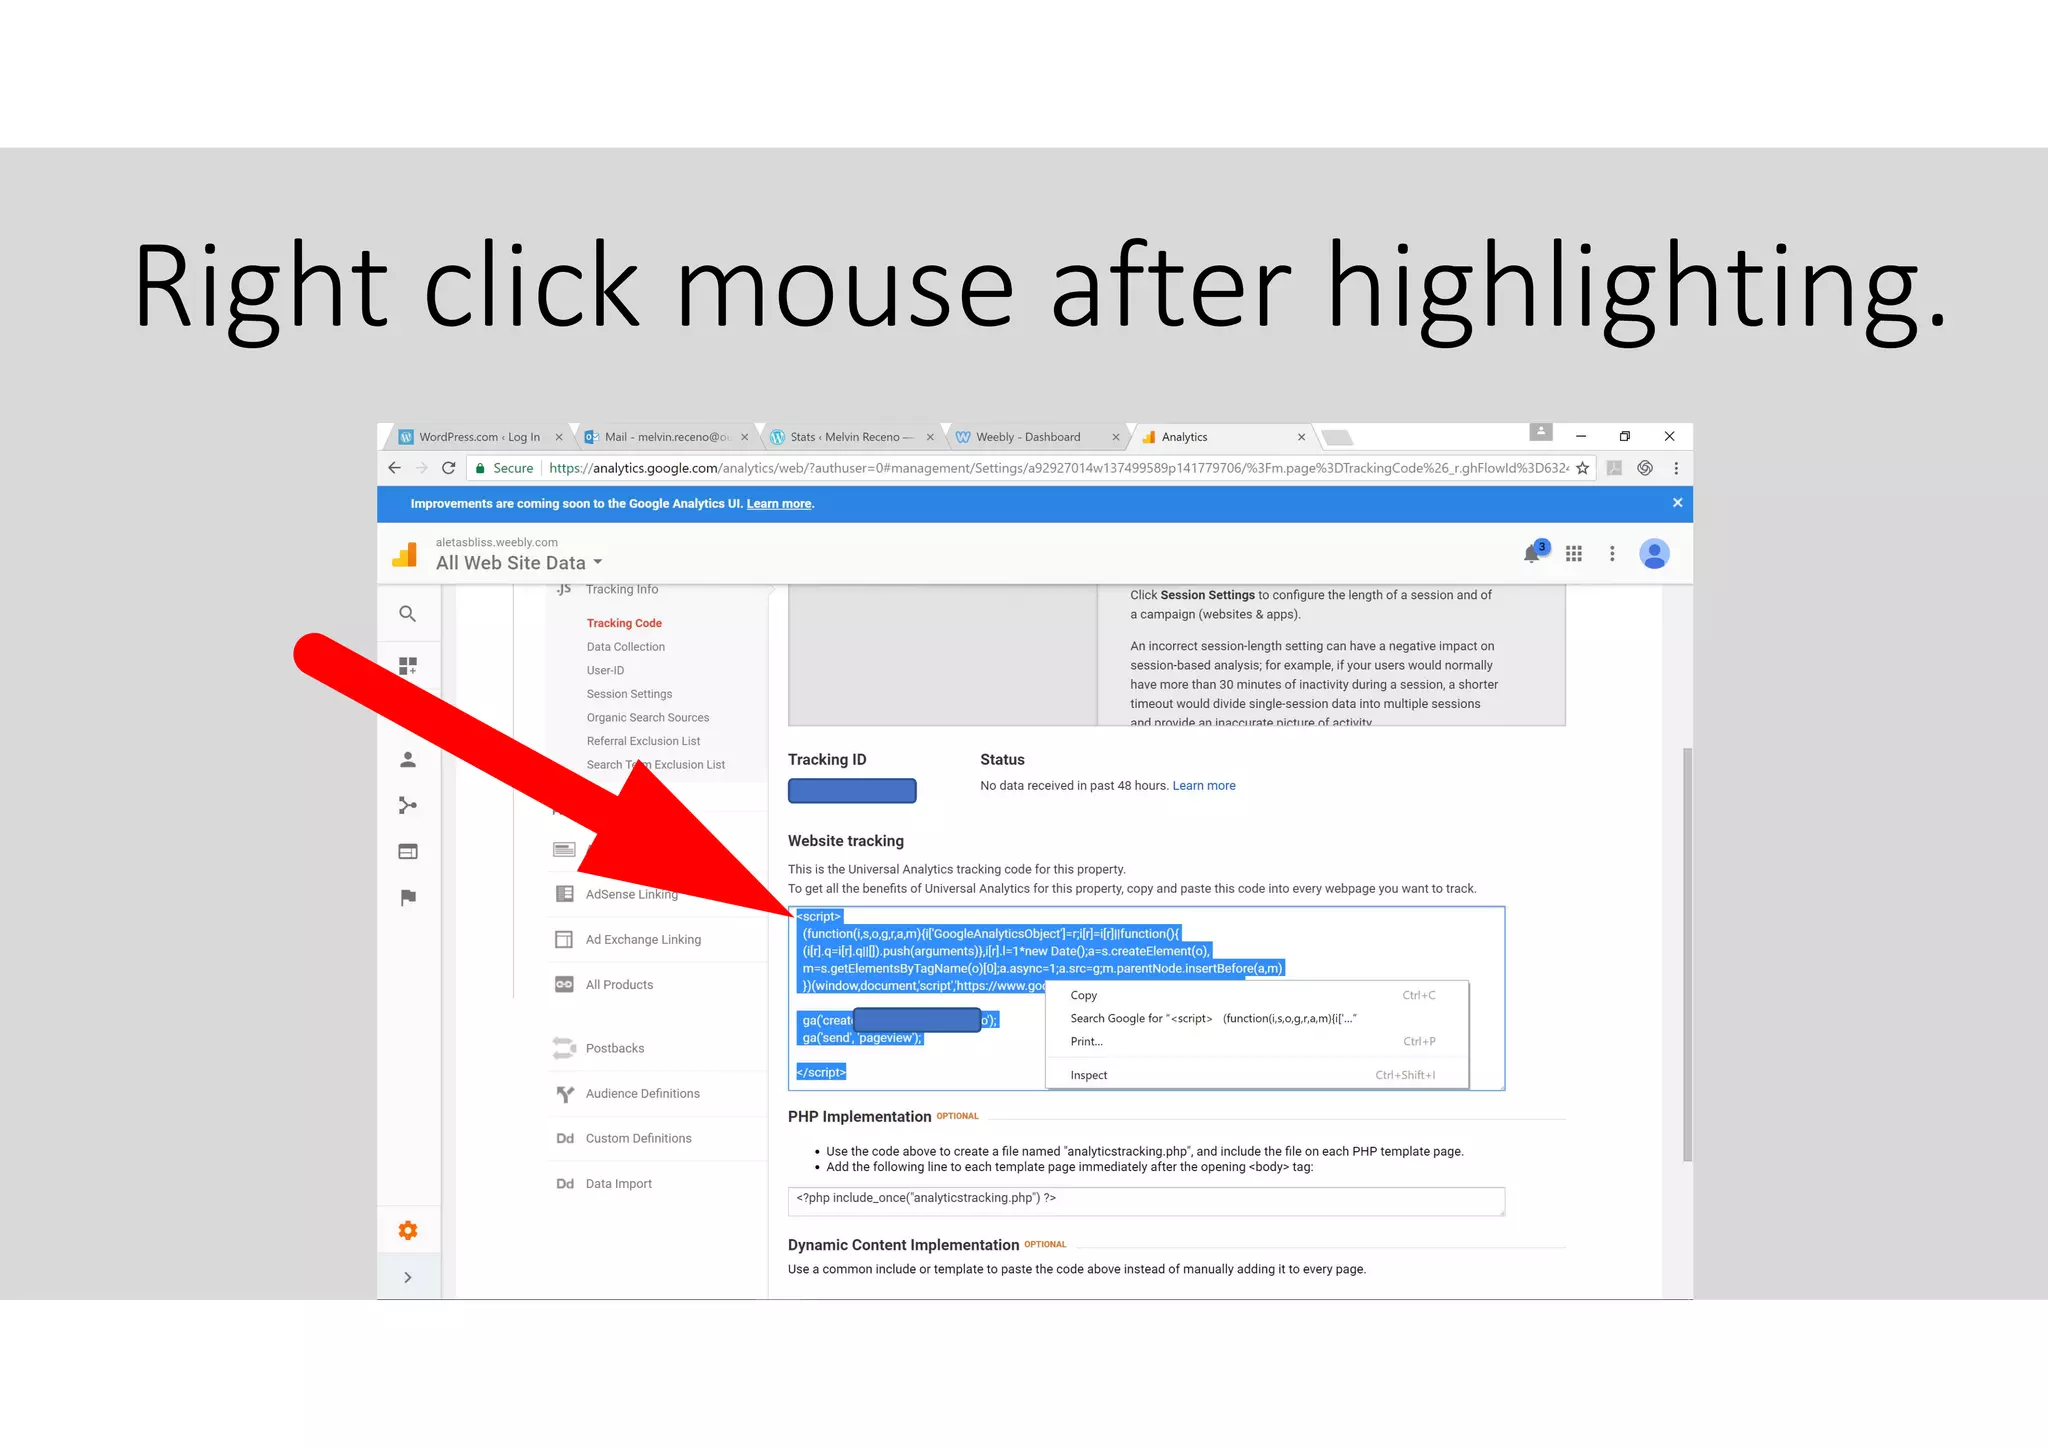
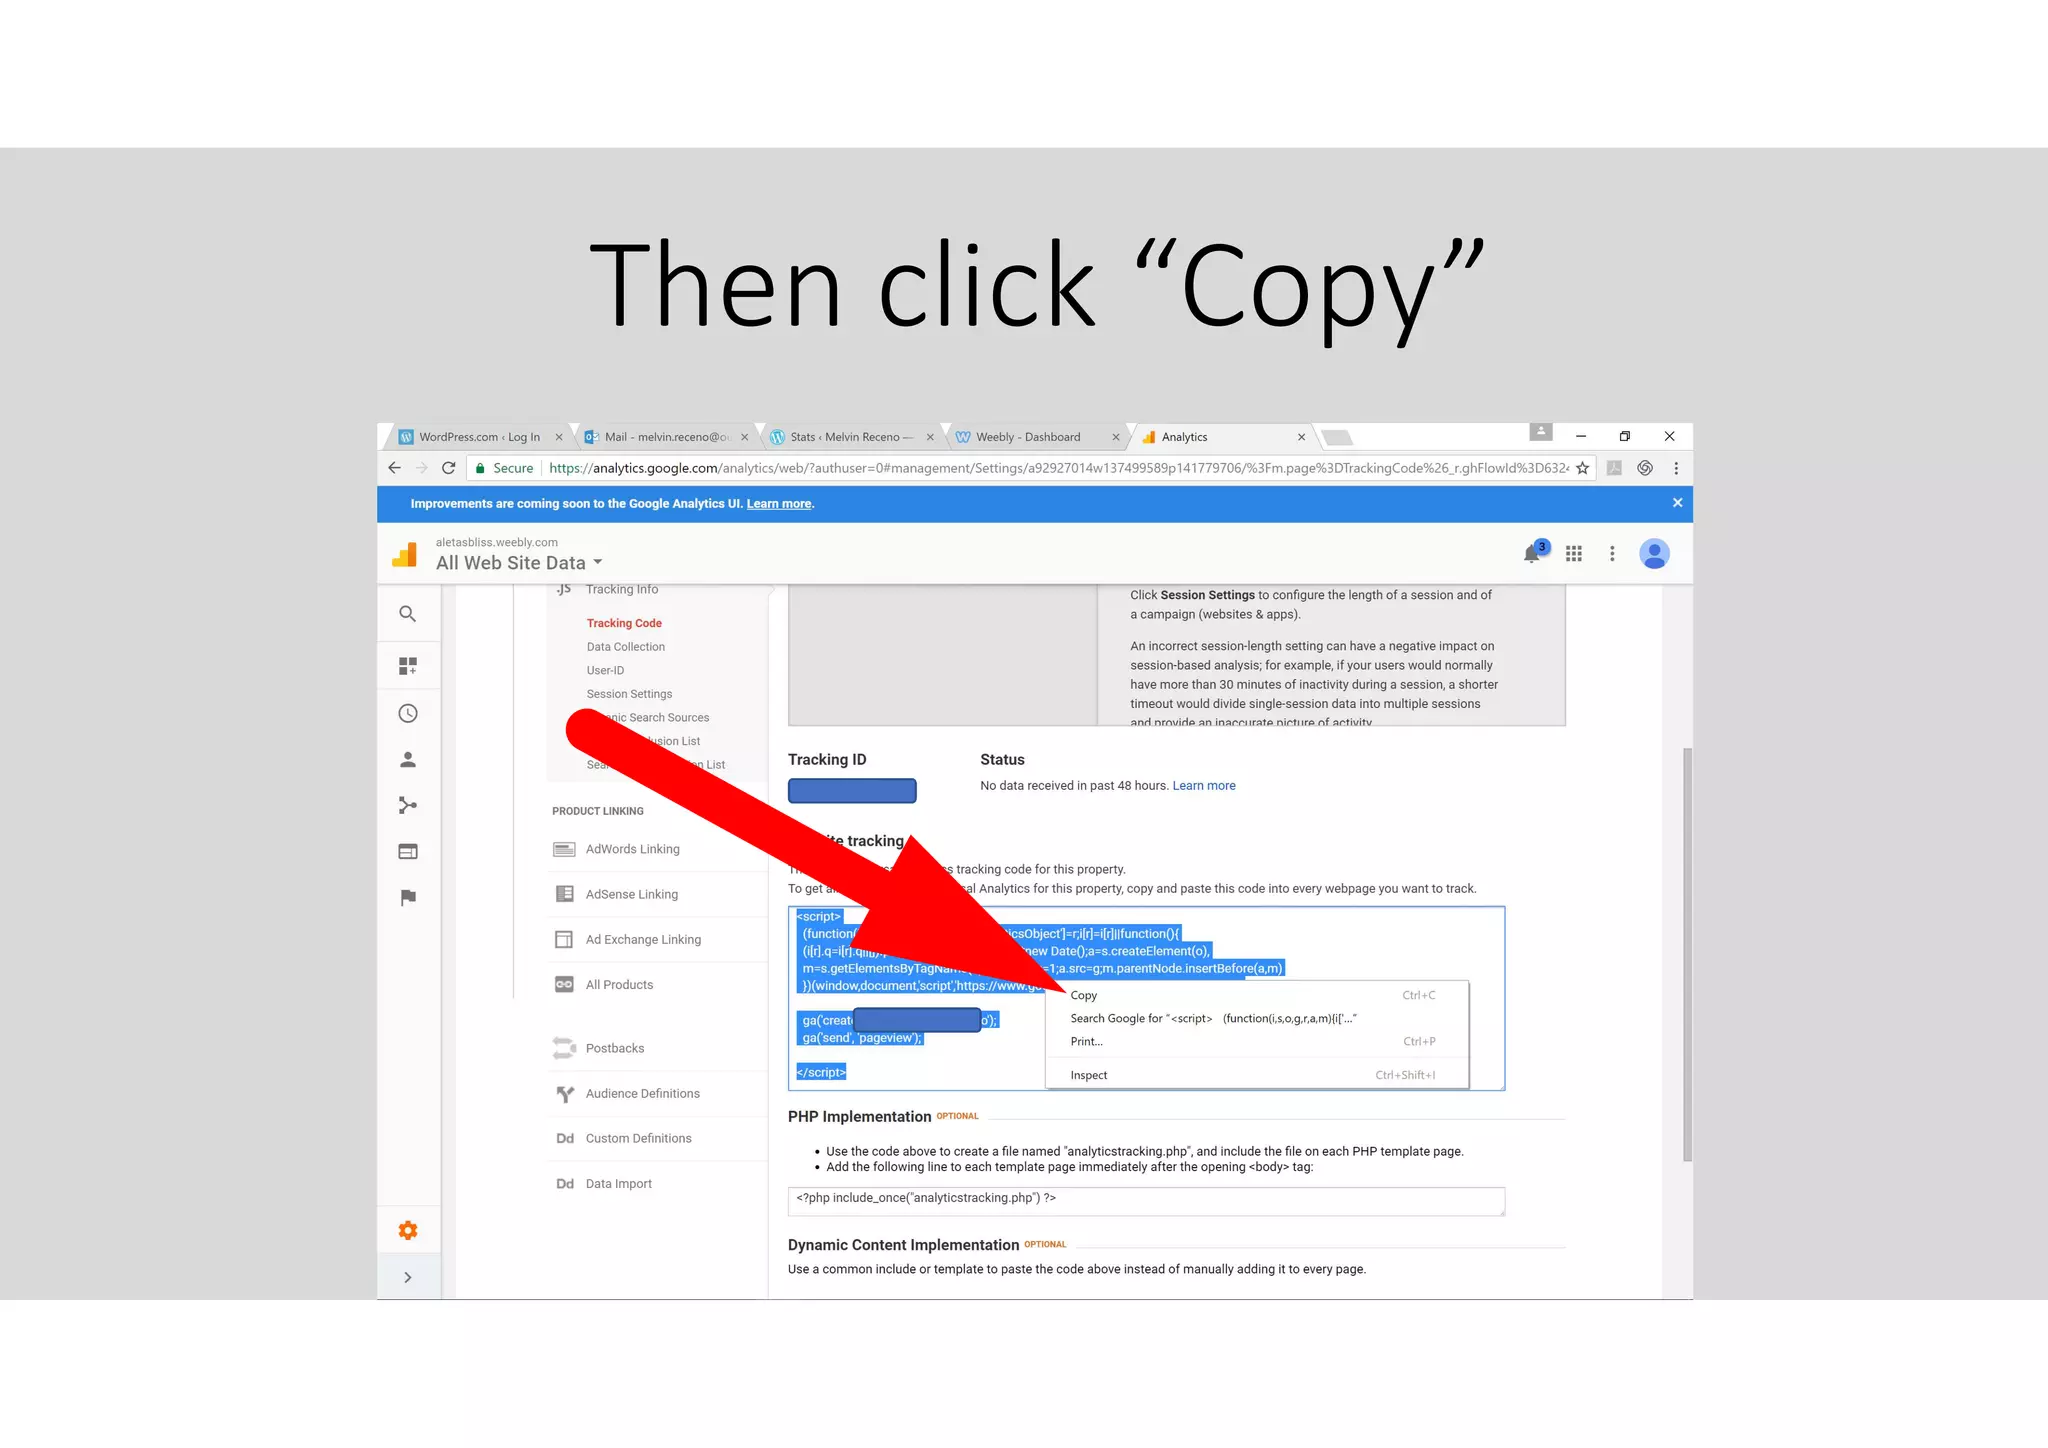
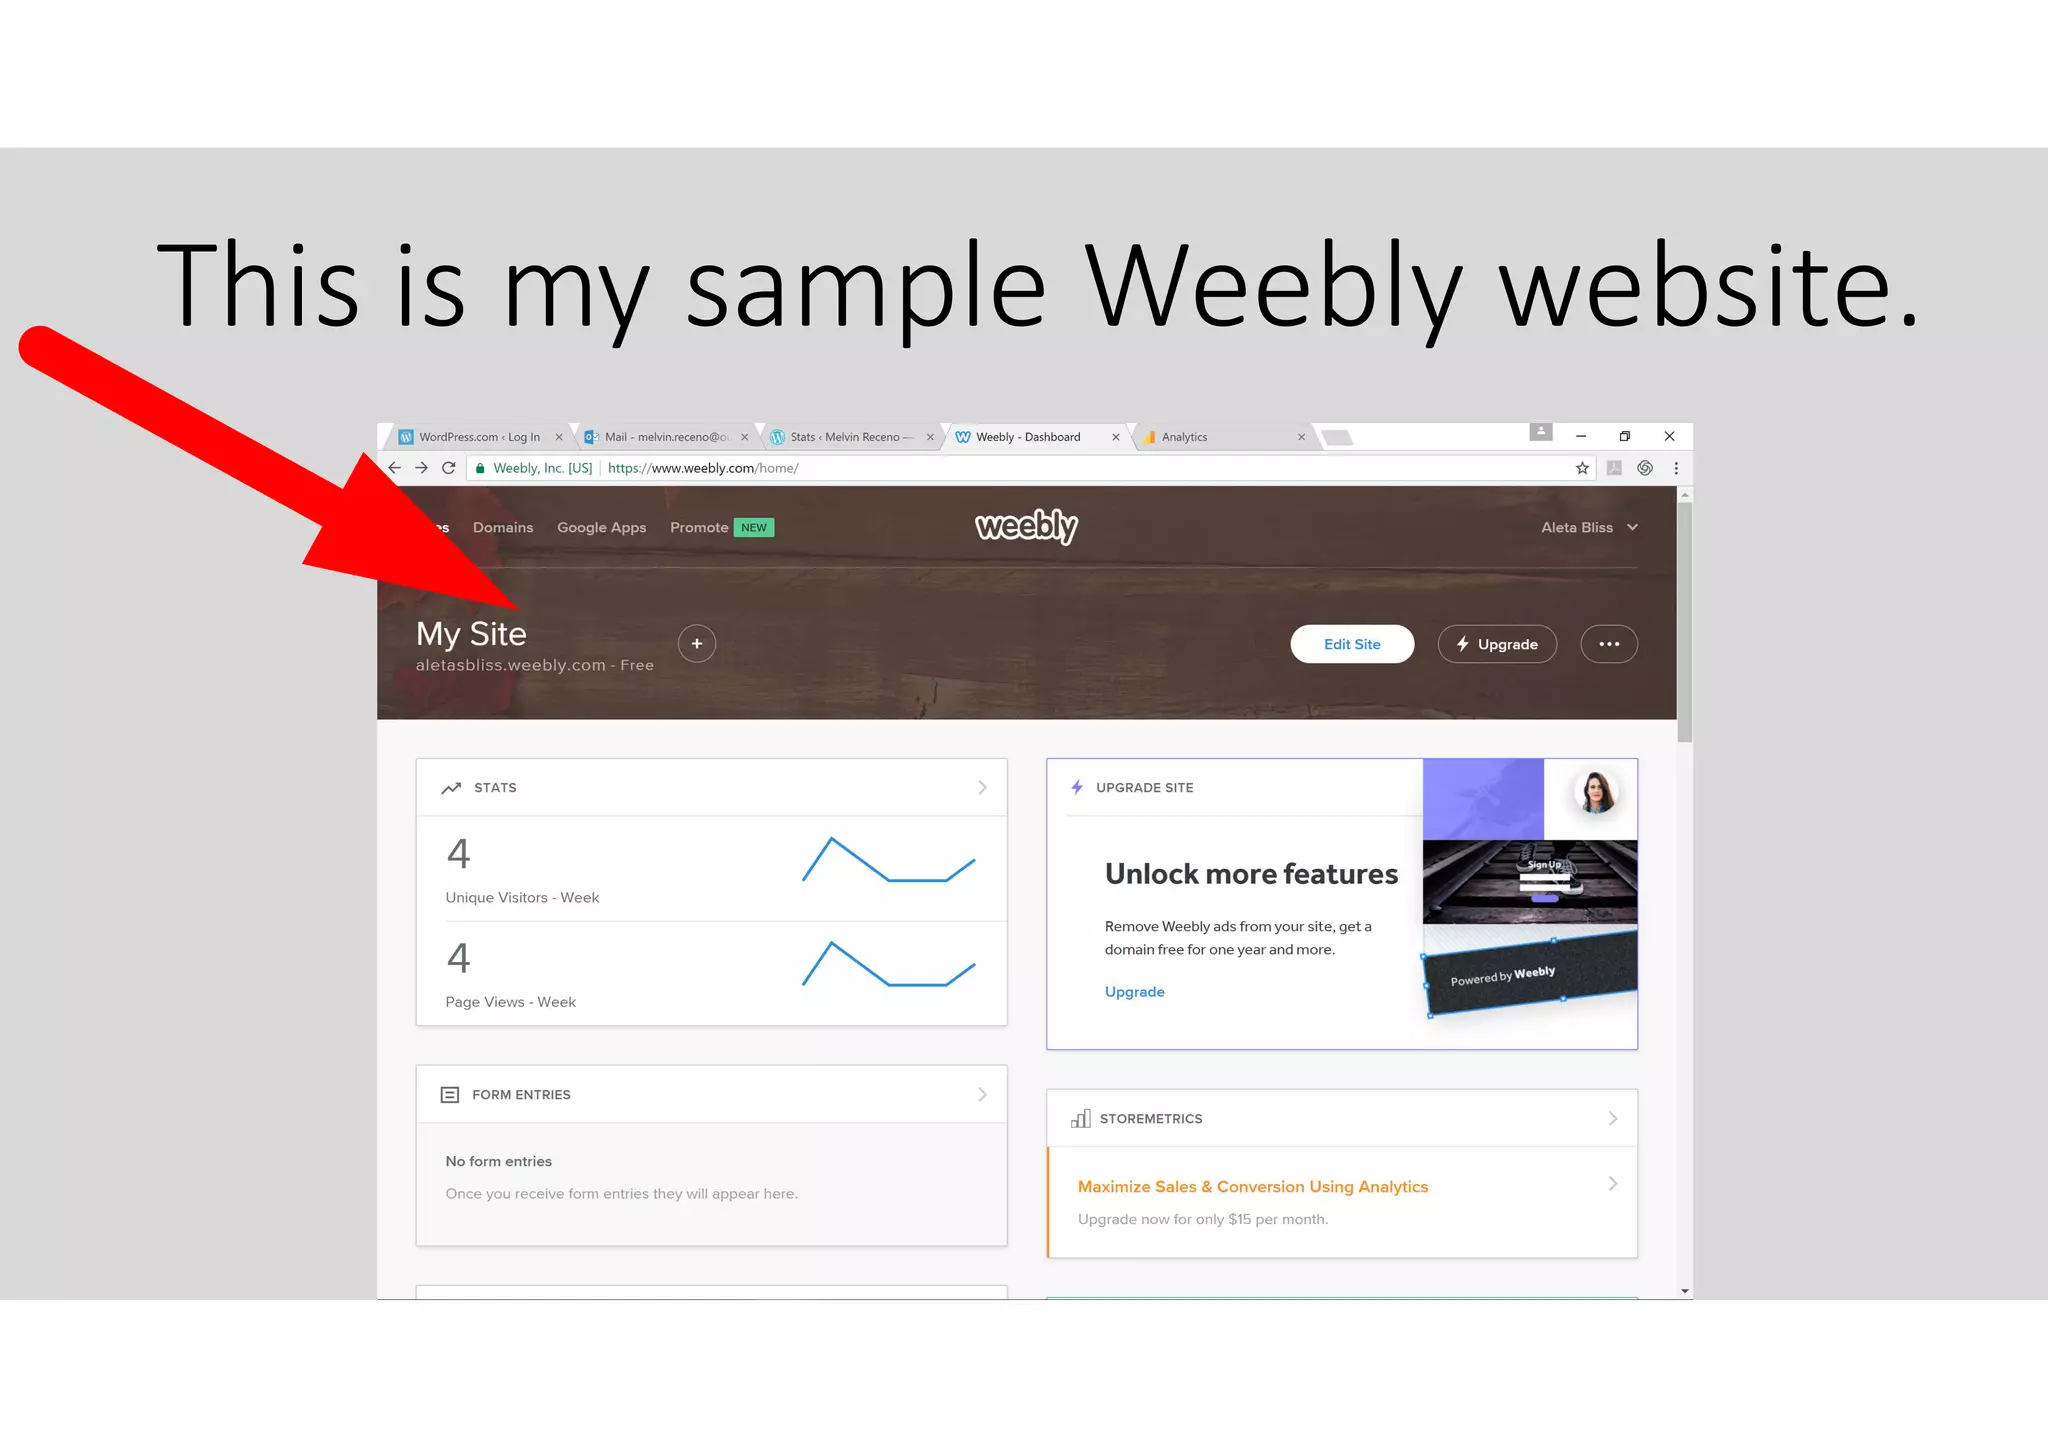
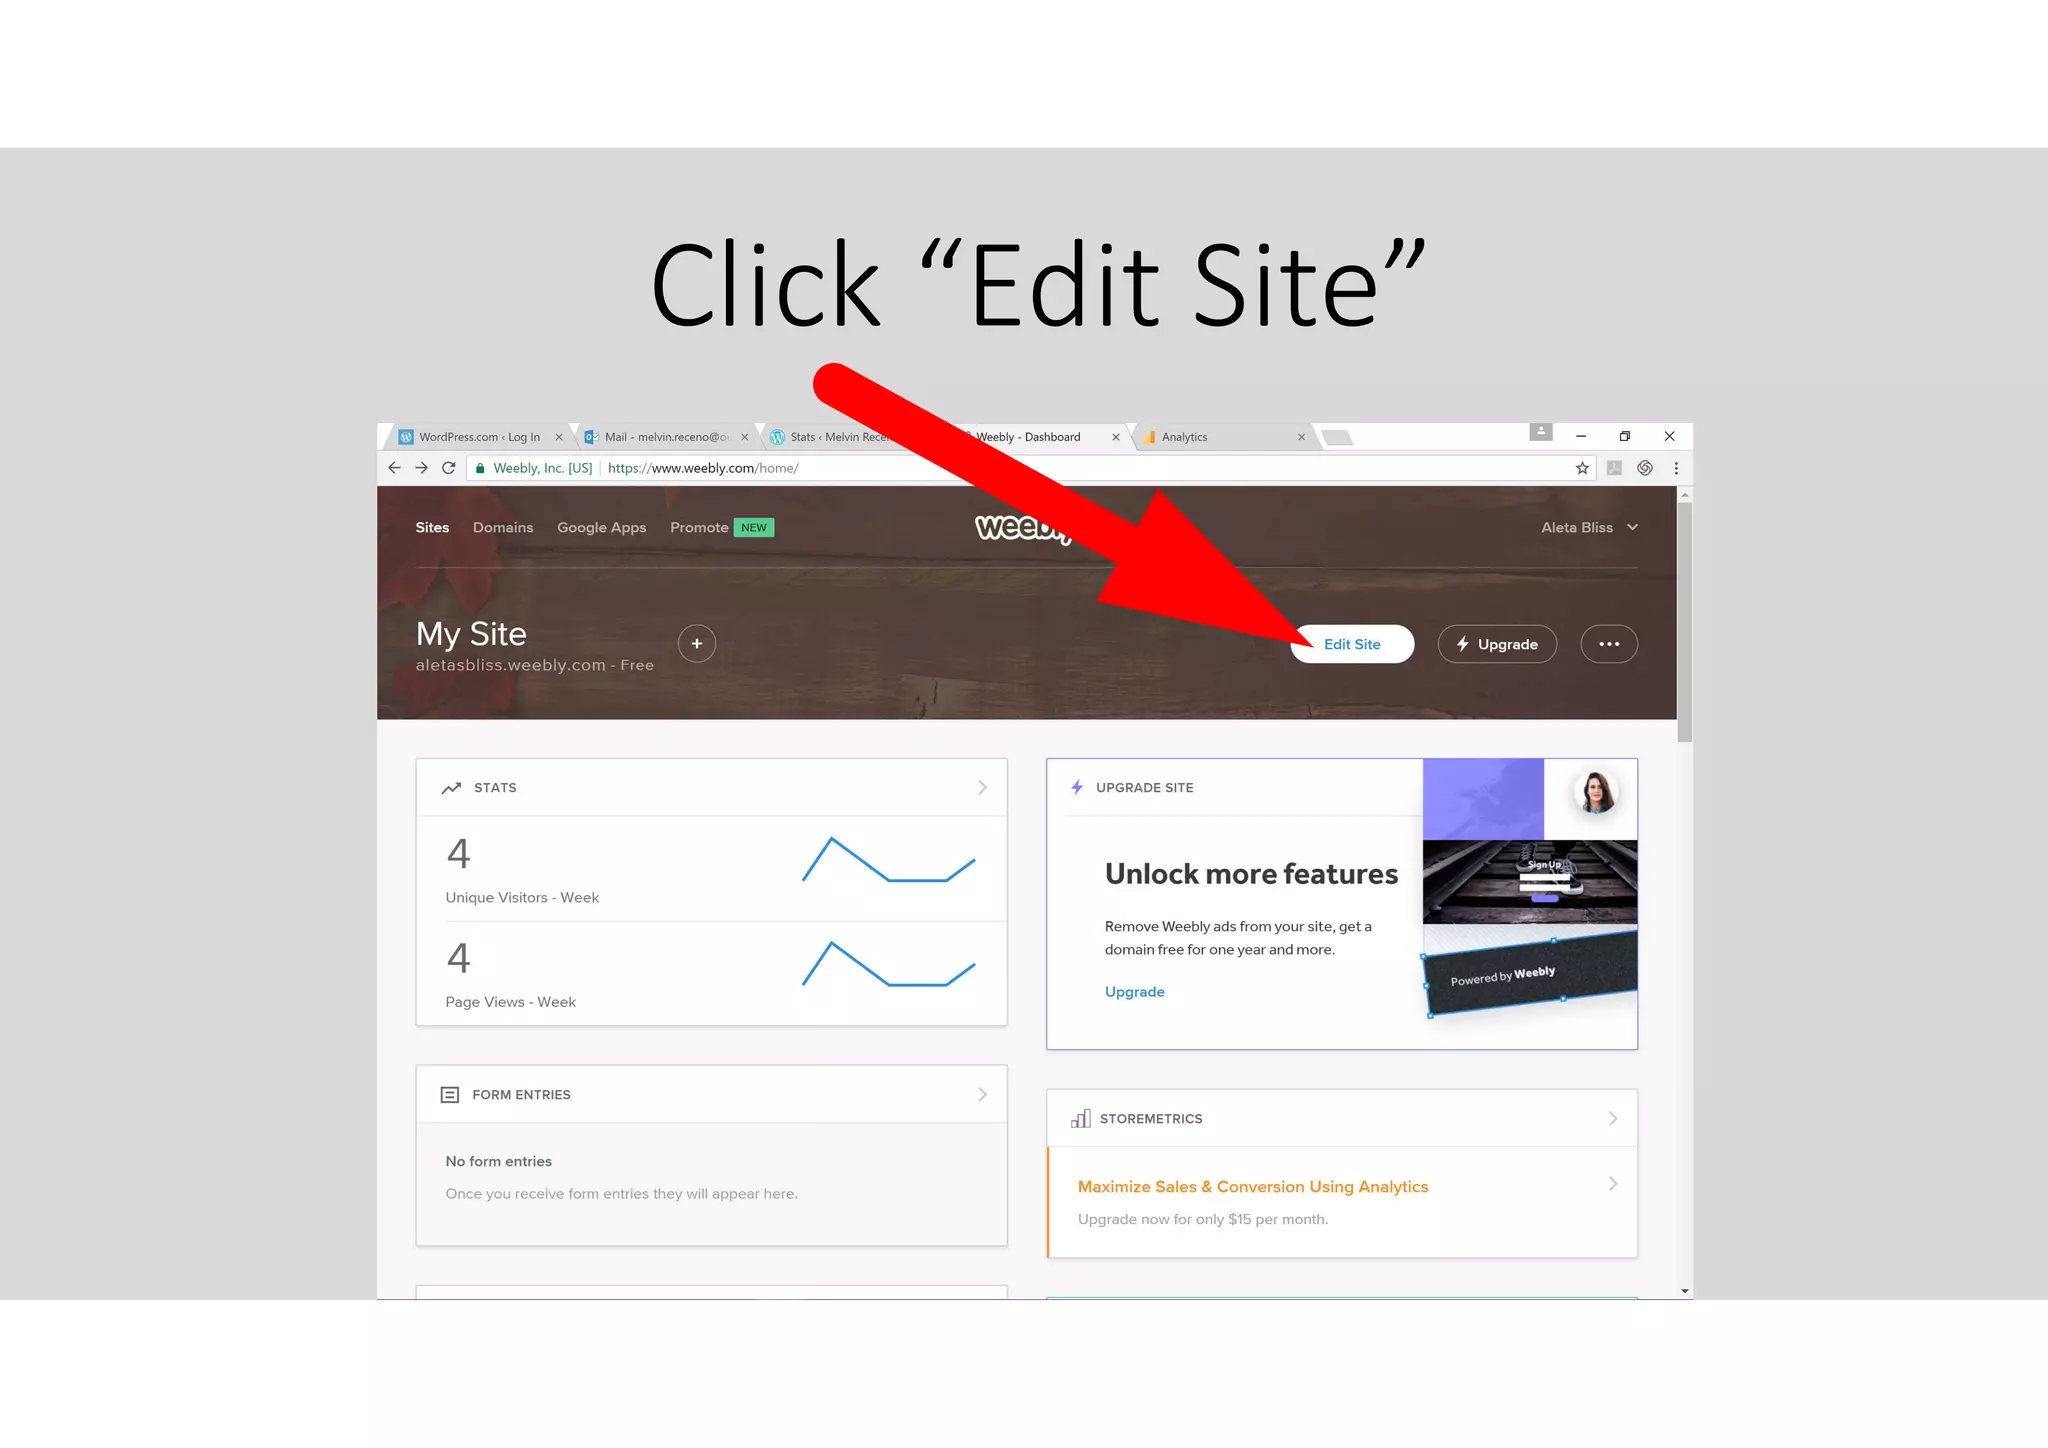
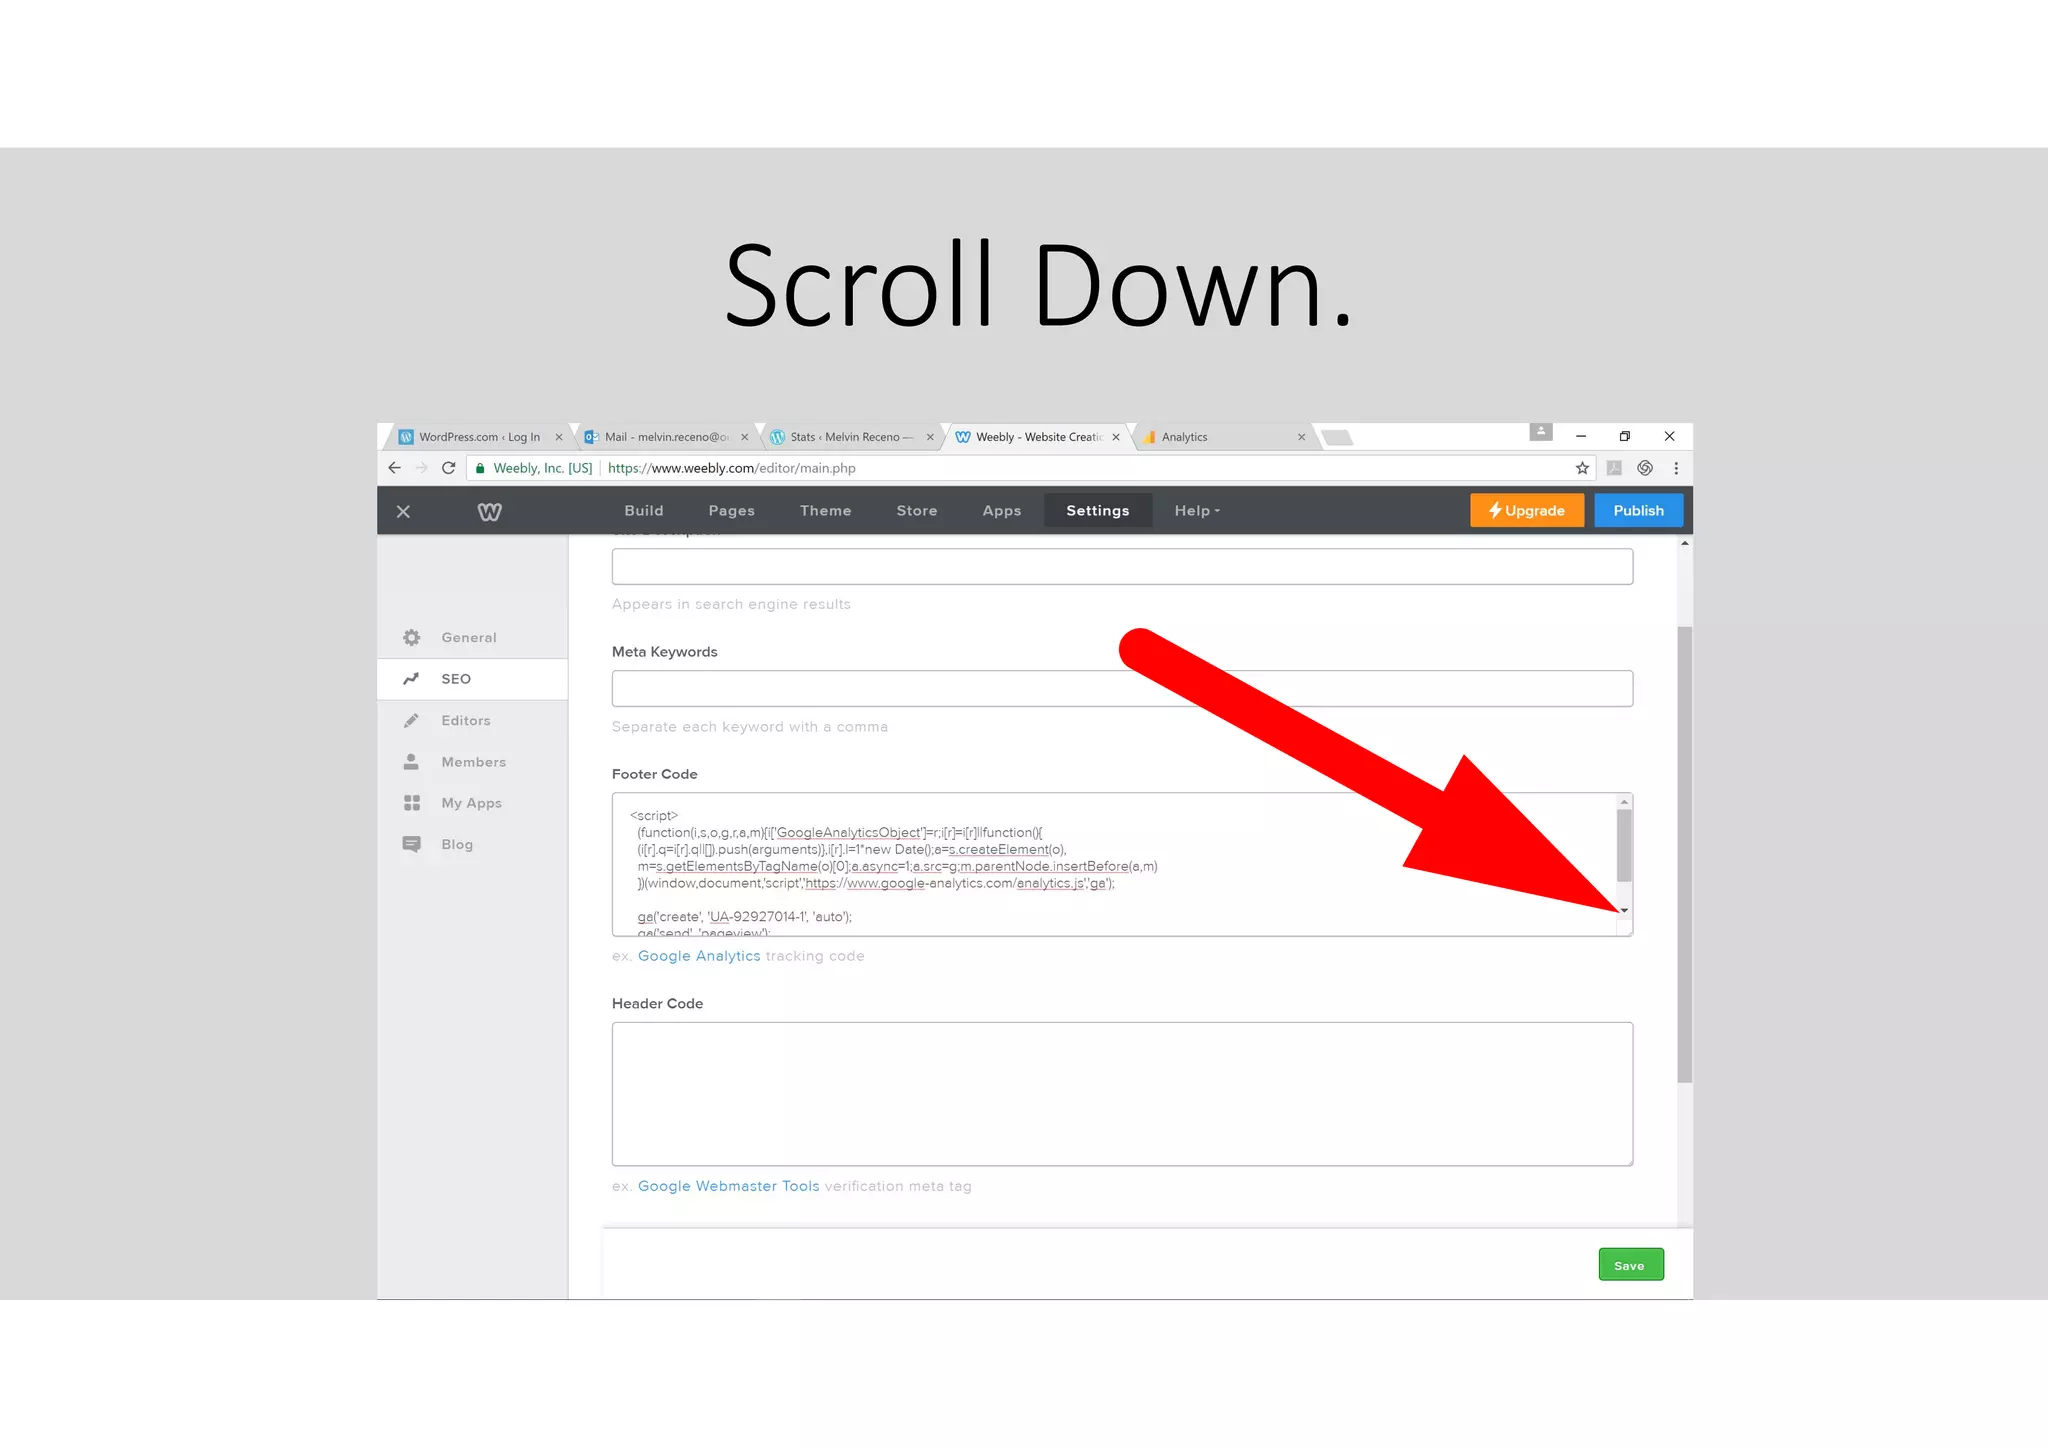
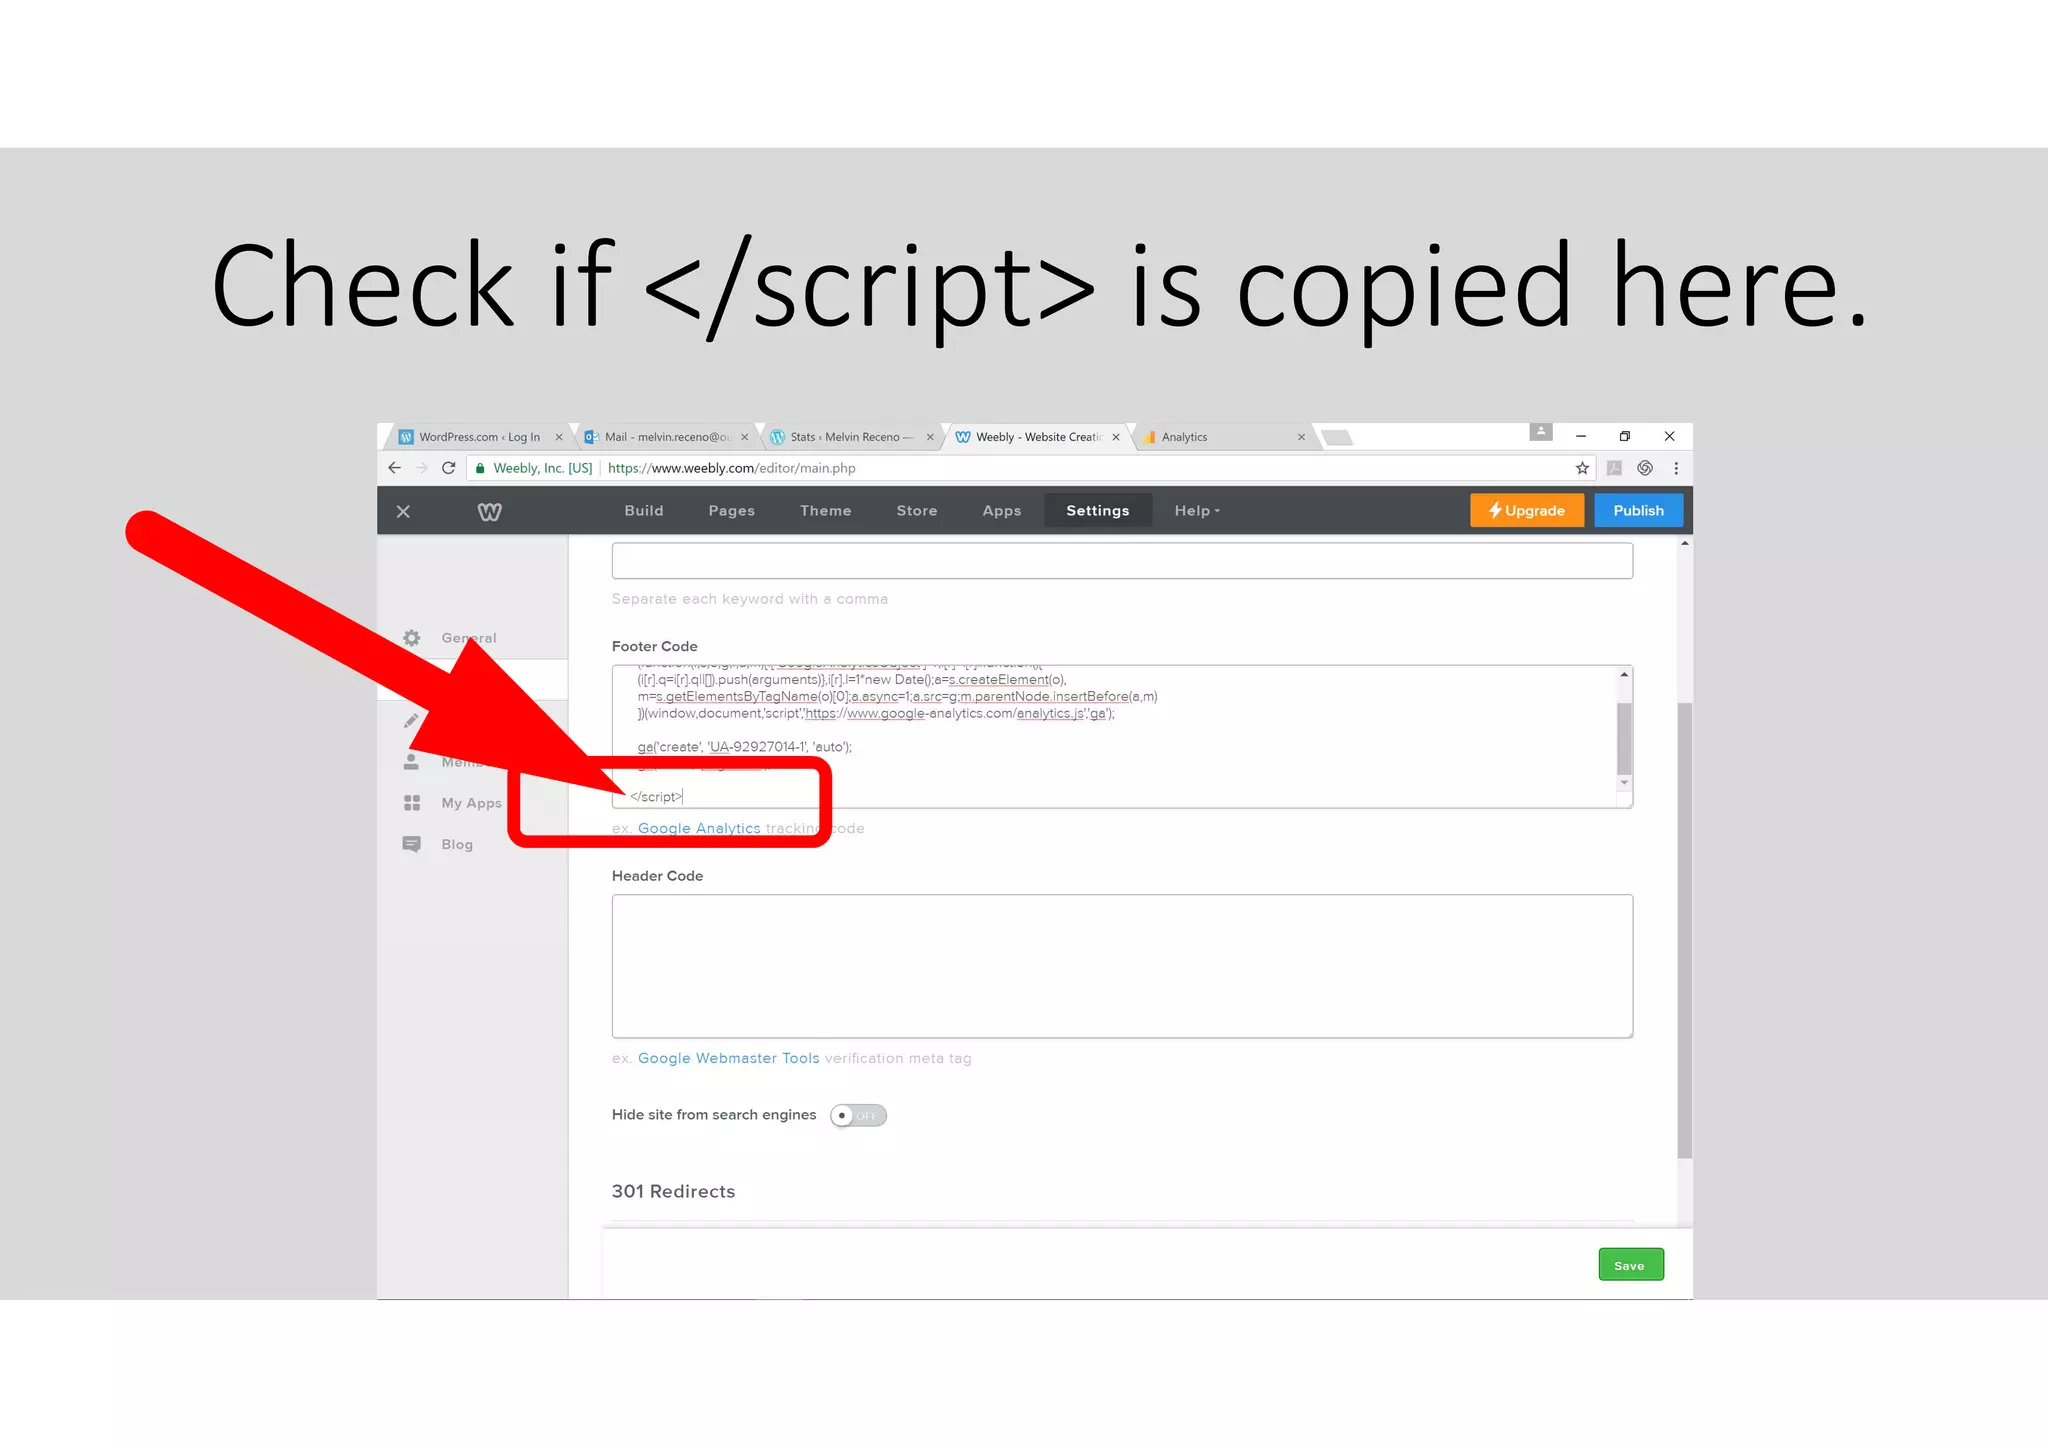
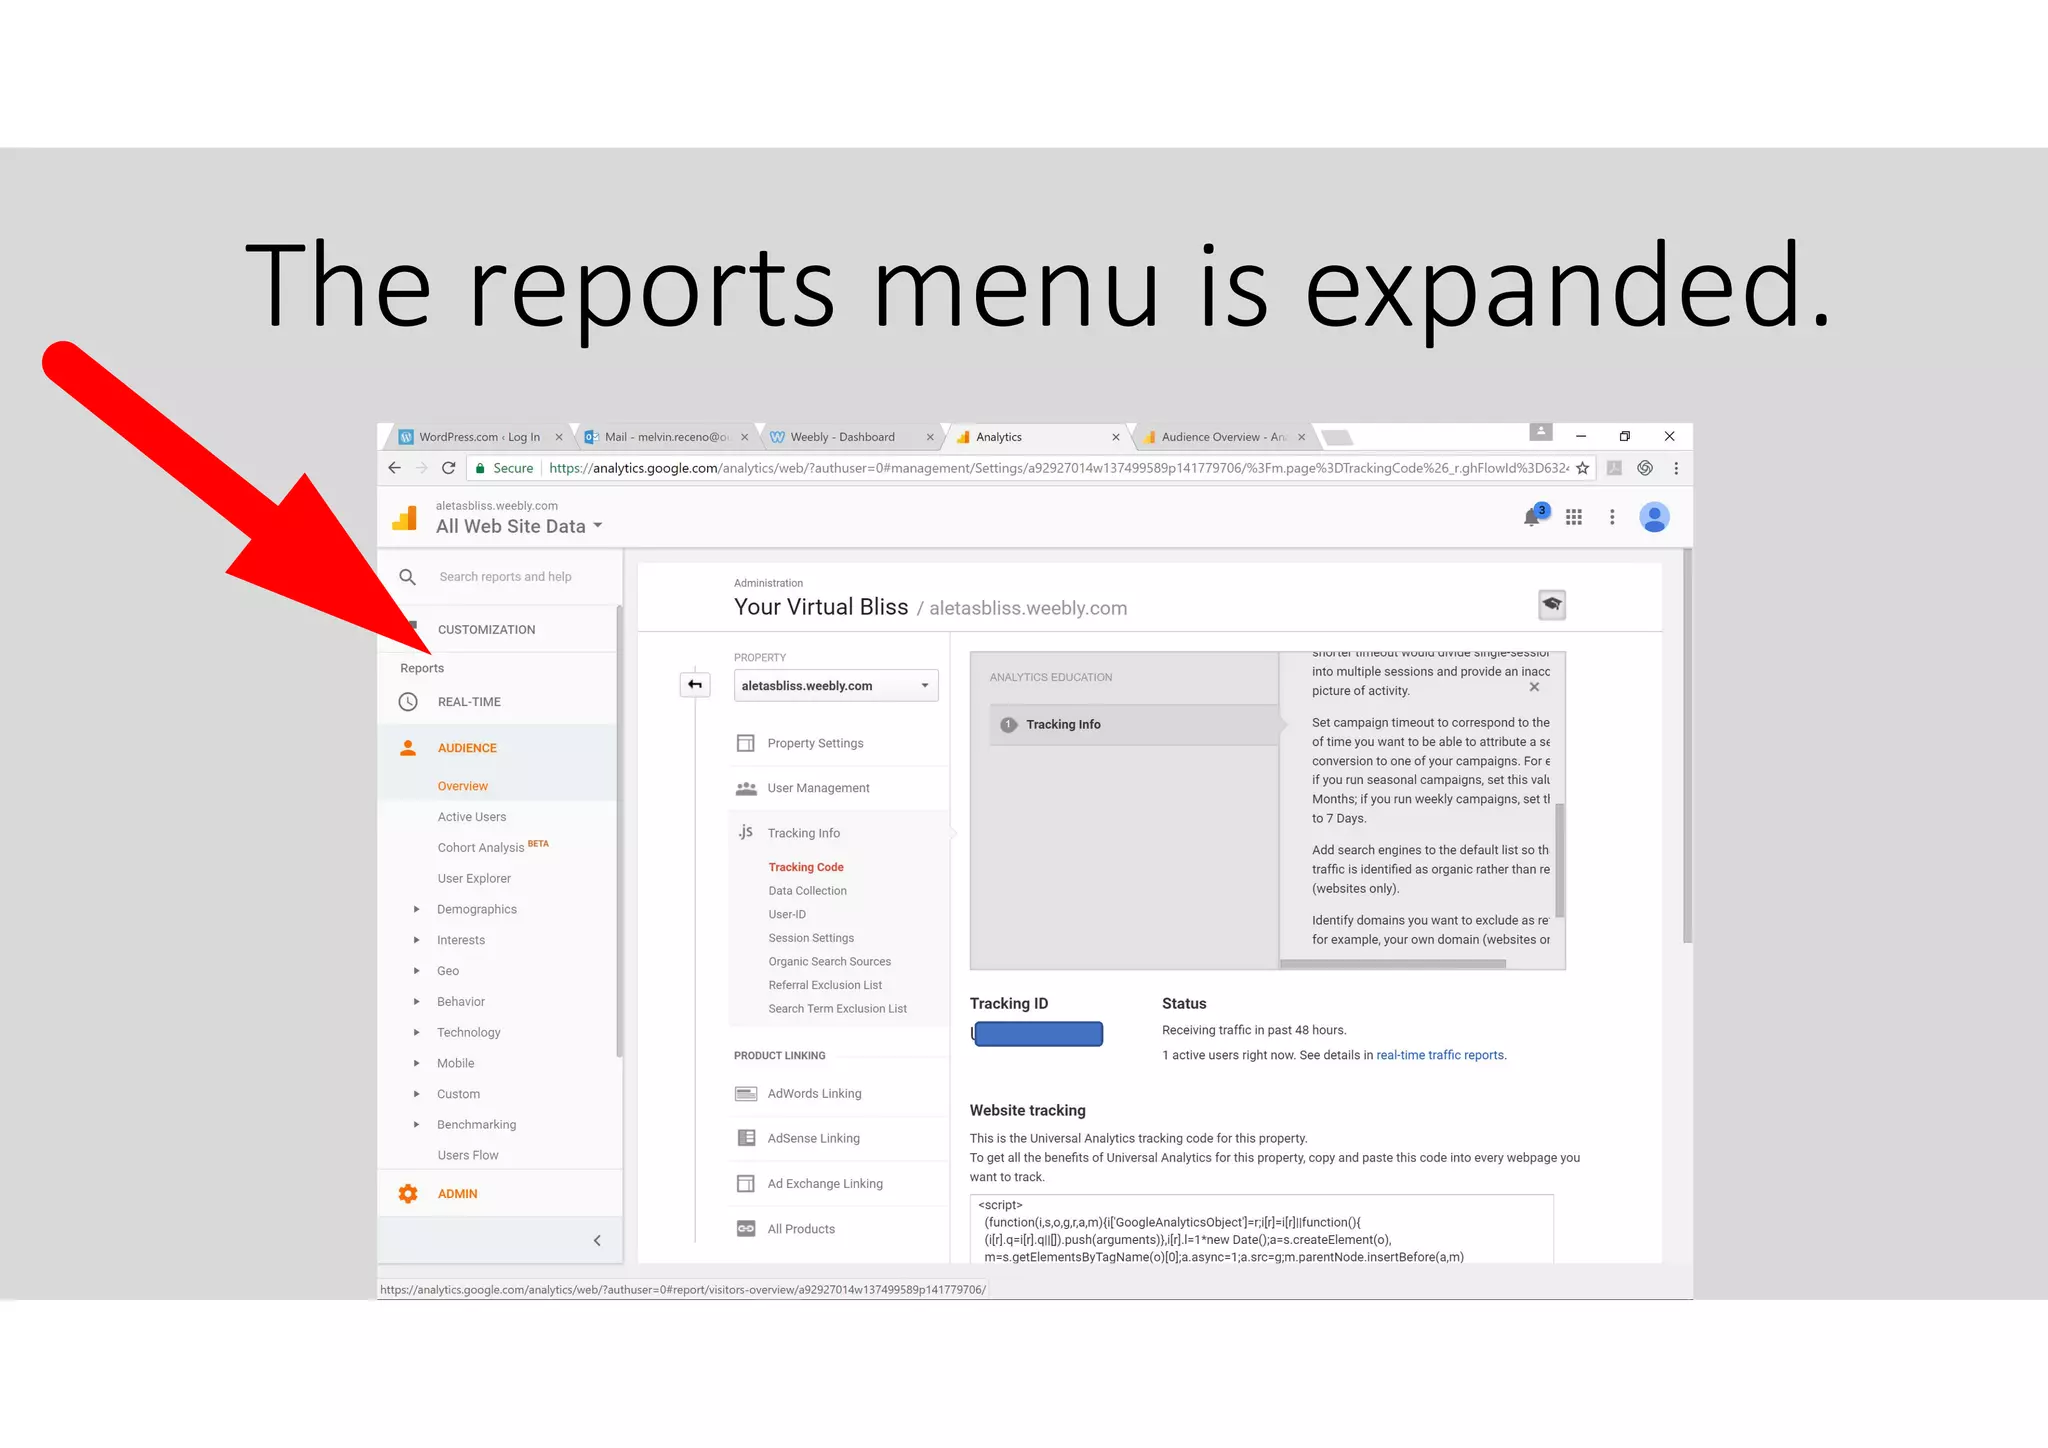
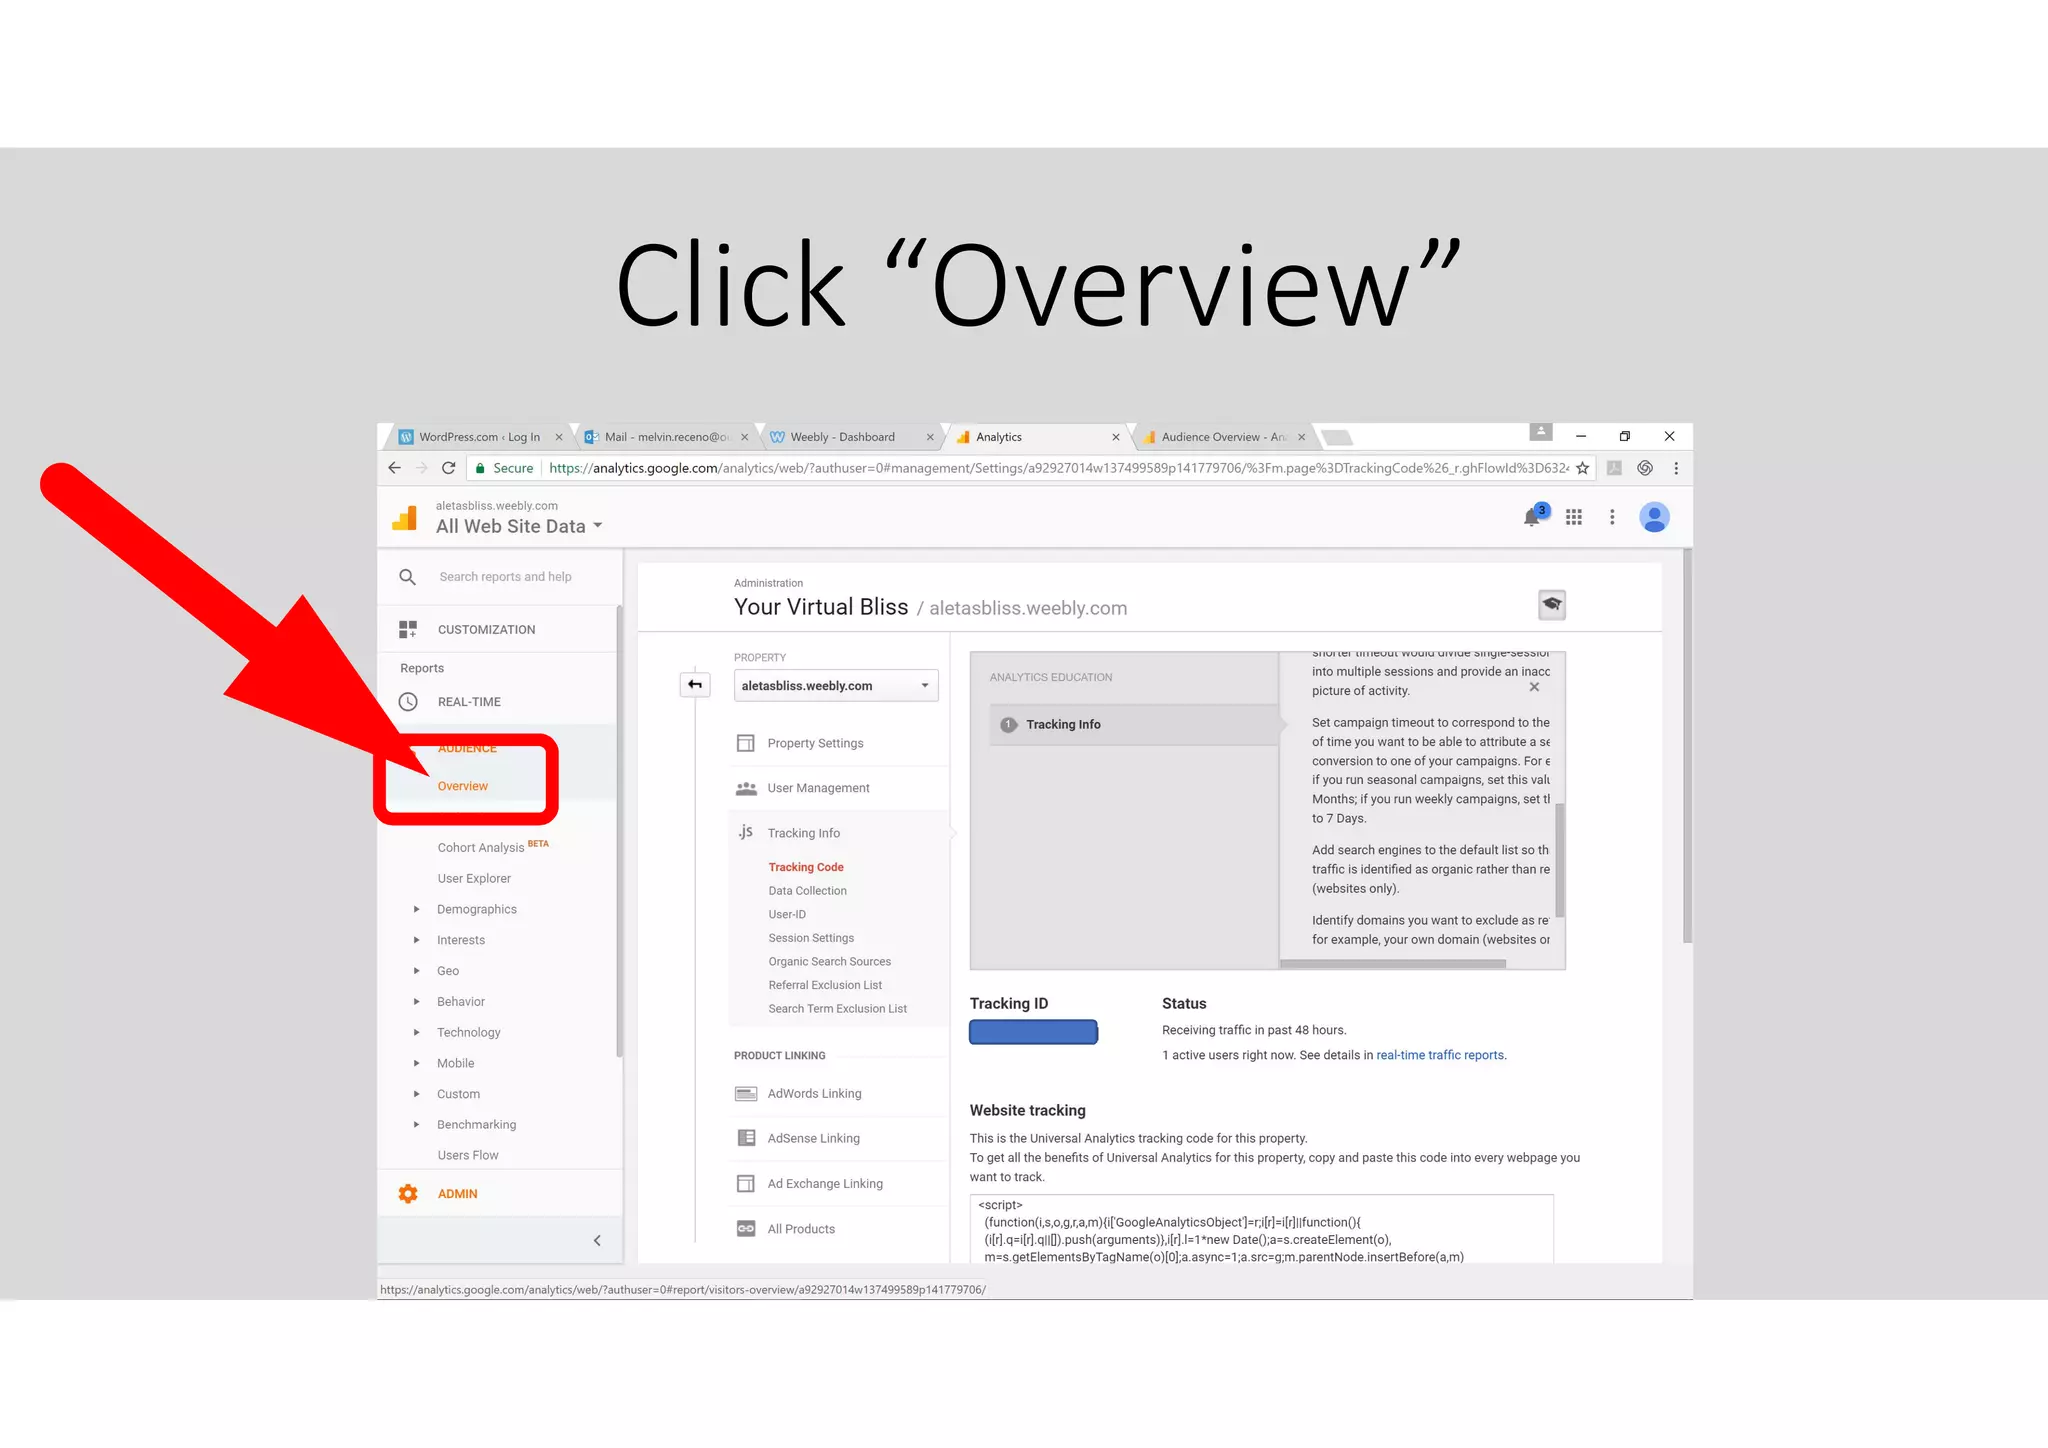
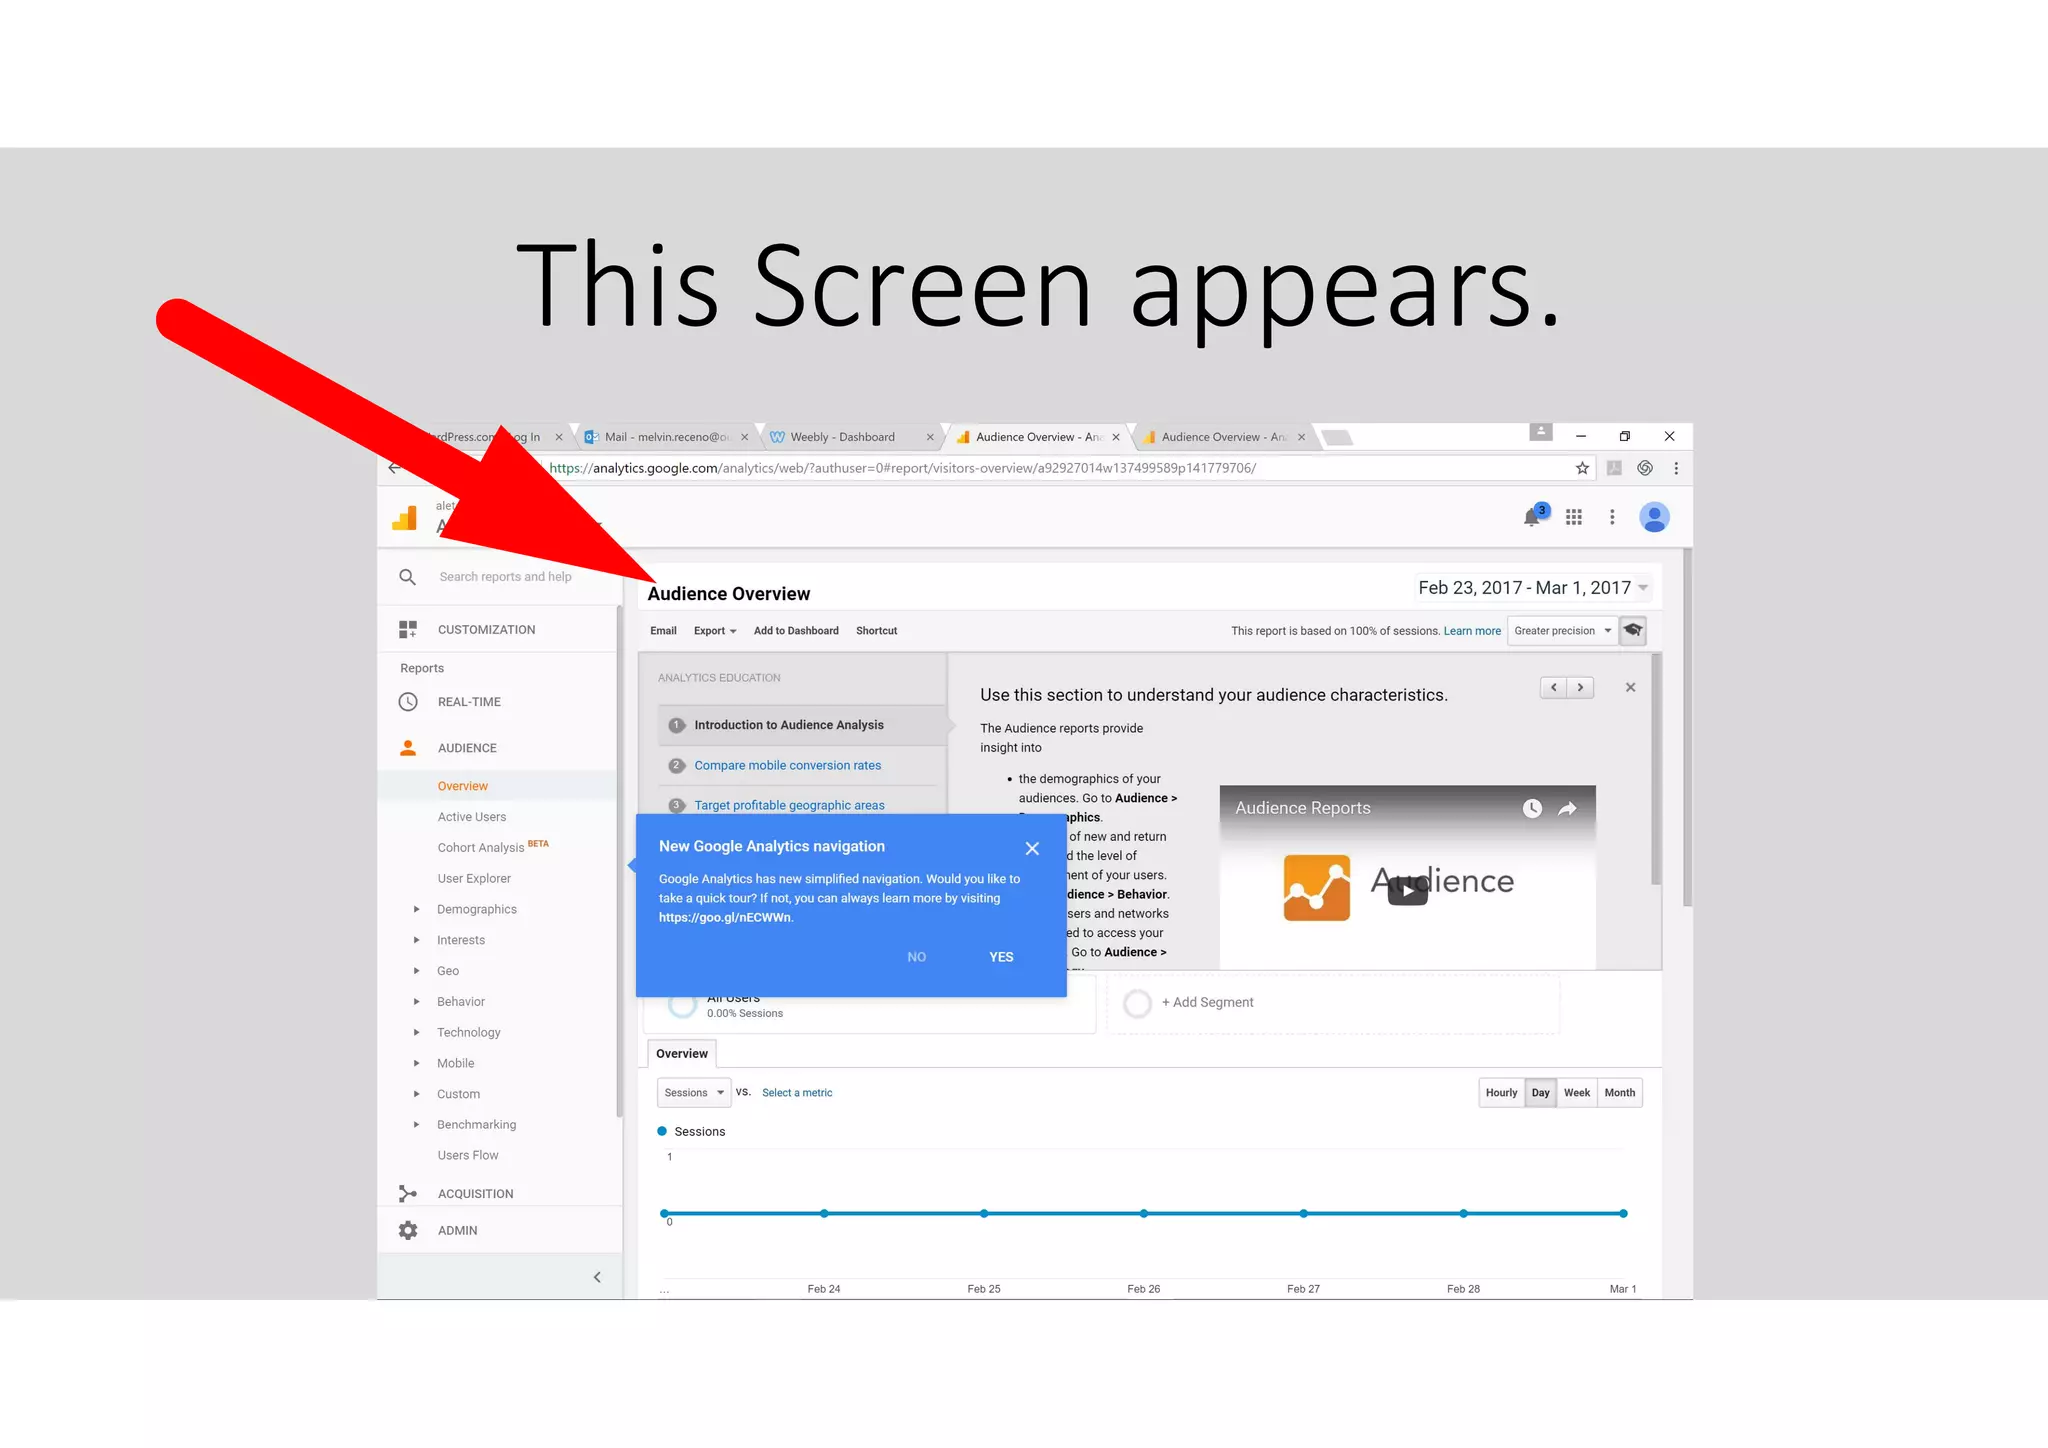
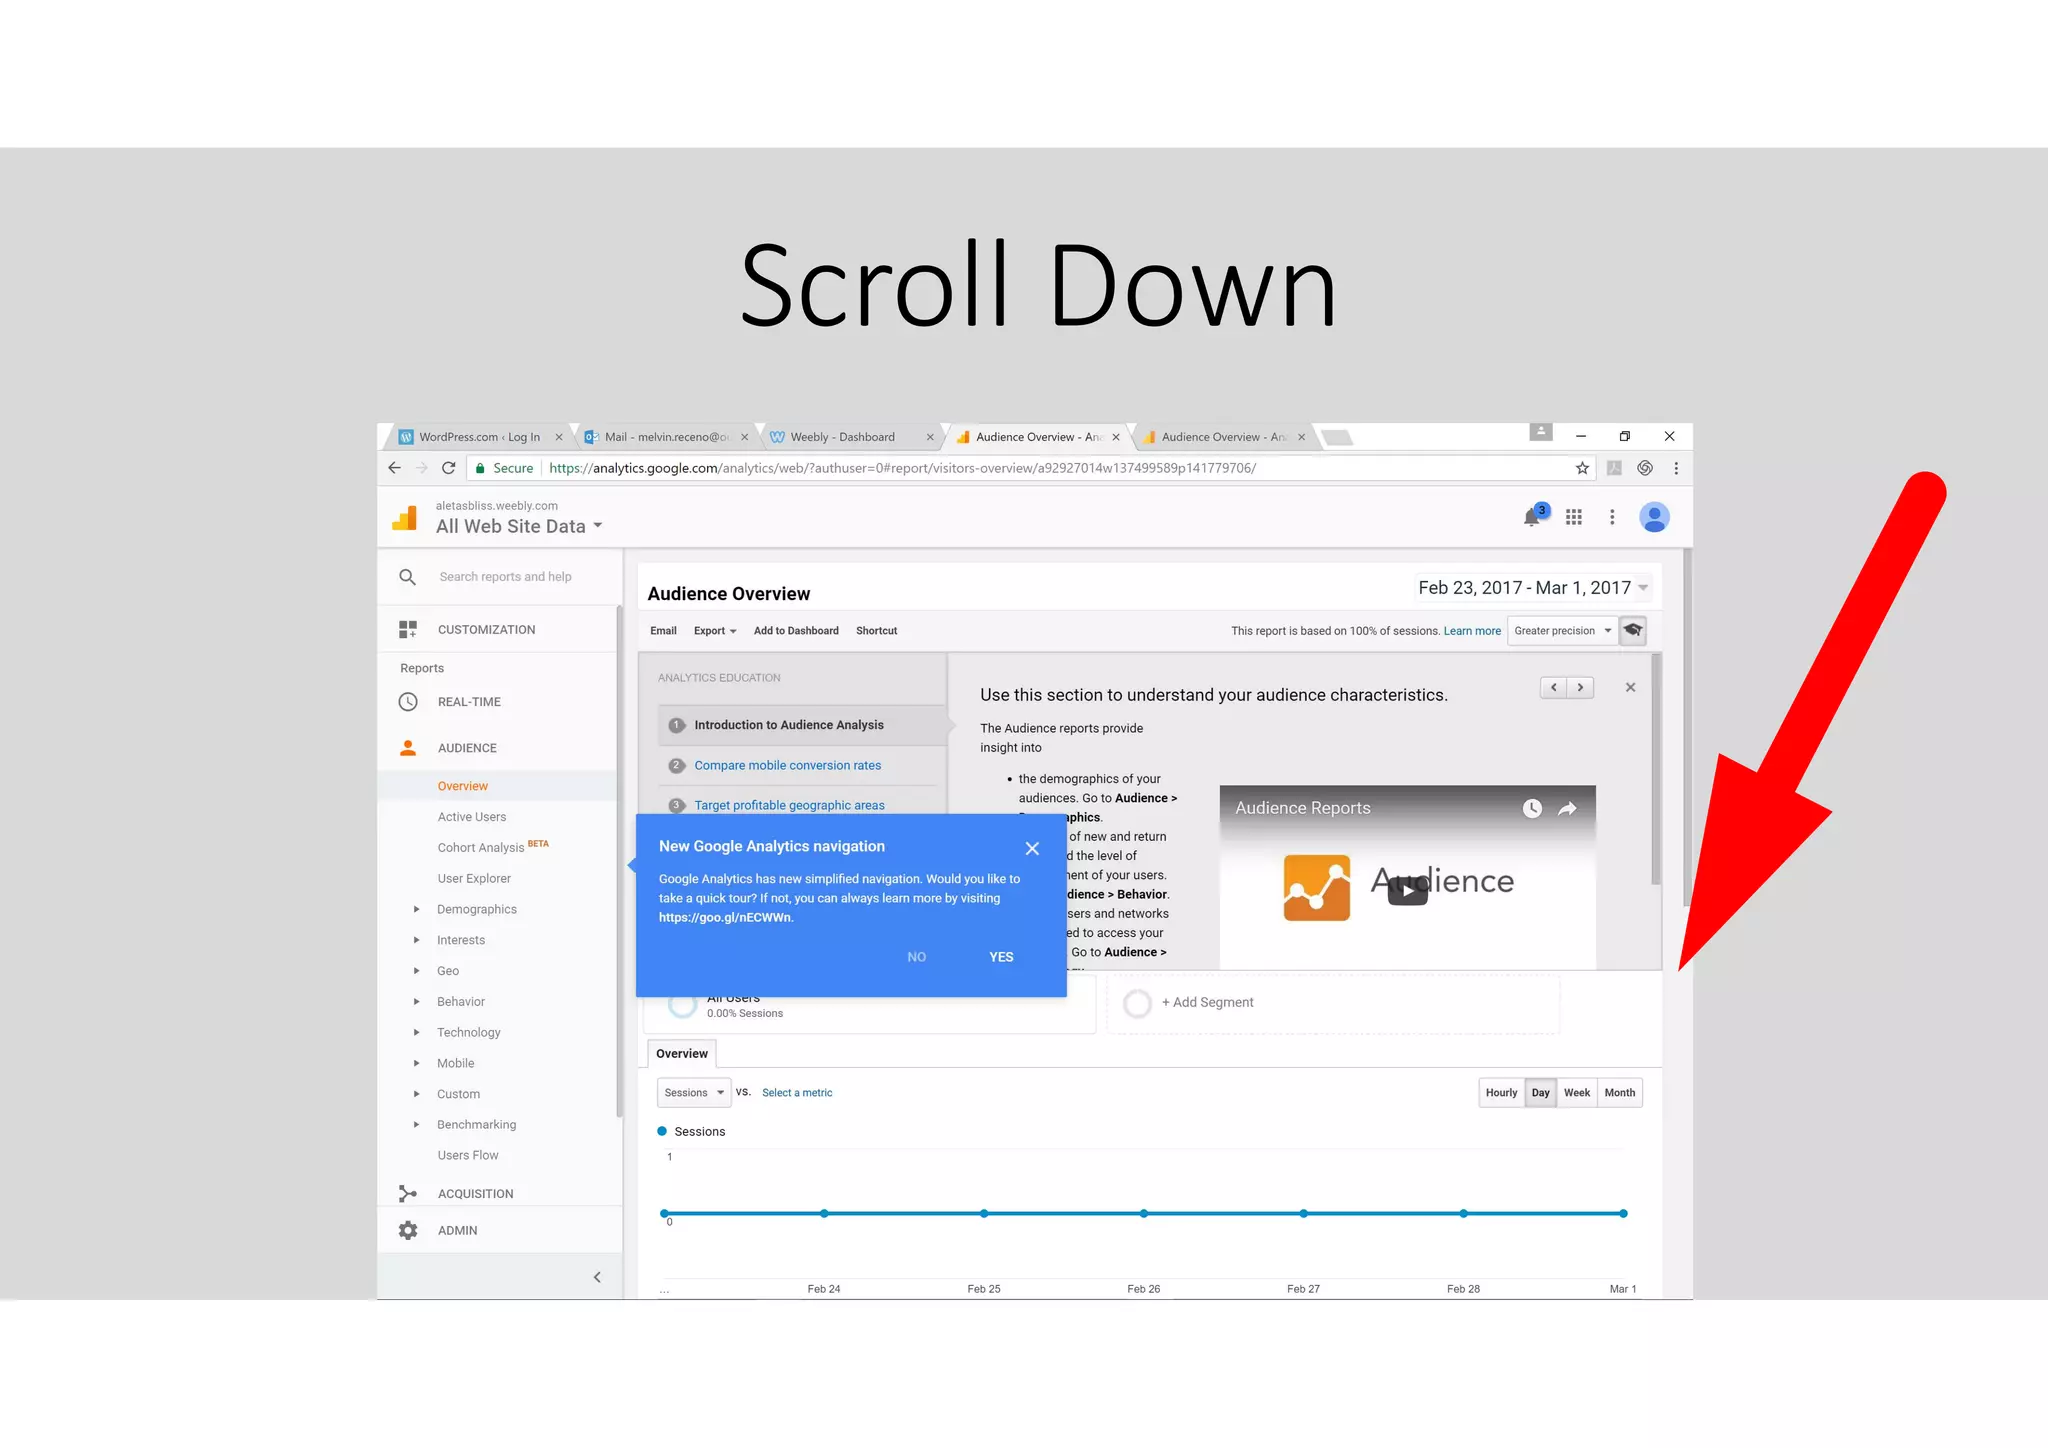
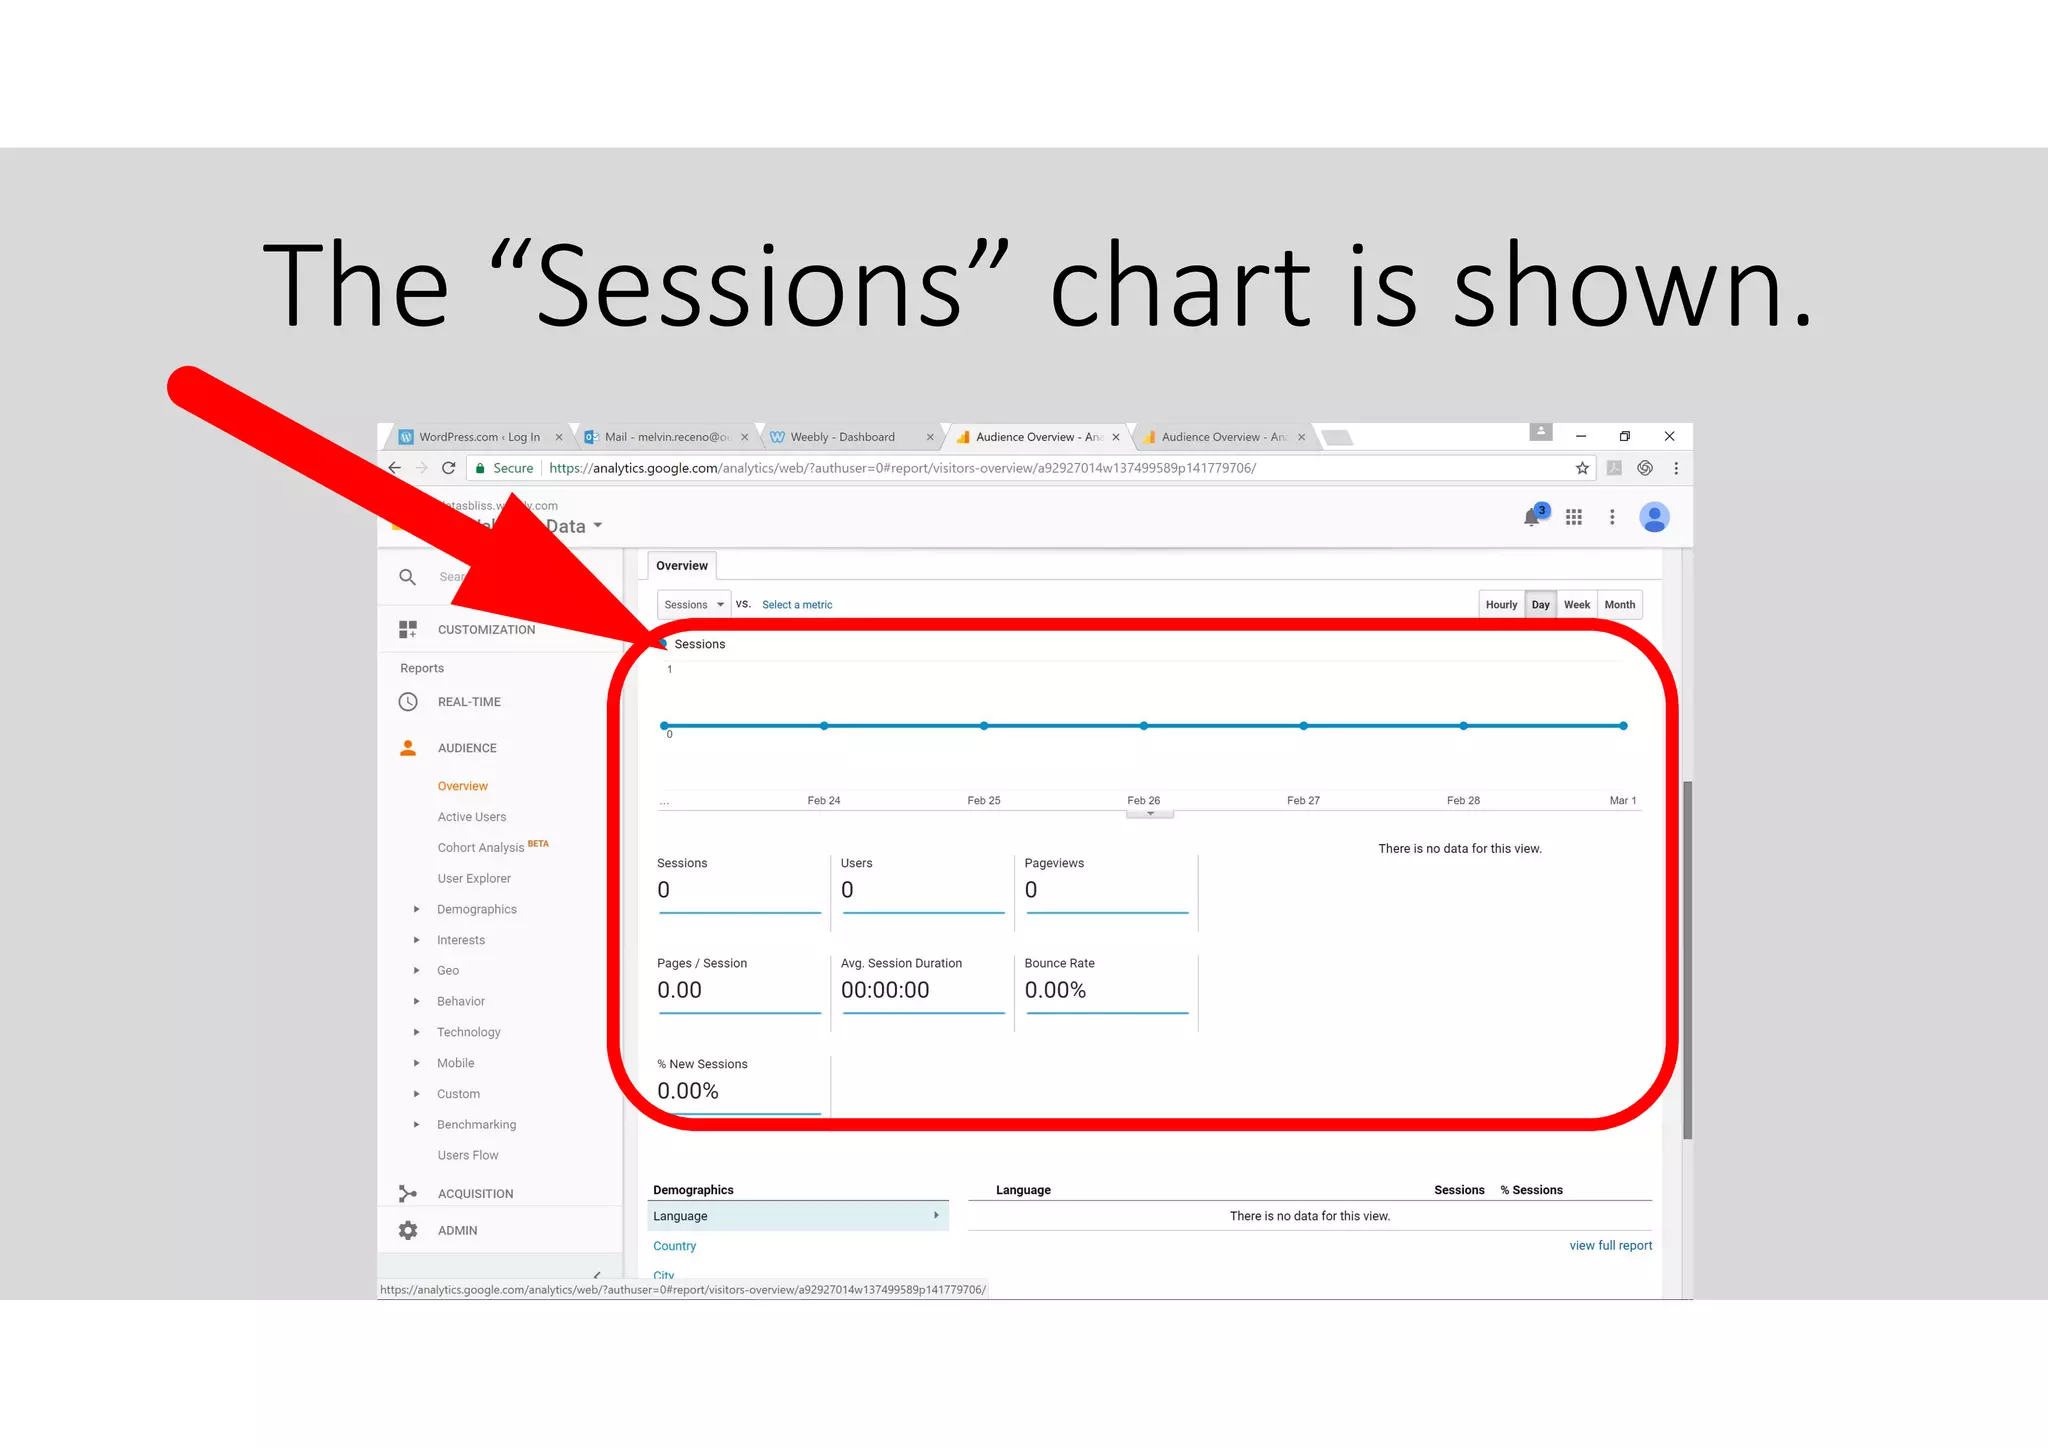
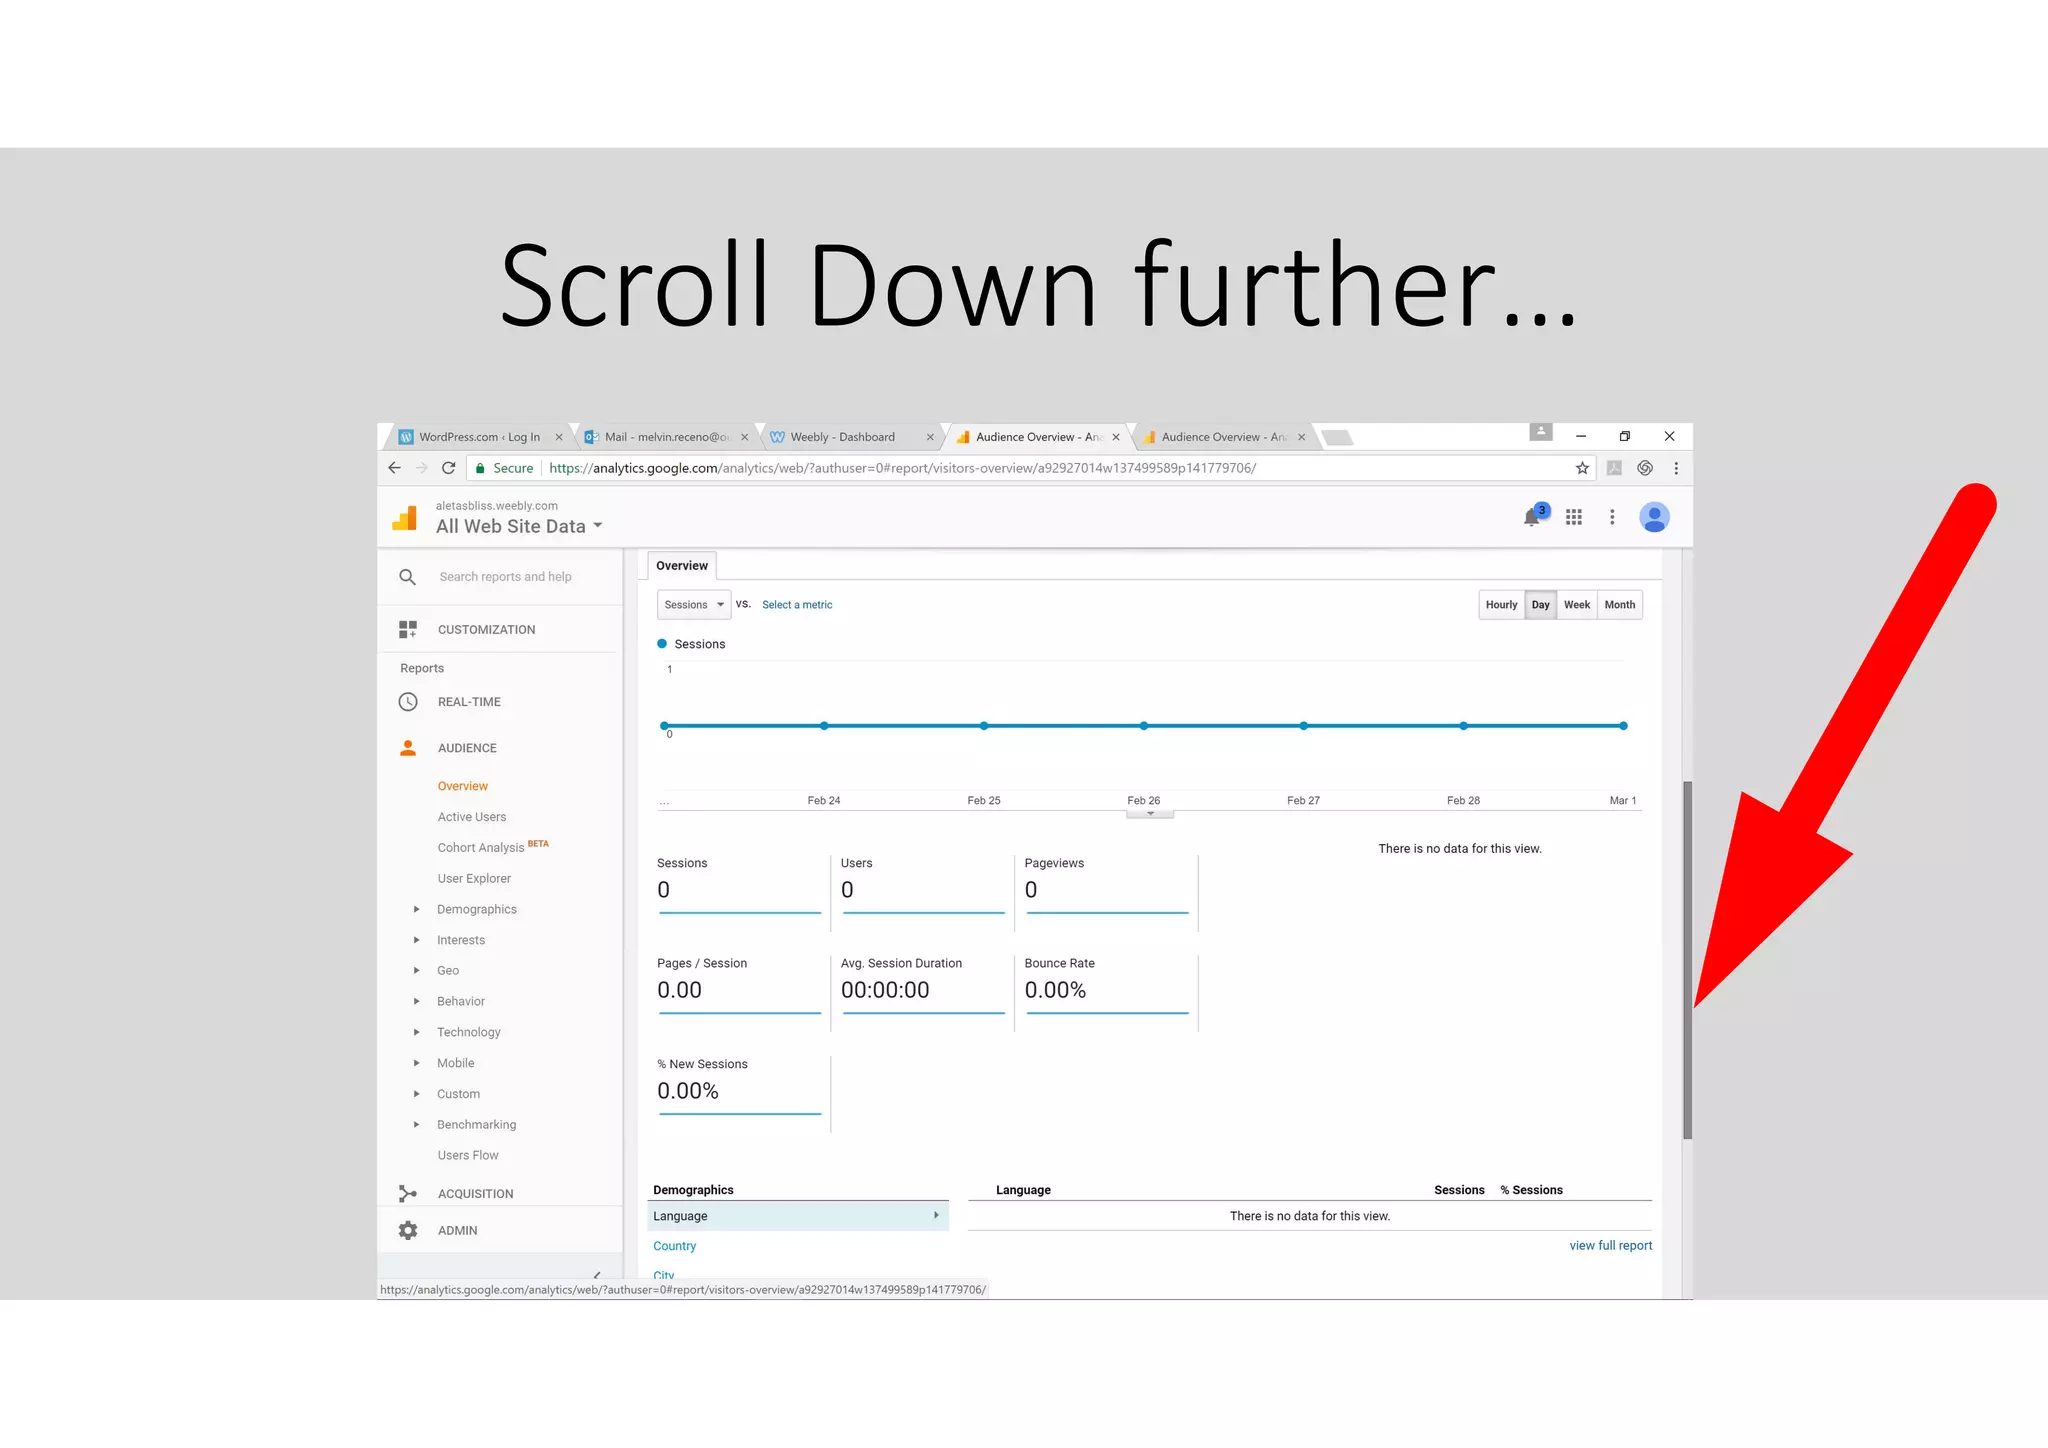
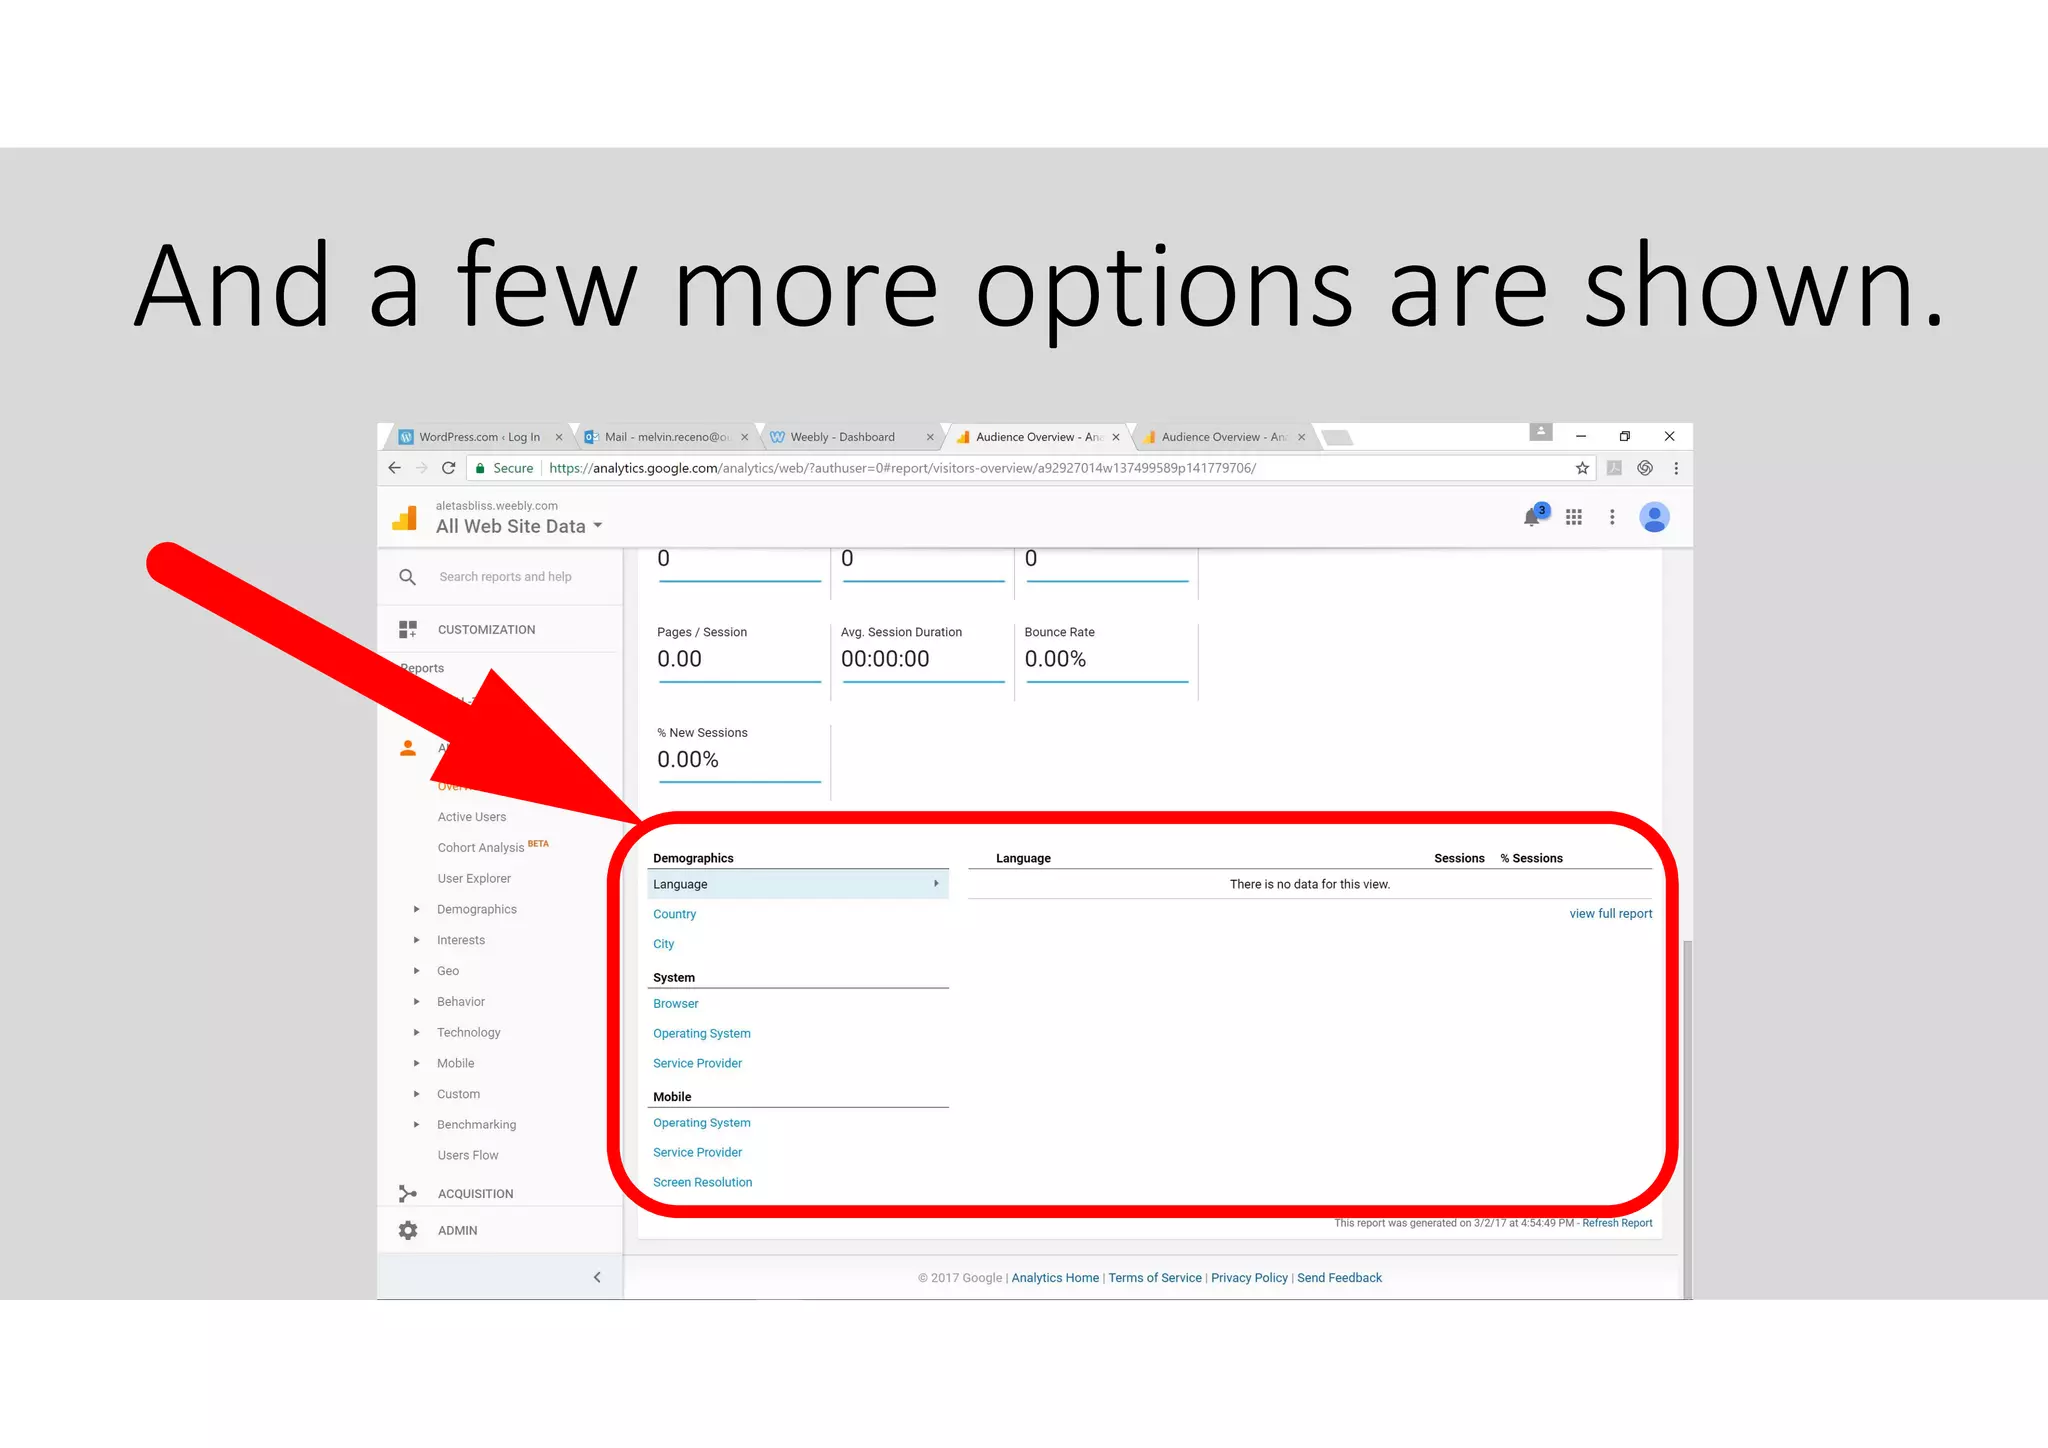
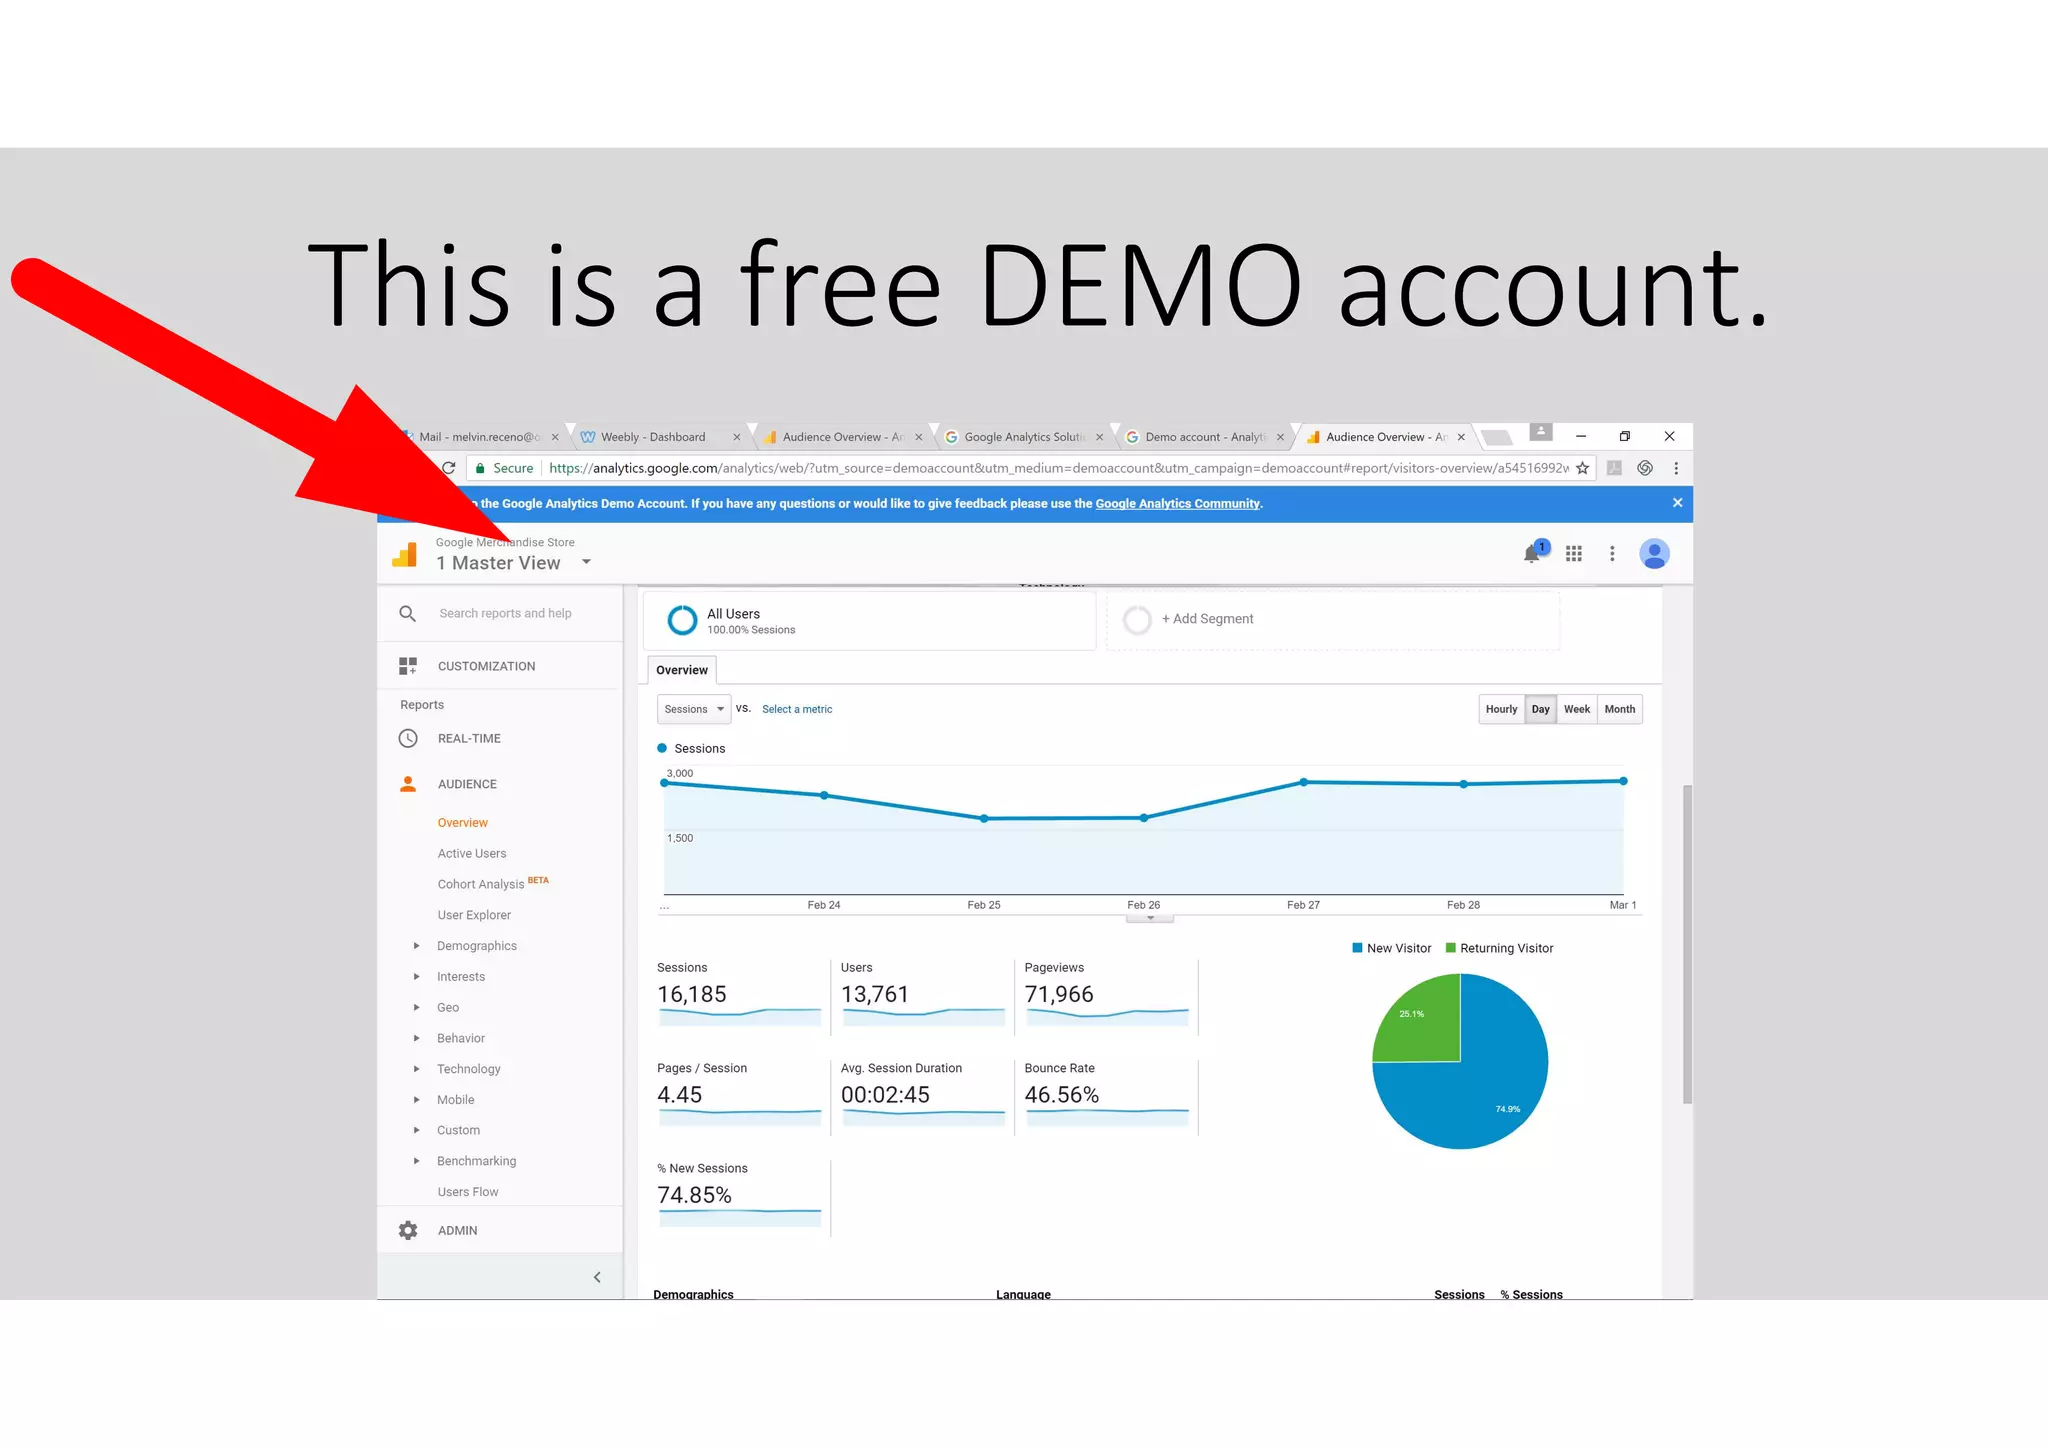
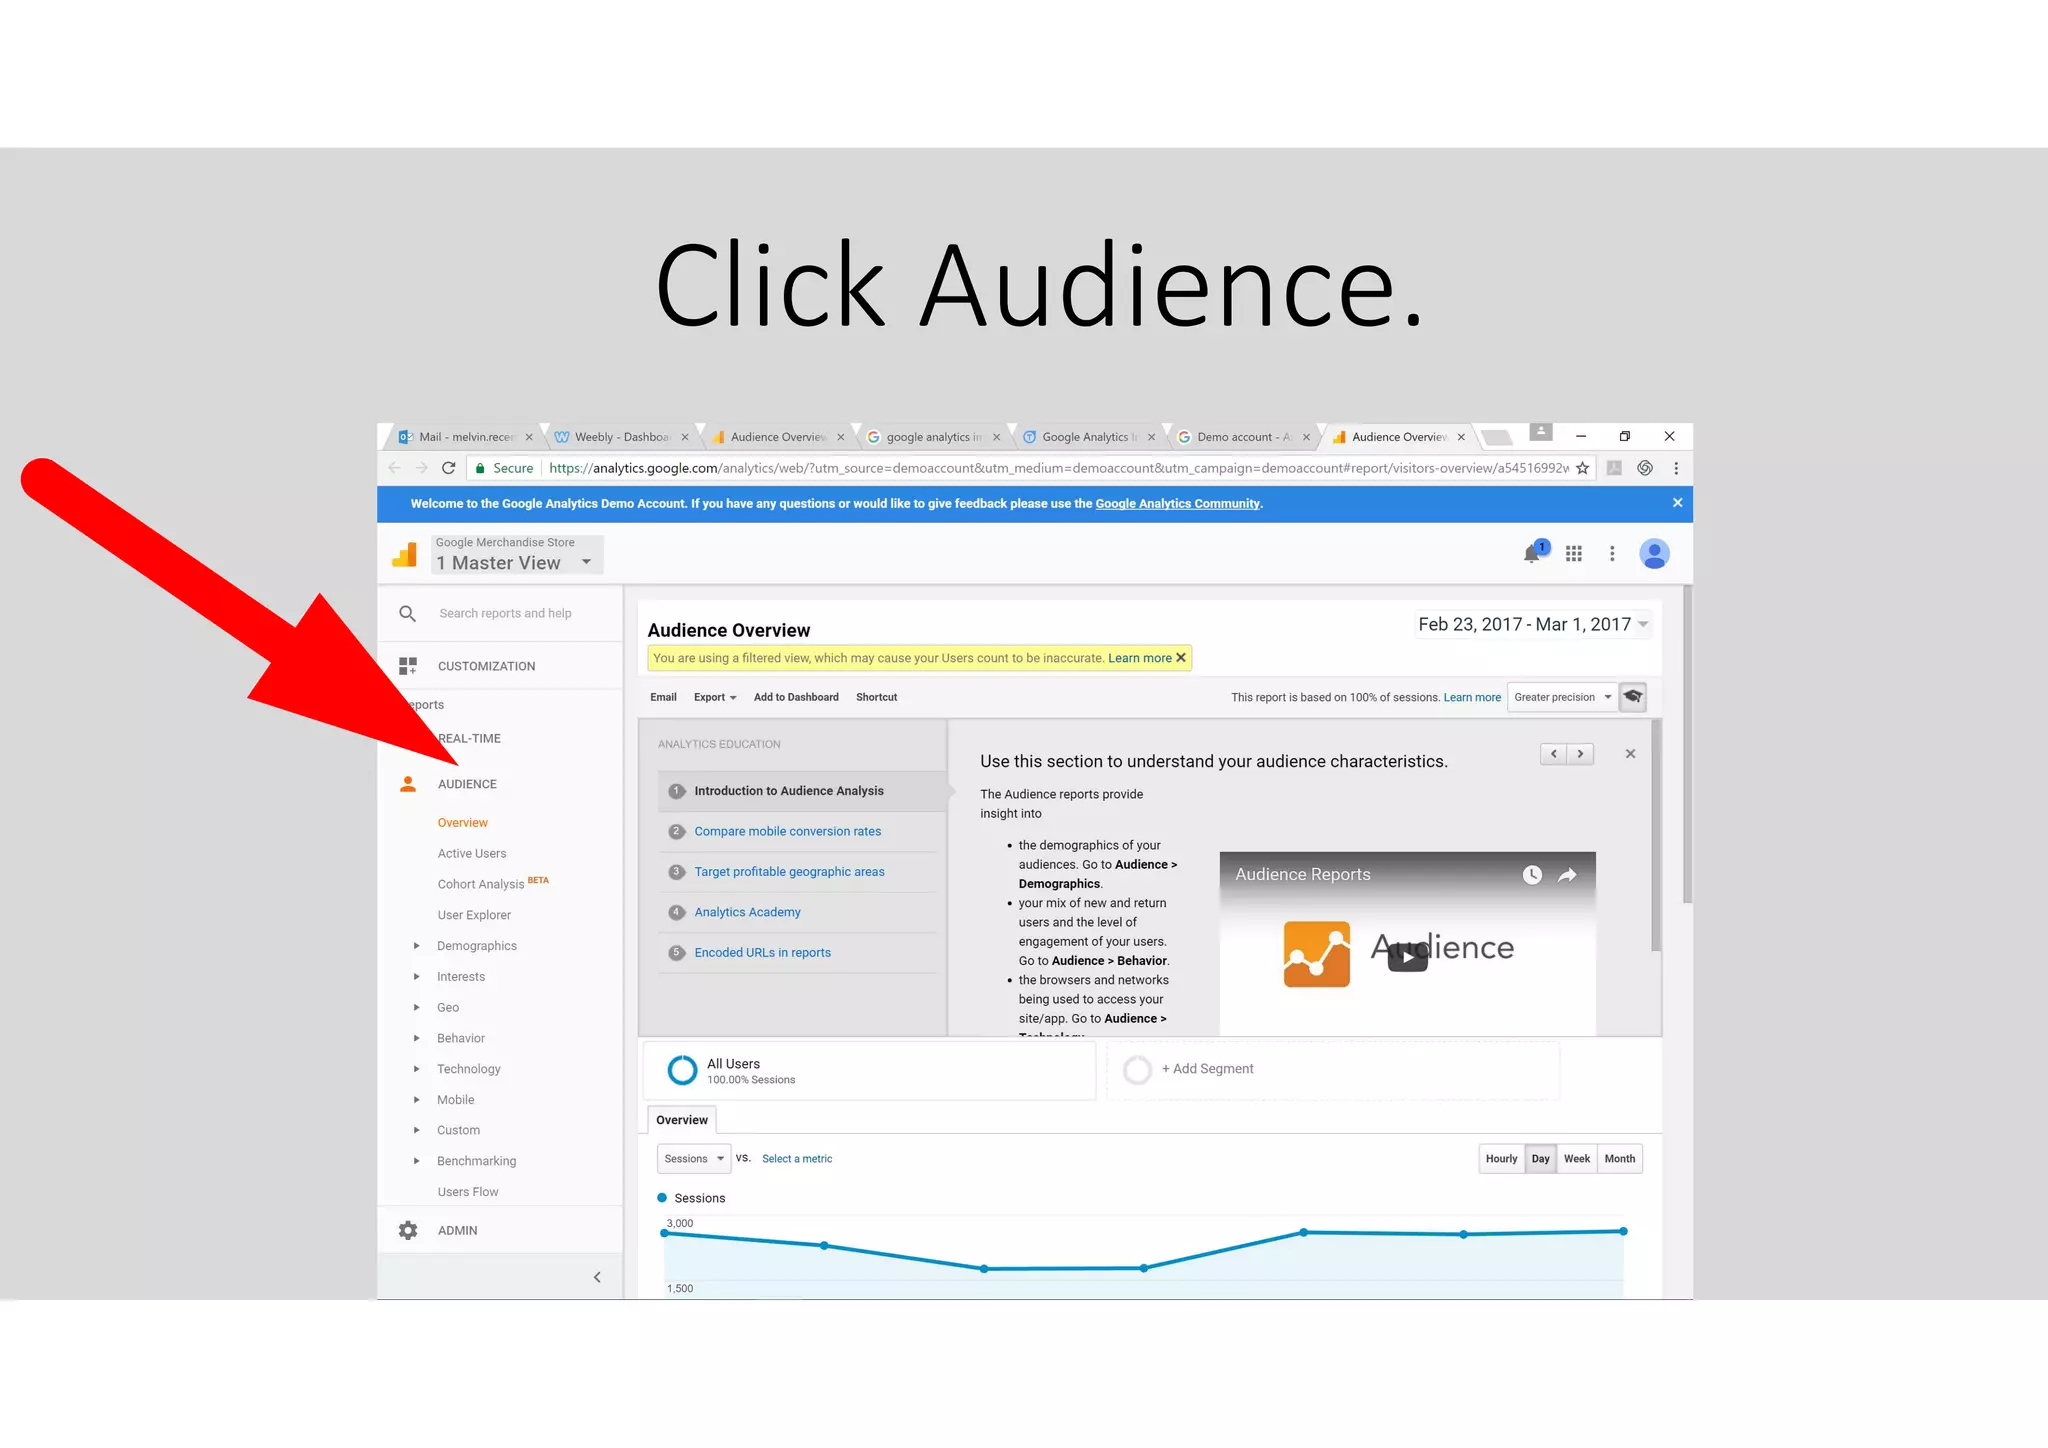
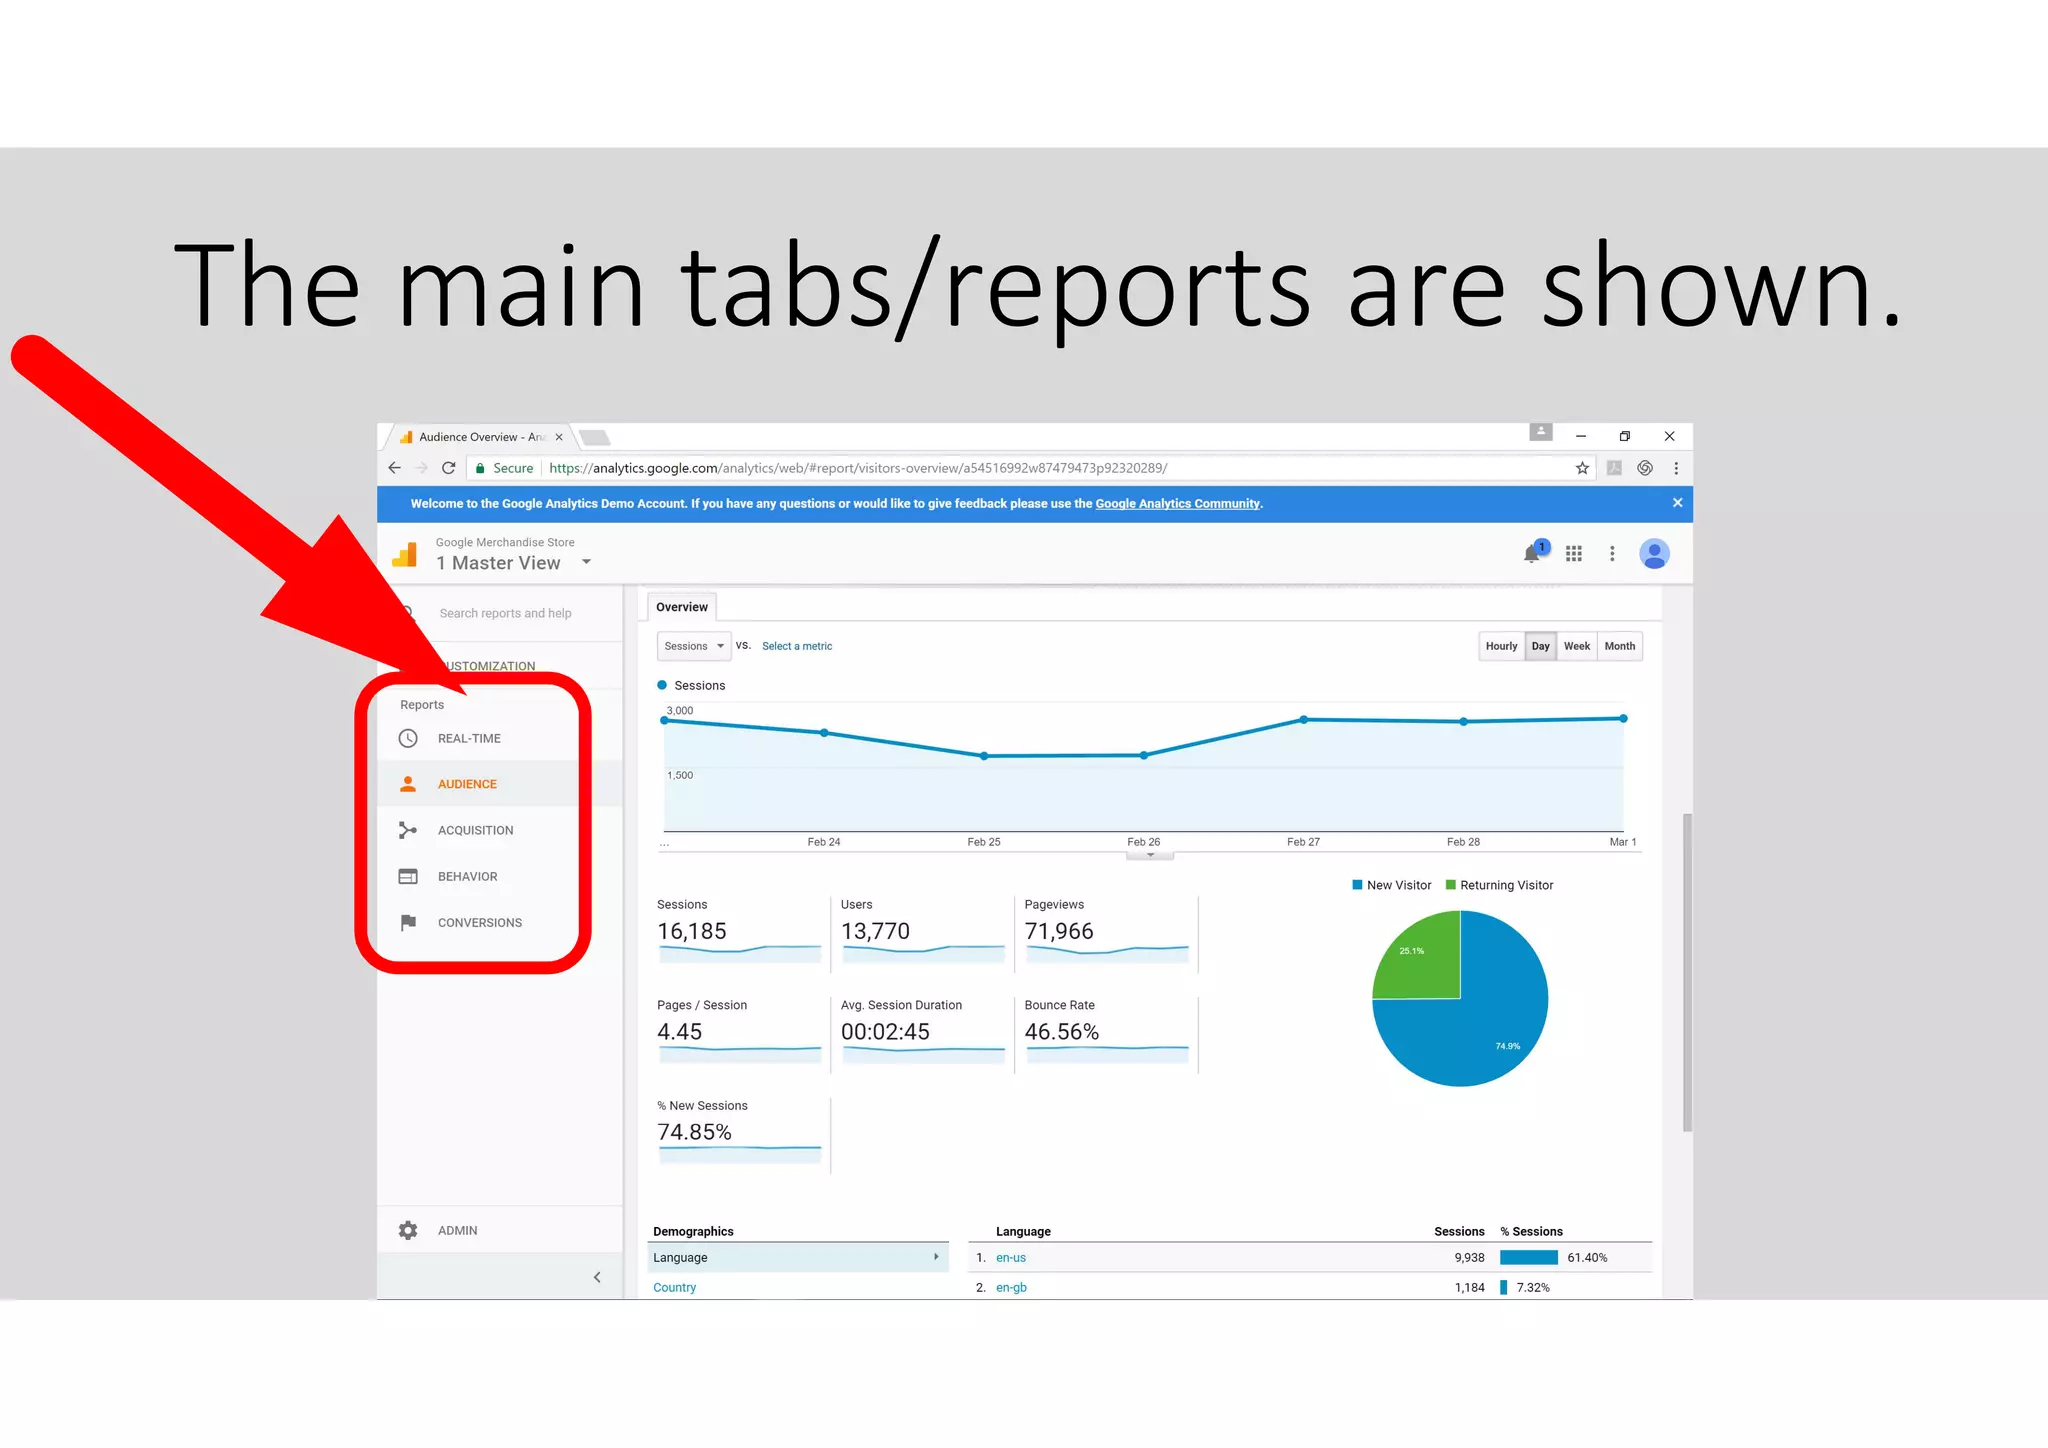
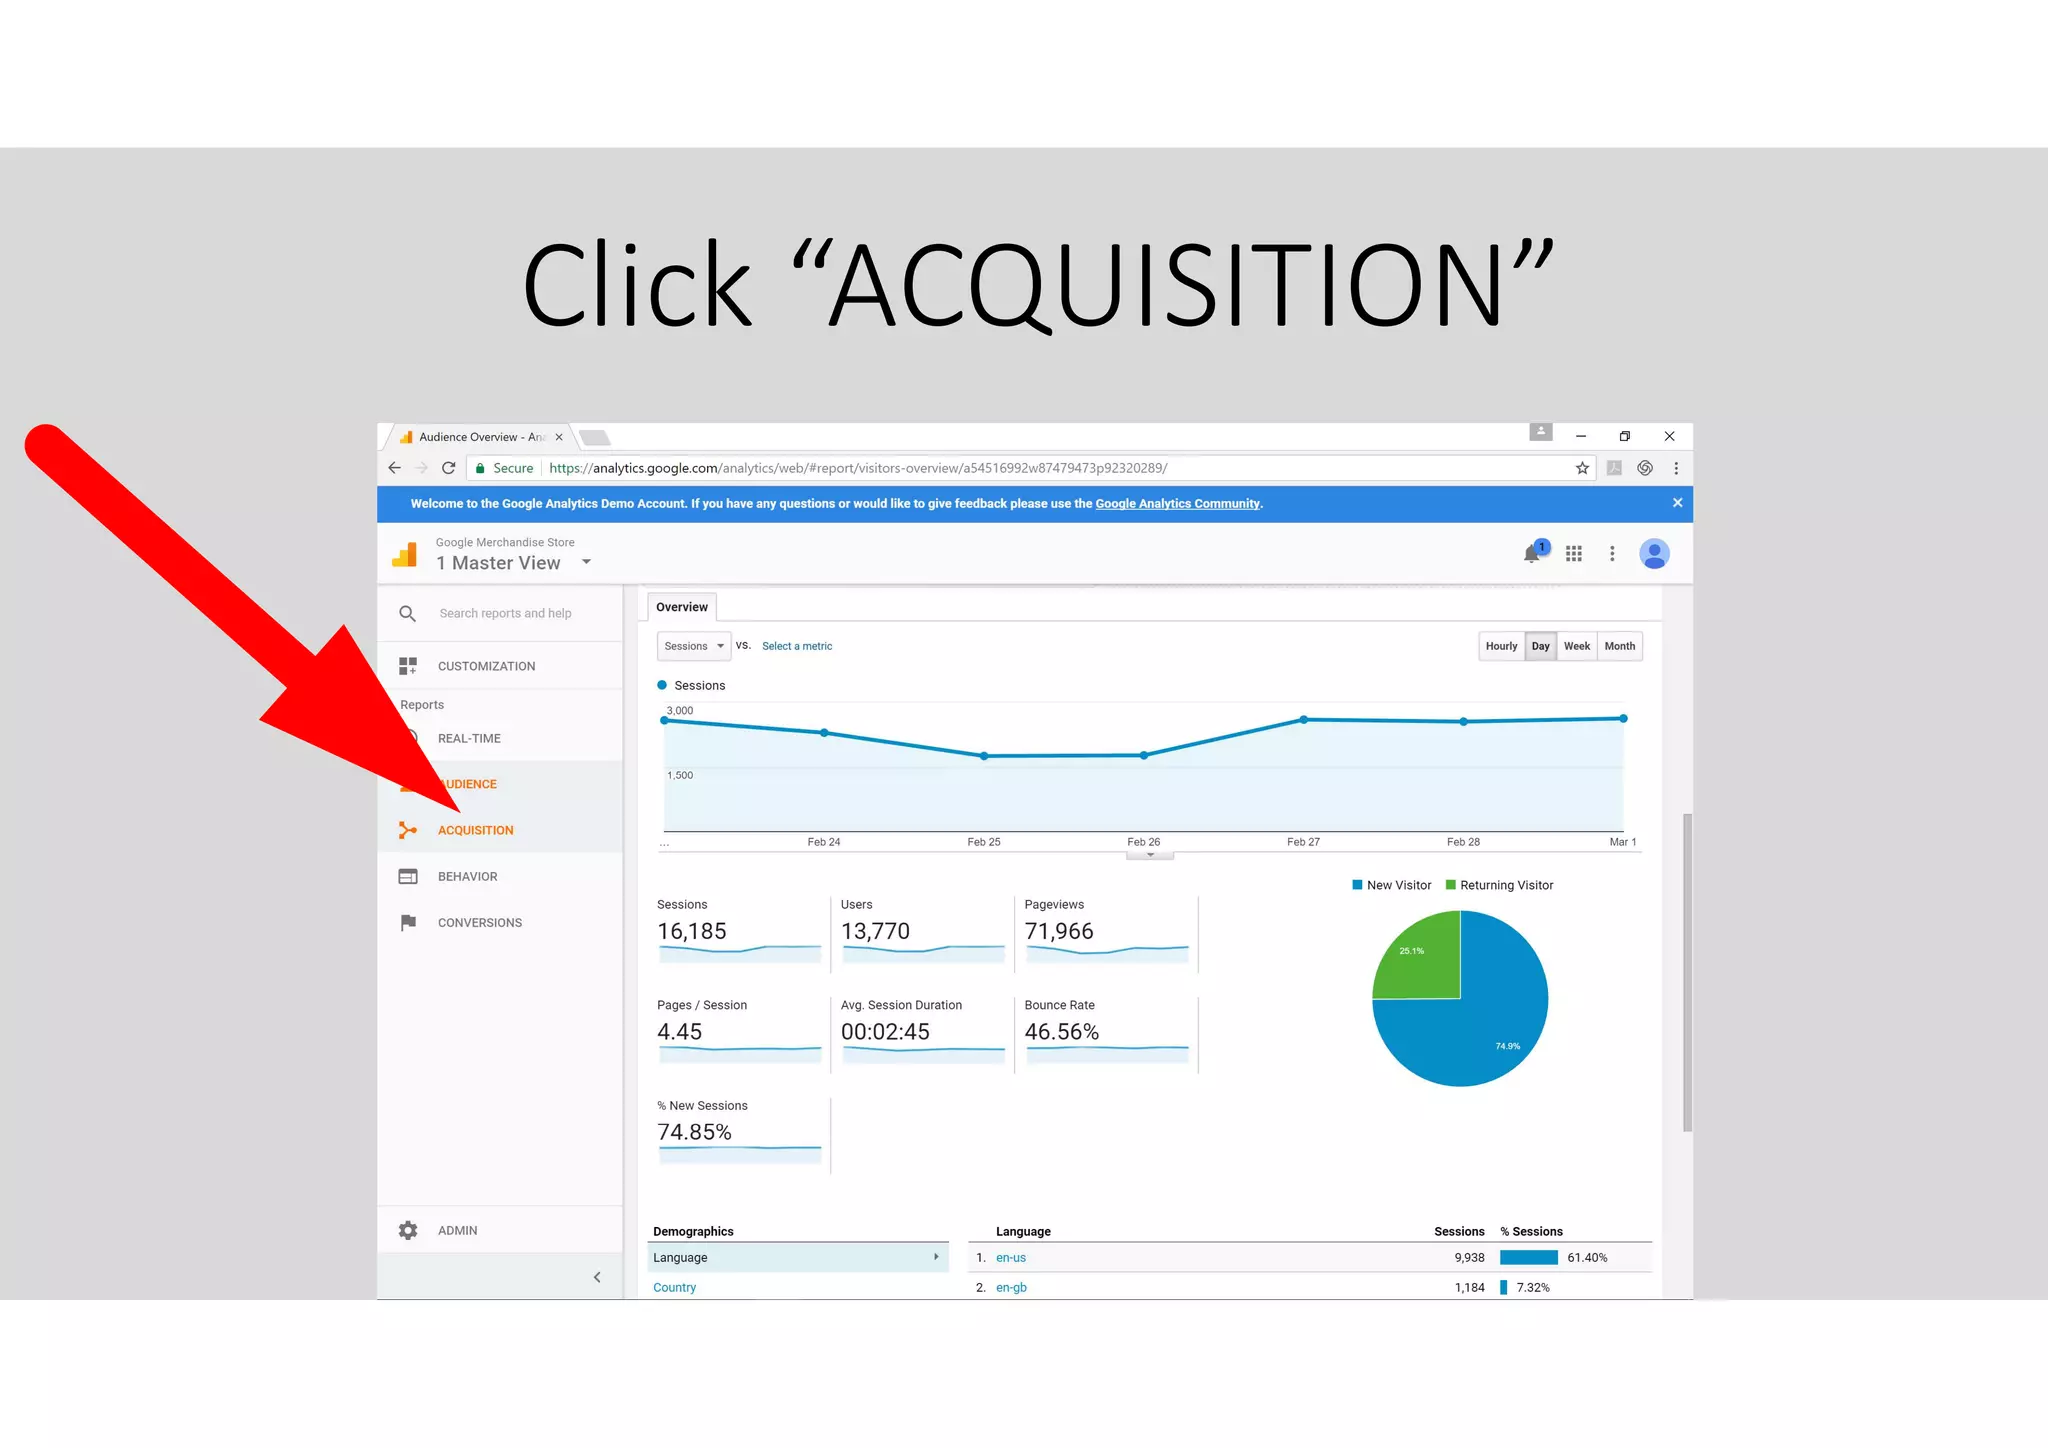
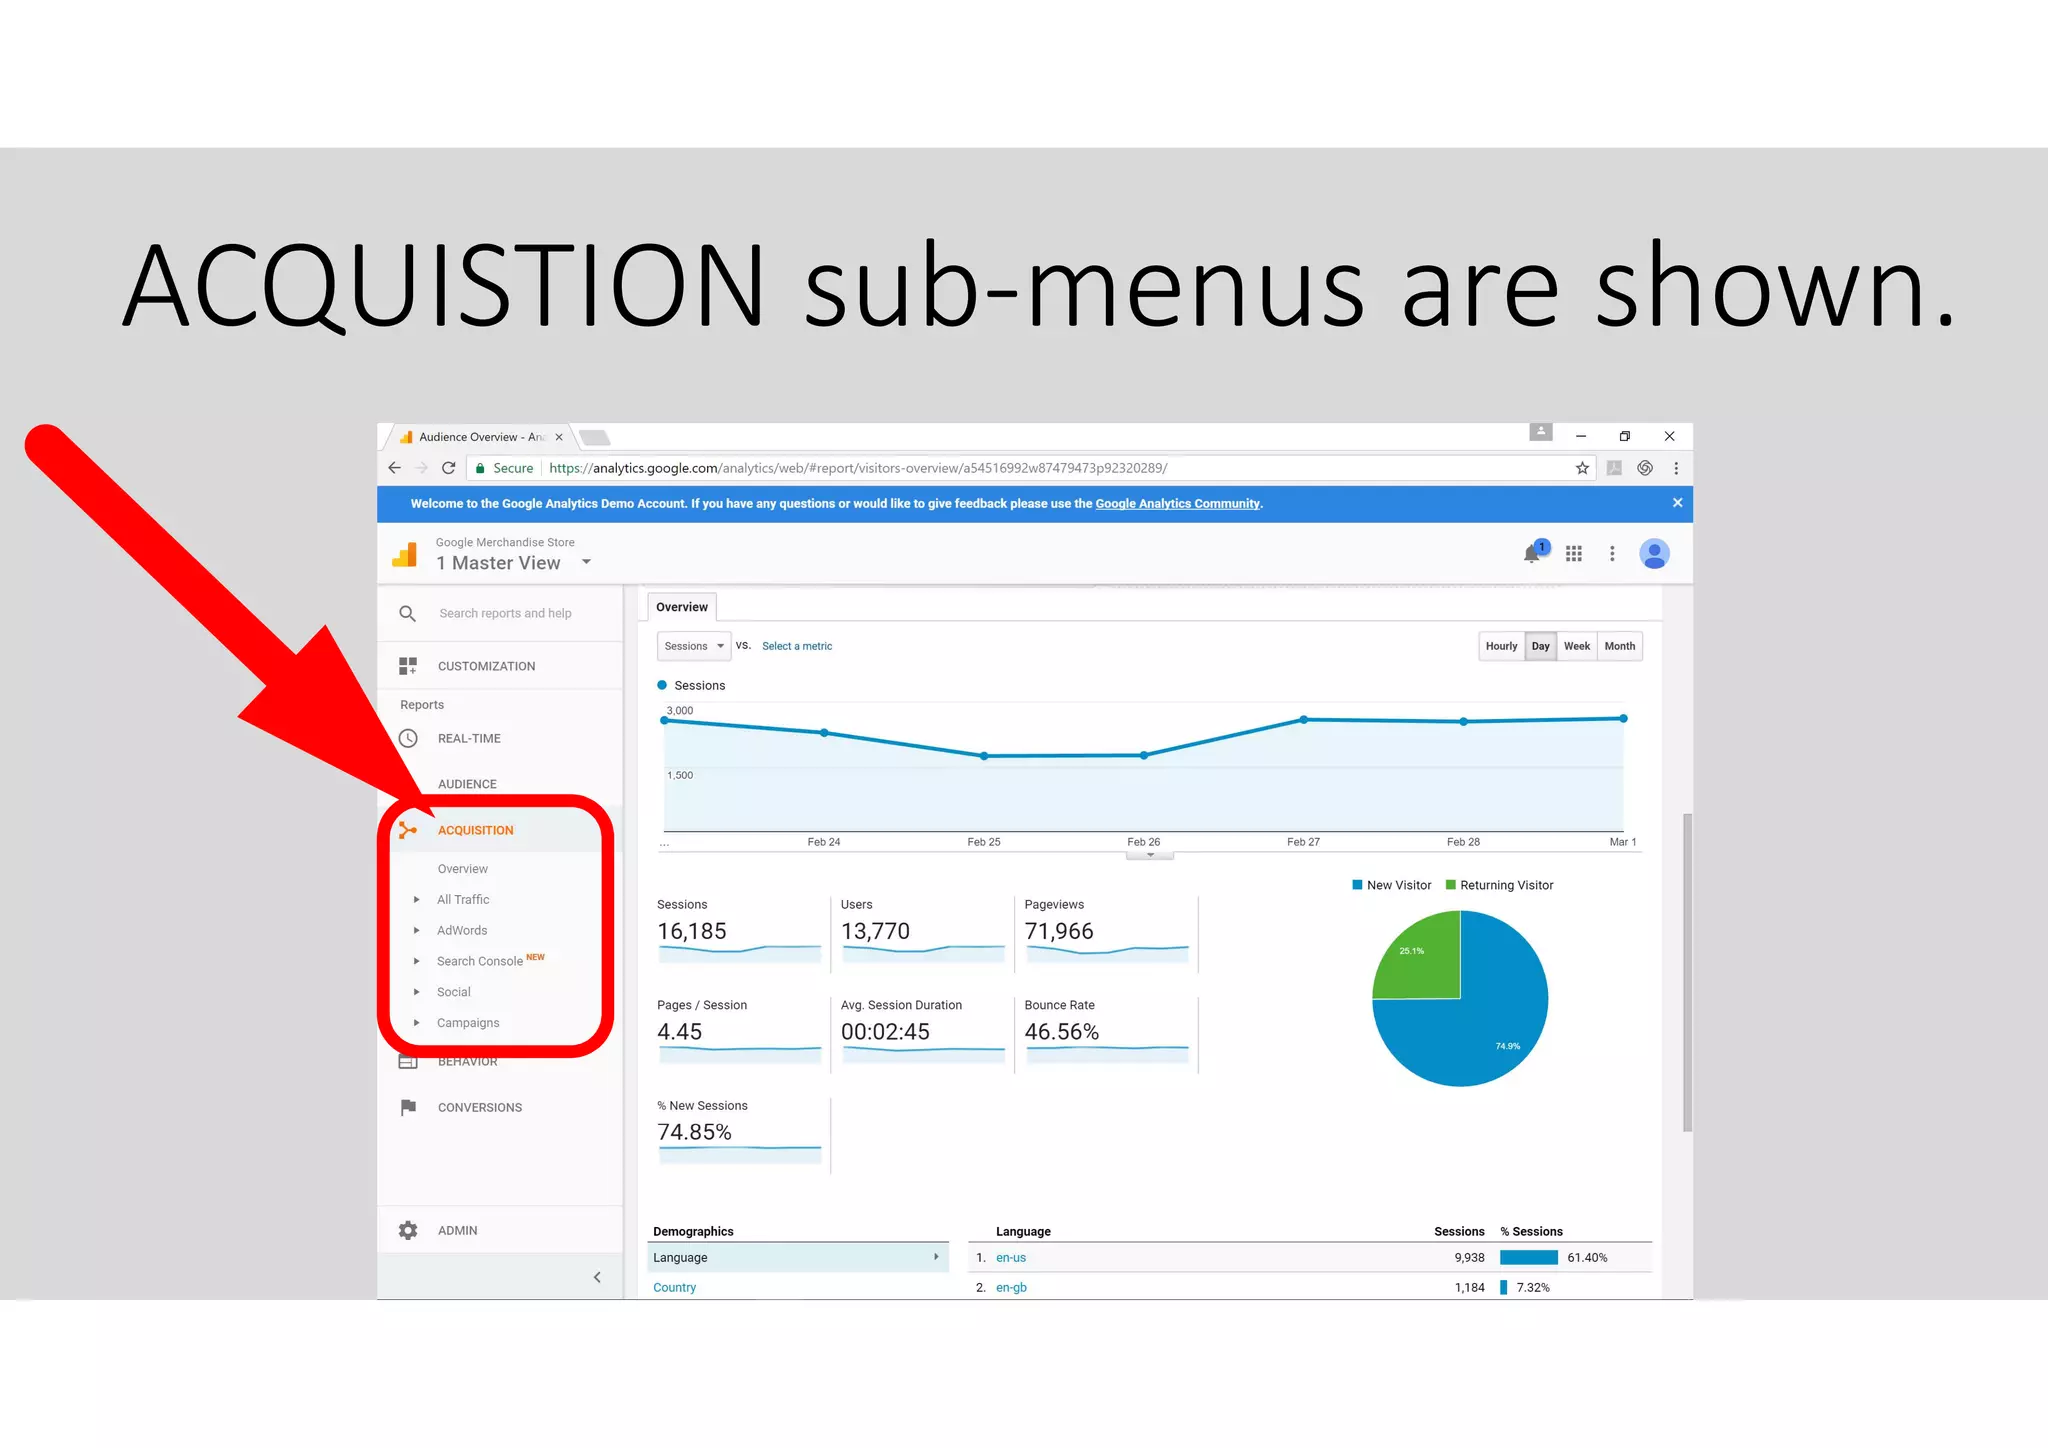
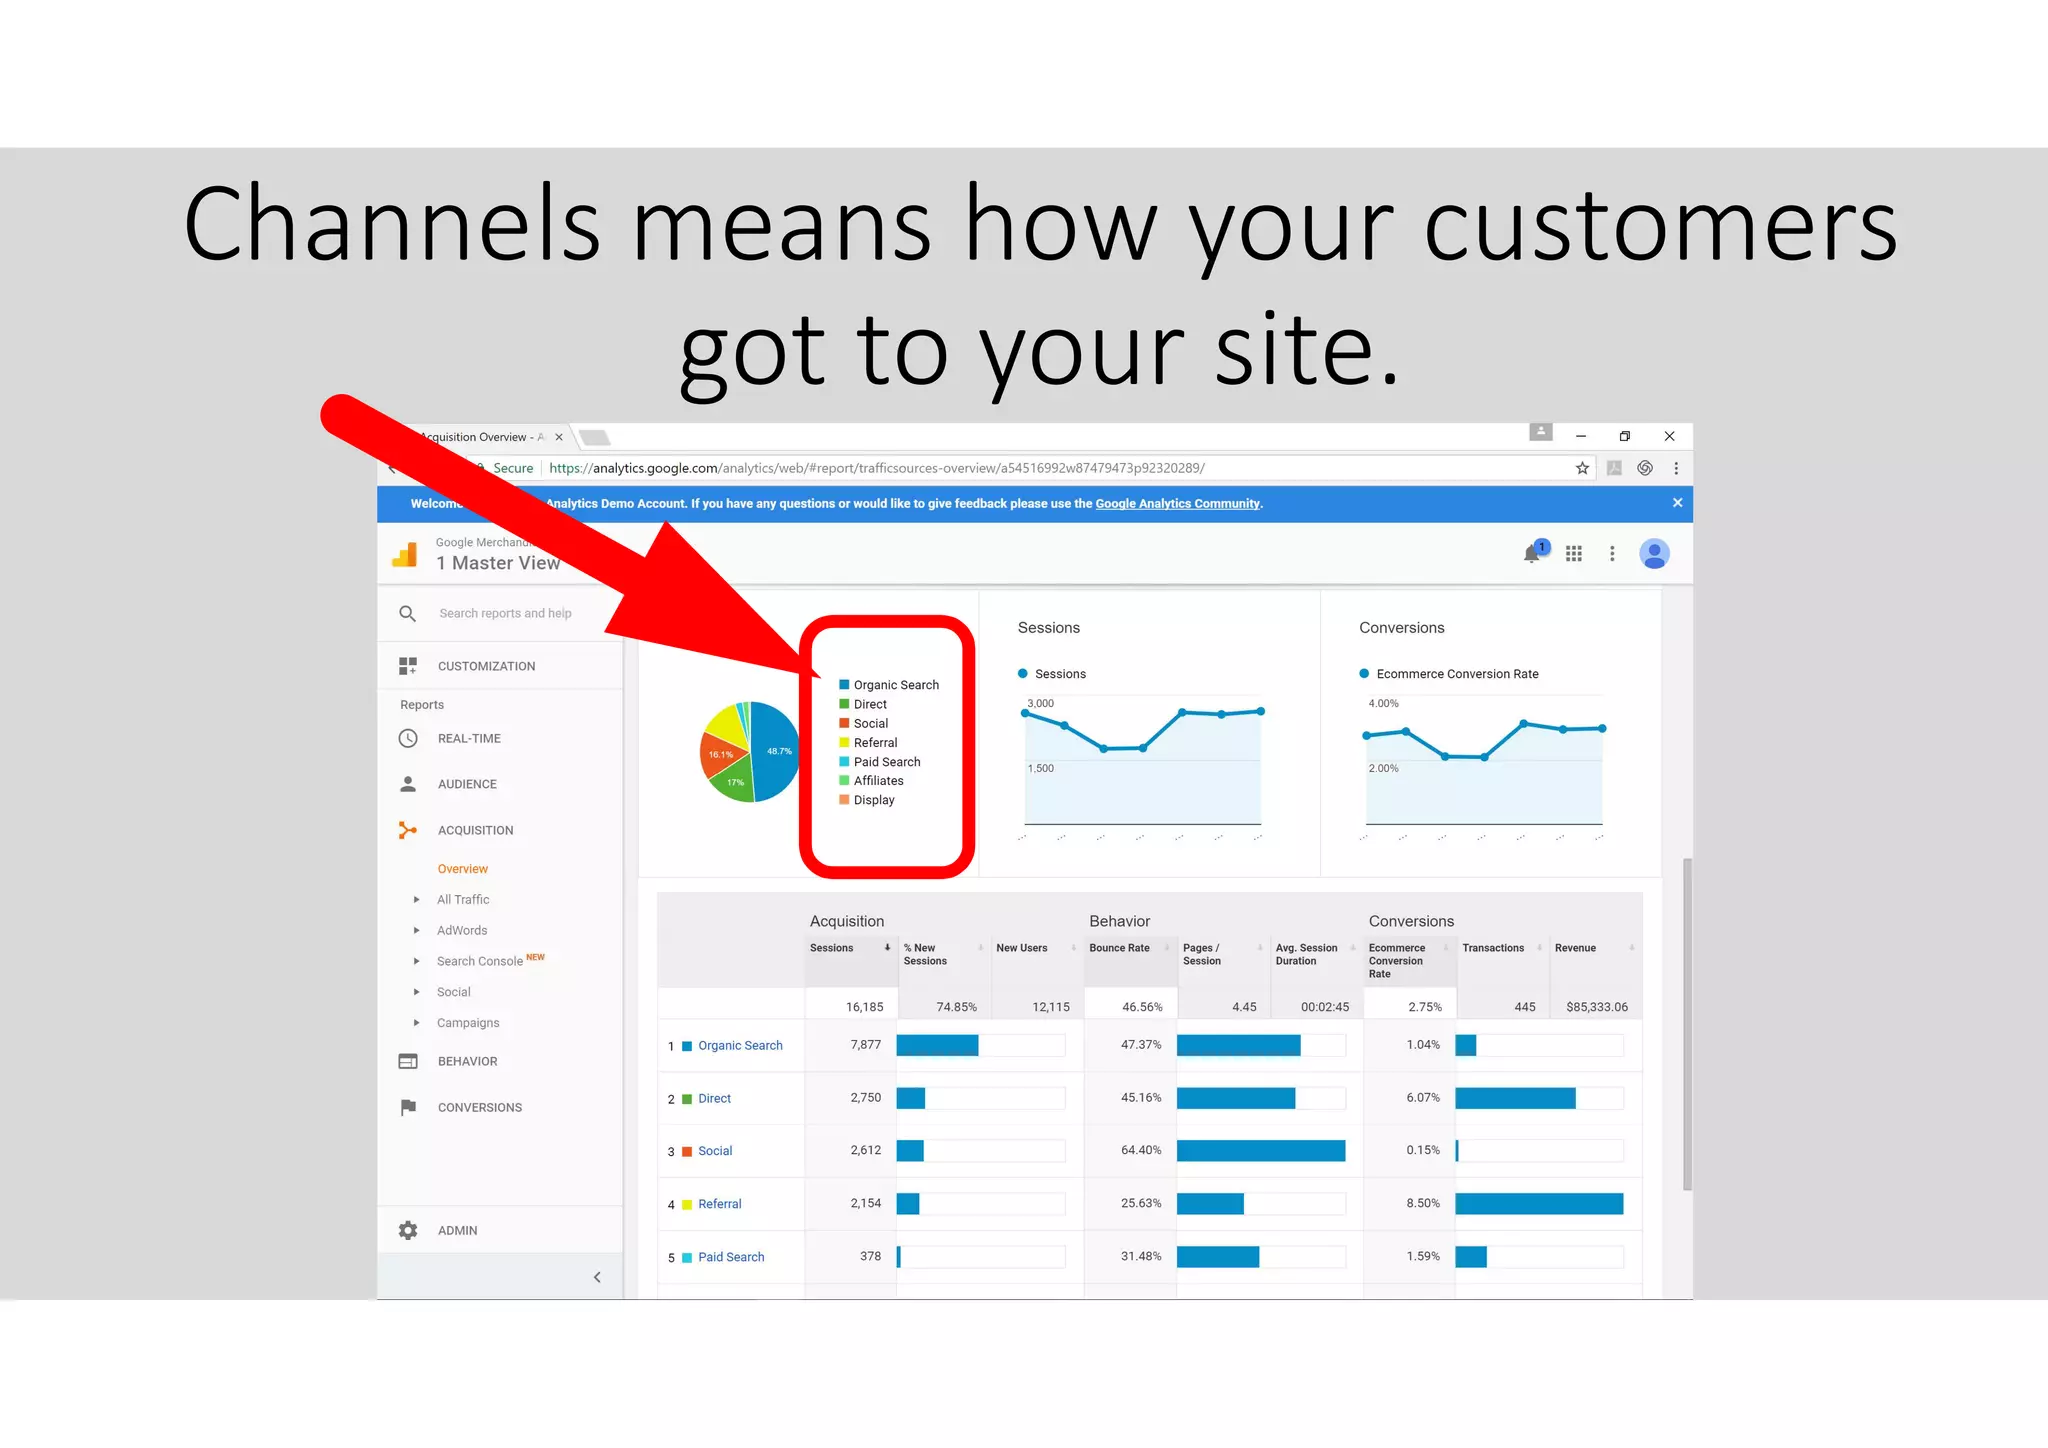
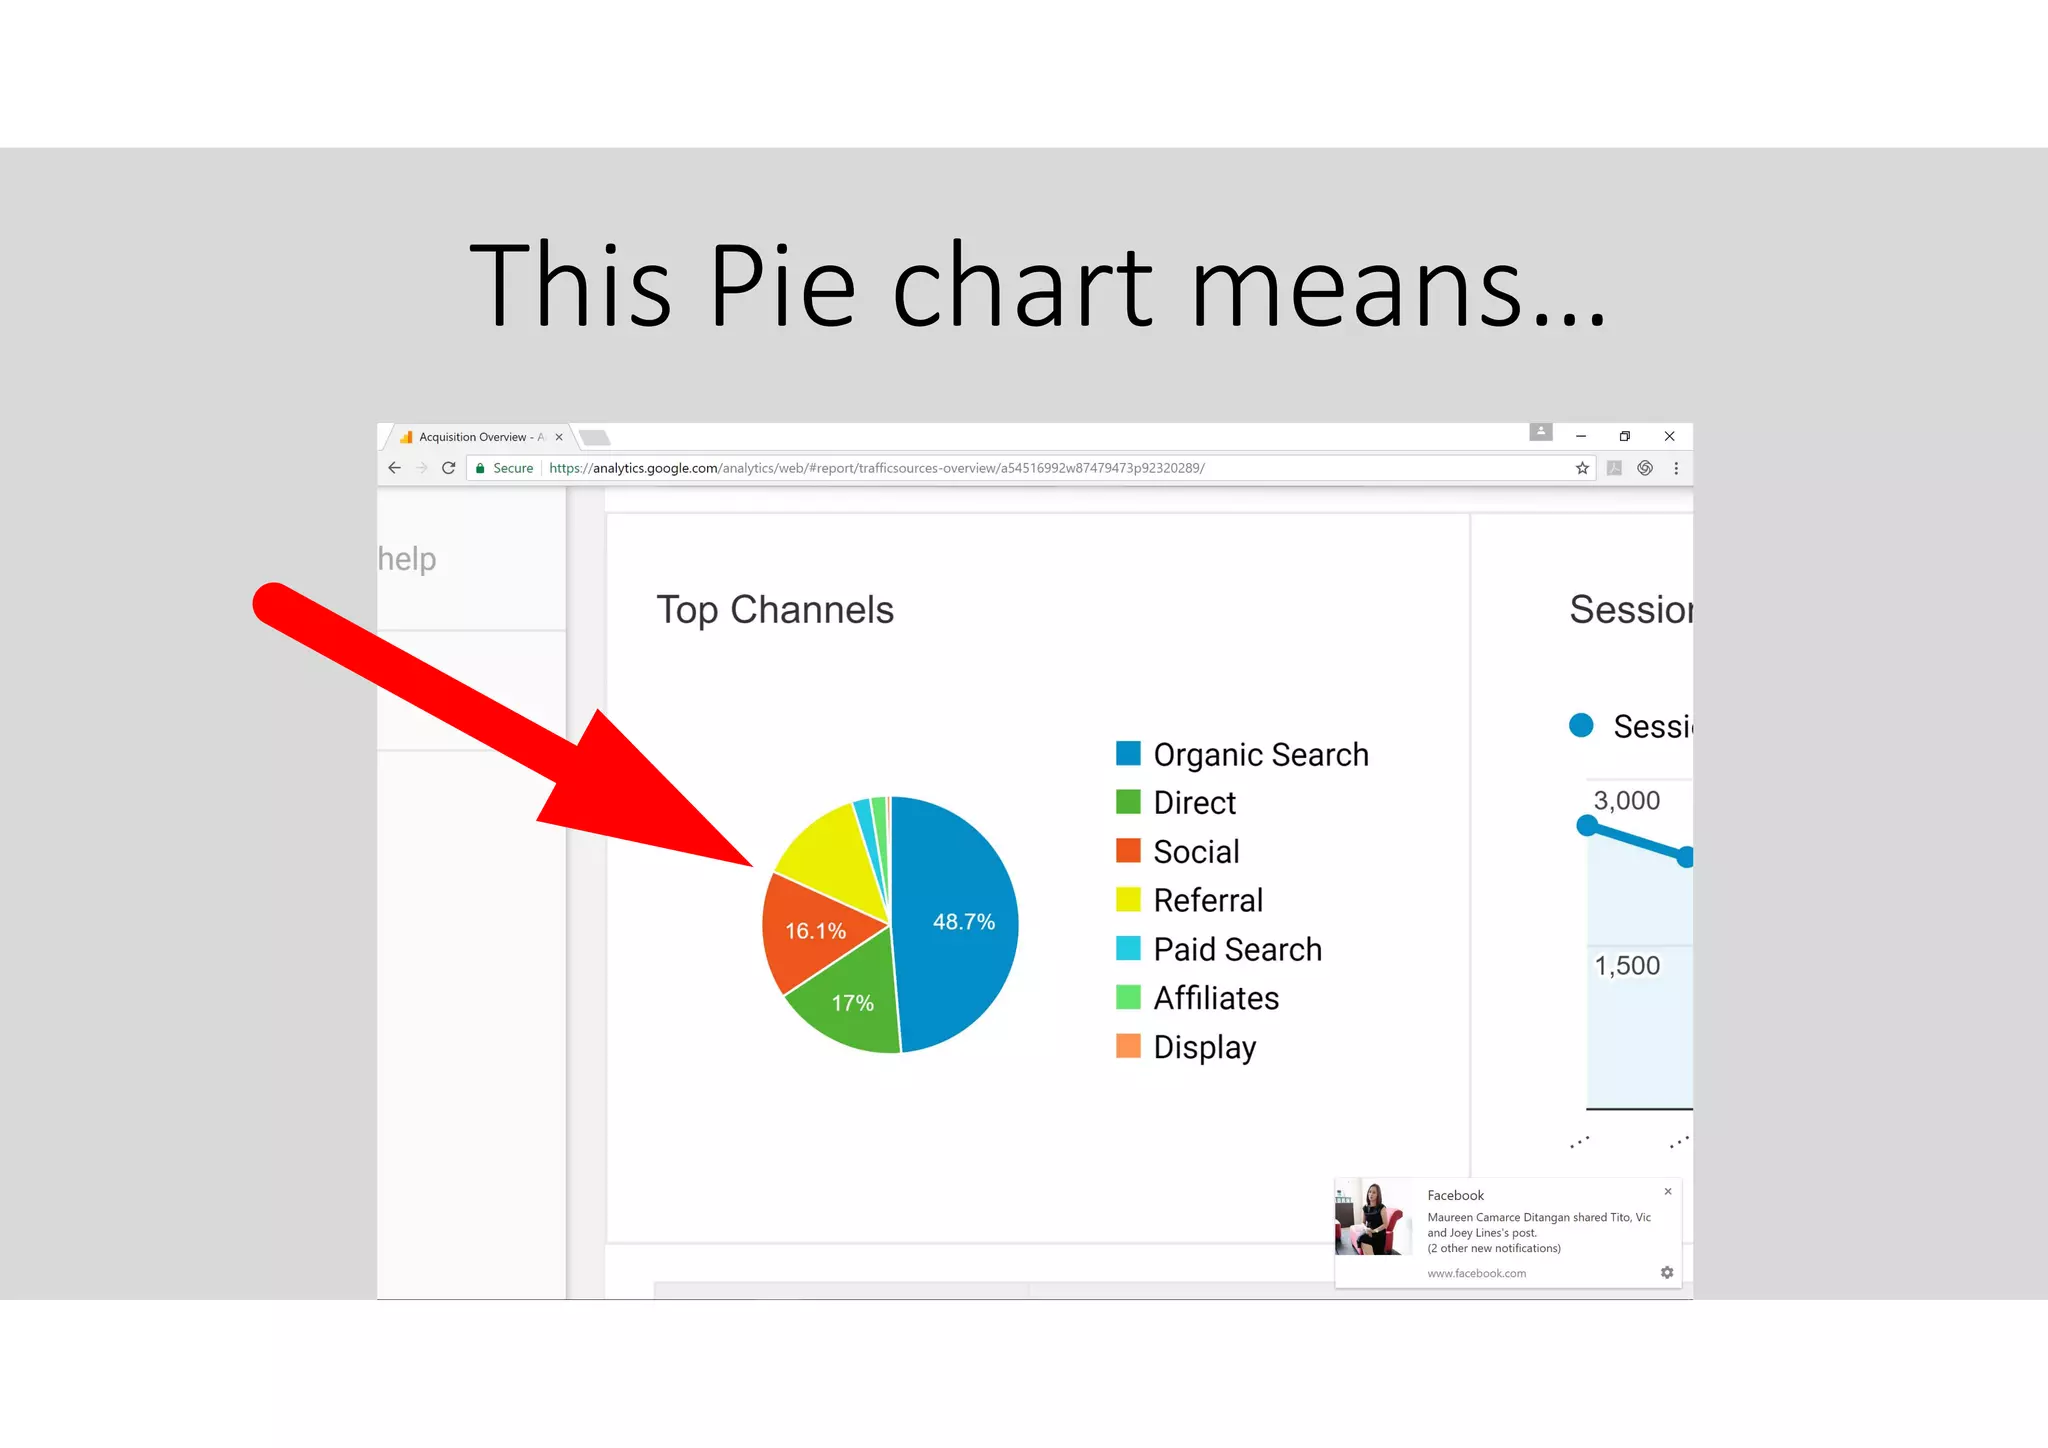
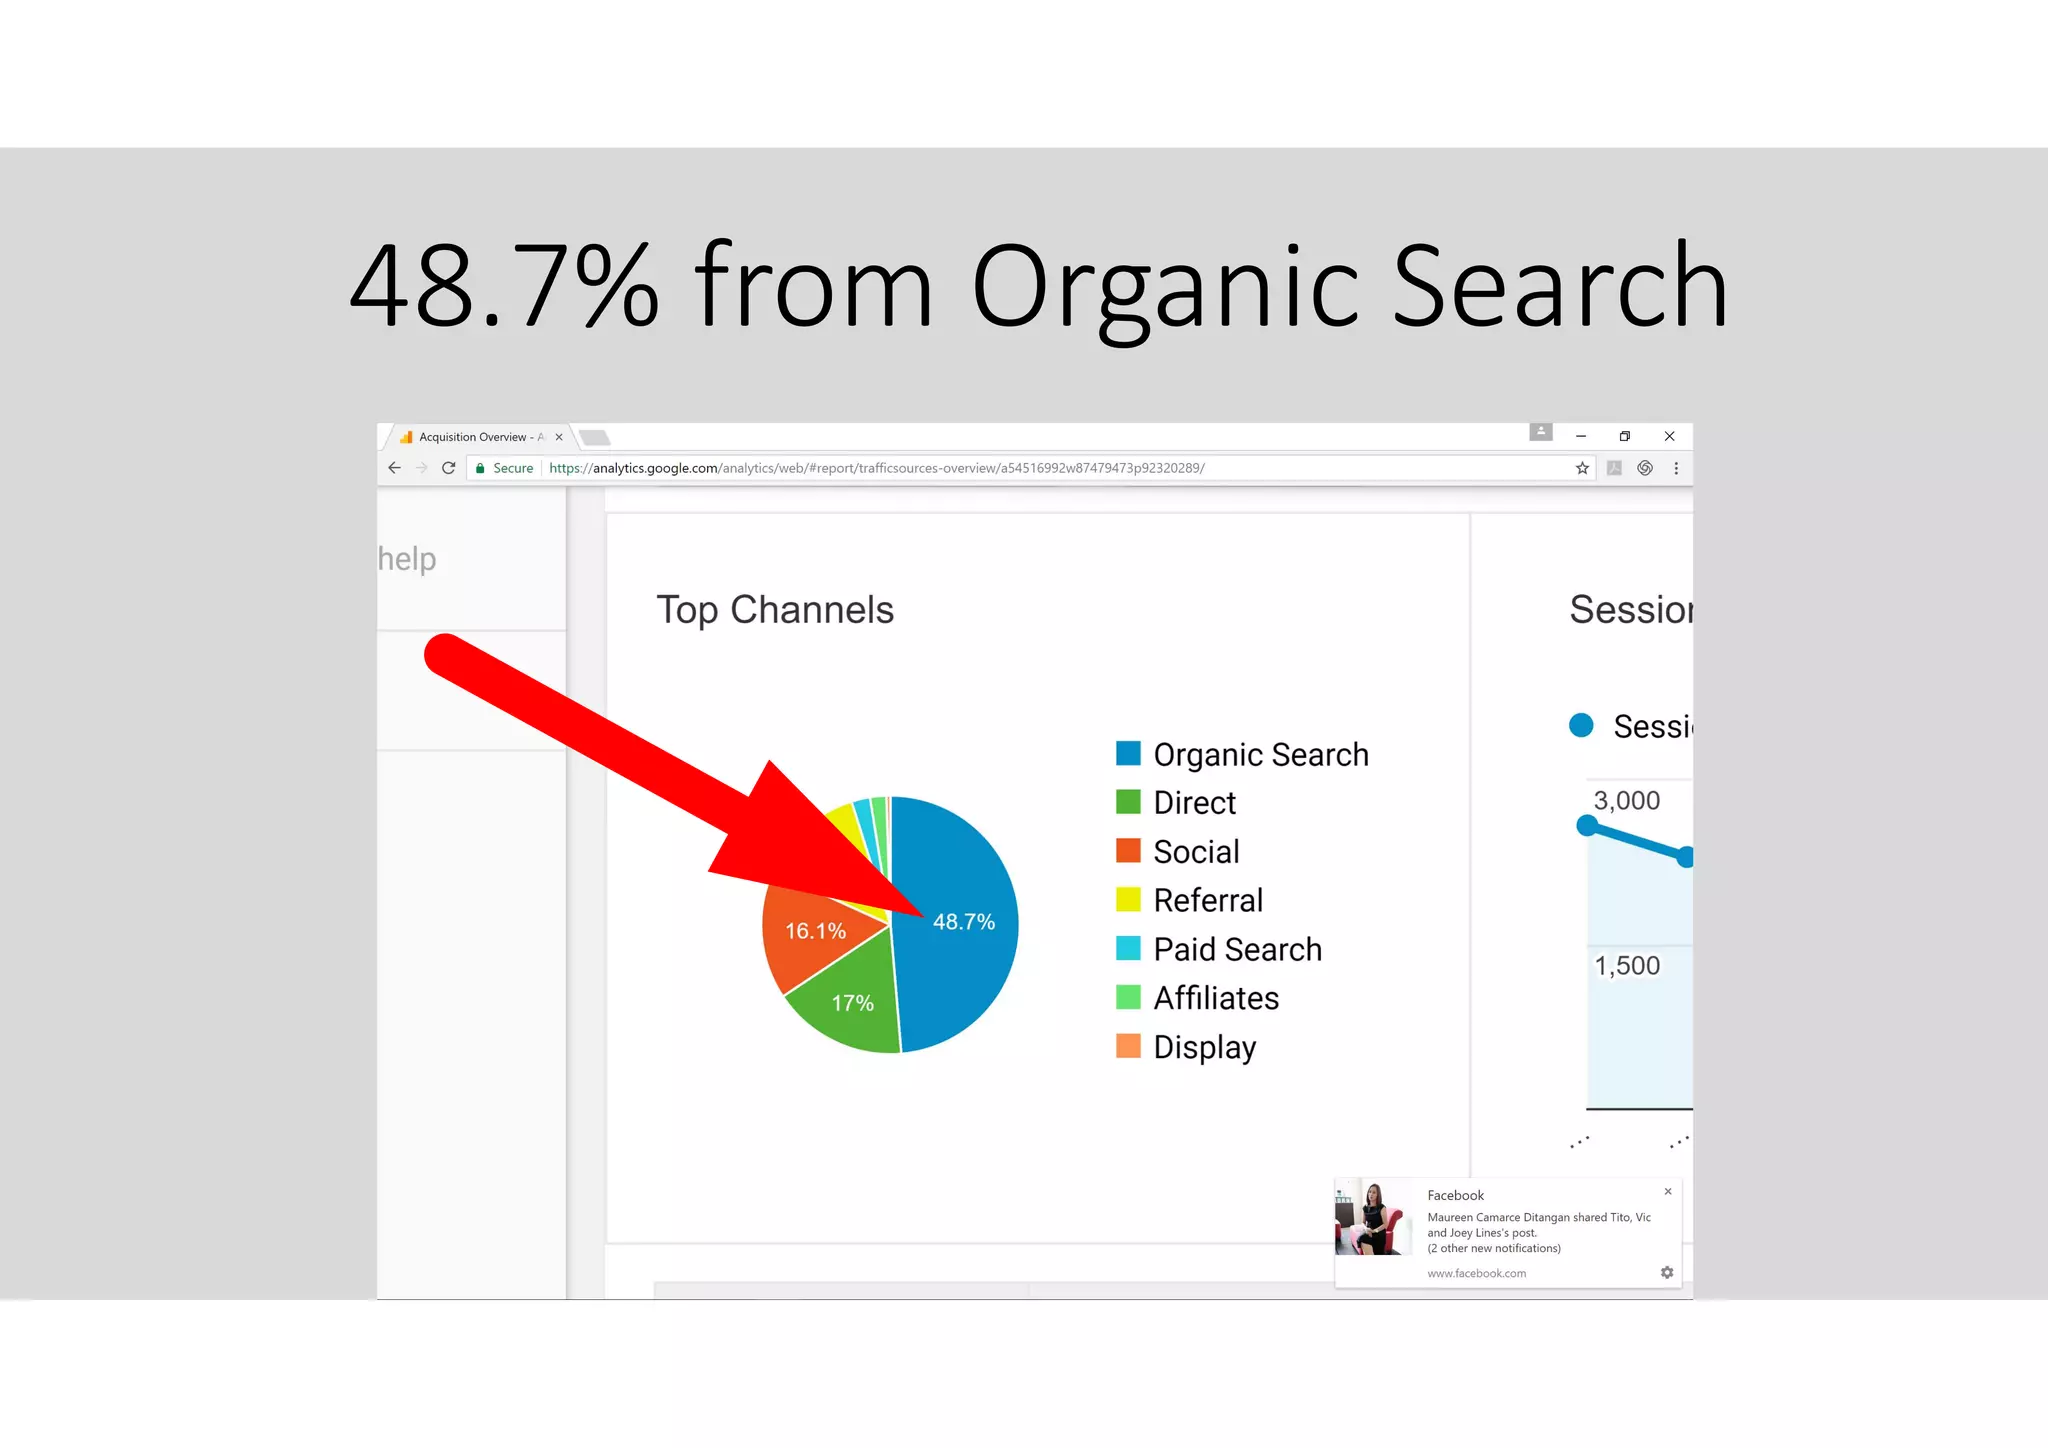
Google Analytics is FREE web
analytics service that tracks and
reports website traffic.
Lets sign-up and find out what
makes Google Analytics the most
popular web analysis tool.
Open your favorite browser
If you are not yet signed in to
your Google Account.
Please do so now.
Key-in google analytics
The search result page appears.
Click “Google Analytics”
The Sign up page appears.
Do make sure that your are signed in to
your google account.
Click “Sign up”
The New Account page appears.
Choose “Website”
Key-in your Account Name here.
Your Account Name would be
your Company Name.
As an example, key-in
“Your Virtual Bliss”
Next key-in your Website Name.
Then key-in your Website URL
I generally use the same website
name and website URL for easy
tracking.
Next select your “Industry Category”
It is better to select the right
category so your data can be
compared with businesses
similar to you.
As an example, I selected
Food and Drink
Next Select your Reporting Time Zone
Scroll down and the data sharing options
are shown.
All checked is the recommended setting
Click “Get Tracking ID”
This screen appears.
Finish reviewing the service agreement.
Click “I Accept”
This page appears.
Scroll down to Website tracking.
Copy the Universal Analytics tracking
code from here…
Right click mouse after highlighting.
Then click “Copy”
Now we will need to copy this
universal analytics tracking code
to your website settings.
Go to your business webpage.
As an example I will use a
Weebly.com webpage.
This is my sample Weebly website.
Click “Edit Site”
The build page appears.
Click “Settings”
The “General” page appears.
Click “SEO” here.
The SEO page appears.
Click in the “Footer Code” box.
Right click your mouse and select
“Paste”…
Check if <script> is copied here…
Scroll Down.
Check if </script> is copied here.
It is important that all the
information is complete by
checking <script> and </script>
are included.
If not, kindly go to the Google
Analytics tab again and copy the
information once more.
Now click the “Save” button.
It may need 24hrs or so to have
some data in your Analytics tab.
Kindly be patient.
Click your Analytics tab
Your Analytics page appears.
Click here. “Audience”
The reports menu is expanded.
Click “Overview”
This Screen appears.
Scroll Down
The “Sessions” chart is shown.
Scroll Down further…
And a few more options are shown.
Since this Analytics account is
fairly “new”, let us look at a
DEMO account to make it more
interesting.
This is a free DEMO account.
But before we go into the reports
let us have a quick review of
Google Analytics (GA) A>B>C.
This is the ABC cycle.
ACQUISITION
BEHAVIORCONVERSION
Acquisition:
How you get customers into your site.
ACQUISITION
BEHAVIORCONVERSION
Behavior:
What the visitor does in your site.
ACQUISITION
BEHAVIORCONVERSION
Conversion:
Did you achieve a sale or get a new client.
ACQUISITION
BEHAVIORCONVERSION
Click Audience.
The main tabs/reports are shown.
Click “ACQUISITION”
ACQUISTION sub-menus are shown.
Click “ Overview”
The Overview screen is shown.
Scroll down.
Top Channels is shown.
Channels means how your customers
got to your site.
This Pie chart means…
48.7% from Organic Search
Organic Search results typically
means the traffic came from
“non-paid” search results.
17% from Direct
Direct means traffic came from
directly typing your URL.
16.1% from Social
Social means the visit came from
social media like Facebook,
YouTube and Twitter.
Click “All Traffic”
Click “Source/Medium”
This Screen is shown.
#1 traffic comes from Google.
#2 traffic comes from Direct.
#3 traffic comes from YouTube.
Now click “BEHAVIOR” here.
The BEHAVIOR sub-menus are shown.
Click “Site Content”
Click “All Pages”
Scroll Down.
This screen shows the performance of
each page in your site.
Click “Page Title”…
To reflect the actual page name in your
site.
This table shows the no. of Pageviews.
This table shows the Avg. Time on Page
This table shows the Bounce Rate
Ave. Time on Page and Bounce
rate typically gives you some
insight on how engaging your
site page is.
Click on Avg. Time on Page.
Google Women’s Muscle Tee is #1.
Click on Bounce Rate.
Shows the top 0% Bounce rates.
0% Bounce Rate pages triggered
an “action” from your visitor
100% of the time.
100% Bounce Rate pages means
the visitor left your site from this
page.
Click “BEHAVIOR” once again.
Click on “CONVERSIONS”
Click on “Ecommerce”
Please note that Ecommerce
settings need be done in GA and
your website before data can be
collected.
Click on “Product Performance”
Product Performance screen is shown.
Scroll Down…
To show the product performance
table.
You can see which products …
Gives you the most revenue.
Click Secondary Dimension here.
A drop menu is shown.
Click “ACQUISITION”
A drop menu is shown.
Click “Source/Medium”
Source/Medium column is added in
your table.
This tells you from which traffic you are
generating your most revenue.
Now Click “Sales Performance”
Transaction ID’s table is shown.
A Transaction ID corresponds to
a sales date of transaction.
Click on the histogram tab.
And the Histogram Chart is shown.
Click on a specific Transaction ID.
And the products sold on that day is
shown.
Now we have a better grasp of what
marketing insights GA offers us.
ACQUISITION BEHAVIOR
CONVERSION
Let us look at the AUDIENCE
Overview report.
The most common report
reviewed in GA.
Click “Audience”
Click “Overview”
Scroll Down
This is the Overview Report.
You can choose a timeframe here.
Review % of New and
Returning Visitors.
Plus a summary of basic information.
You can review Demographics.
Such as Language.
Click “Country”
A list of Countries is shown.
Click “Demographics” here.
Age and Gender Information is shown.
Click “Geo” here.
Scroll Down
And a heat graph of where your traffic
is coming from is shown.
Click “Mobile” here.
Click “Overview”
And it shows you the device category
here.
Click “Devices” here.
And the list of Mobile Devices Info is
shown.
All of this information can be
harnessed to improve your
business and marketing
strategies.
Click “Overview” here once again.
Click “Export”…
And GA allows you to download the full
report.
Most of all GA is FREE.
This concludes our basic tutorial
on Google Analytics.
A tutorial on Google Analytics 2017 melvinreceno the magnificent

A tutorial on Google Analytics 2017 melvinreceno the magnificent