Glicemia e fat food ingestion
•
1 like•868 views

This research article investigates how circulating glucose levels modulate neural control of the desire for high-calorie foods in humans. The study found that: 1) Mild hypoglycemia preferentially activated brain regions involved in reward and motivation (e.g. striatum, insula) and increased reported desire for high-calorie foods, compared to a state of euglycemia. 2) Euglycemia preferentially activated brain regions involved in inhibitory control (e.g. prefrontal cortex, anterior cingulate cortex) and resulted in less interest in food stimuli. 3) Higher circulating glucose levels predicted greater activation of the medial prefrontal cortex, and this response was absent in obese

Recommended
More Related Content
What's hot
What's hot (20)
Similar to Glicemia e fat food ingestion
Similar to Glicemia e fat food ingestion (20)
More from Ruy Pantoja
More from Ruy Pantoja (20)
Recently uploaded
Recently uploaded (20)
Glicemia e fat food ingestion
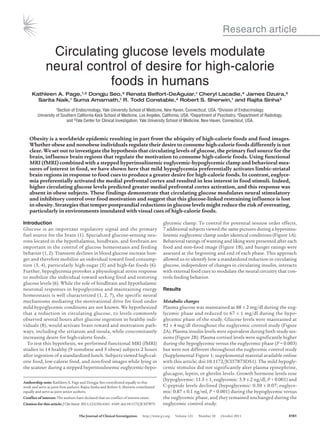
- 1. Research article Circulating glucose levels modulate neural control of desire for high-calorie foods in humans Kathleen A. Page,1,2 Dongju Seo,3 Renata Belfort-DeAguiar,1 Cheryl Lacadie,4 James Dzuira,5 Sarita Naik,1 Suma Amarnath,1 R. Todd Constable,4 Robert S. Sherwin,1 and Rajita Sinha3 1Section of Endocrinology, Yale University School of Medicine, New Haven, Connecticut, USA. 2Division of Endocrinology, University of Southern California Keck School of Medicine, Los Angeles, California, USA. 3Department of Psychiatry, 4Department of Radiology, and 5Yale Center for Clinical Investigation, Yale University School of Medicine, New Haven, Connecticut, USA. Obesity is a worldwide epidemic resulting in part from the ubiquity of high-calorie foods and food images. Whether obese and nonobese individuals regulate their desire to consume high-calorie foods differently is not clear. We set out to investigate the hypothesis that circulating levels of glucose, the primary fuel source for the brain, influence brain regions that regulate the motivation to consume high-calorie foods. Using functional MRI (fMRI) combined with a stepped hyperinsulinemic euglycemic-hypoglycemic clamp and behavioral mea- sures of interest in food, we have shown here that mild hypoglycemia preferentially activates limbic-striatal brain regions in response to food cues to produce a greater desire for high-calorie foods. In contrast, euglyce- mia preferentially activated the medial prefrontal cortex and resulted in less interest in food stimuli. Indeed, higher circulating glucose levels predicted greater medial prefrontal cortex activation, and this response was absent in obese subjects. These findings demonstrate that circulating glucose modulates neural stimulatory and inhibitory control over food motivation and suggest that this glucose-linked restraining influence is lost in obesity. Strategies that temper postprandial reductions in glucose levels might reduce the risk of overeating, particularly in environments inundated with visual cues of high-calorie foods. Introduction glycemic clamp. To control for potential session order effects, Glucose is an important regulatory signal and the primary 7 additional subjects viewed the same pictures during a hyperinsu- fuel source for the brain (1). Specialized glucose-sensing neu- linemic euglycemic clamp under identical conditions (Figure 1A). rons located in the hypothalamus, hindbrain, and forebrain are Behavioral ratings of wanting and liking were presented after each important in the control of glucose homeostasis and feeding food and non-food image (Figure 1B), and hunger ratings were behavior (1, 2). Transient declines in blood glucose increase hun- assessed at the beginning and end of each phase. This approach ger and therefore mobilize an individual toward food consump- allowed us to identify how a standardized reduction in circulating tion (3, 4), particularly high-sugar (5) and high-fat foods (6). glucose, independent of changes in circulating insulin, interacts Further, hypoglycemia provokes a physiological stress response with external food cues to modulate the neural circuitry that con- to mobilize the individual toward seeking food and restoring trols feeding behavior. glucose levels (6). While the role of hindbrain and hypothalamic neuronal responses in hypoglycemia and maintaining energy Results homeostasis is well characterized (1, 2, 7), the specific neural mechanisms mediating the motivational drive for food under Metabolic changes mild hypoglycemic conditions are not known. We hypothesized Plasma glucose was maintained at 88 ± 2 mg/dl during the eug- that a reduction in circulating glucose, to levels commonly lycemic phase and reduced to 67 ± 1 mg/dl during the hypo- observed several hours after glucose ingestion in healthy indi- glycemic phase of the study. Glucose levels were maintained at viduals (8), would activate brain reward and motivation path- 92 ± 4 mg/dl throughout the euglycemic control study (Figure ways, including the striatum and insula, while concomitantly 2A). Plasma insulin levels were equivalent during both study ses- increasing desire for high-calorie foods. sions (Figure 2B). Plasma cortisol levels were significantly higher To test this hypothesis, we performed functional MRI (fMRI) during the hypoglycemic versus the euglycemic phase (P = 0.003) studies in 14 healthy (9 nonobese and 5 obese) subjects 2 hours but were not different throughout the euglycemic control study after ingestion of a standardized lunch. Subjects viewed high-cal- (Supplemental Figure 1; supplemental material available online orie food, low-calorie food, and non-food images while lying in with this article; doi:10.1172/JCI57873DS1). The mild hypogly- the scanner during a stepped hyperinsulinemic euglycemic-hypo- cemic stimulus did not significantly alter plasma epinephrine, glucagon, leptin, or ghrelin levels. Growth hormone levels rose (hypoglycemic: 11.5 ± 1; euglycemic: 5.9 ± 2 ng/dl, P < 0.001) and Authorship note: Kathleen A. Page and Dongju Seo contributed equally to this work and serve as joint first authors. Rajita Sinha and Robert S. Sherwin contributed C-peptide levels declined (hypoglycemic: 0.50 ± 0.07; euglyce- equally and serve as joint senior authors. mic: 0.87 ± 0.1 ng/ml, P < 0.001) during the hypoglycemic versus Conflict of interest: The authors have declared that no conflict of interest exists. the euglycemic phase, and they remained unchanged during the Citation for this article: J Clin Invest. 2011;121(10):4161–4169. doi:10.1172/JCI57873. euglycemic control study. The Journal of Clinical Investigation http://www.jci.org Volume 121 Number 10 October 2011 4161
- 2. research article Figure 1 Study procedure. (A) While subjects were in the scanner, a hyperinsulinemic clamp was performed with a constant infusion of insulin along with variable amounts of glucose to maintain euglycemic conditions for the first 60 minutes. For the stepped clamp study (n = 14), plasma glucose was then lowered to approximately 65 mg/dl for the hypoglycemic phase. For the euglycemic control study (n = 7), plasma glucose was maintained at approximately 90 mg/dl (dotted line). During both conditions, functional scans were performed while subjects viewed images that were projected onto a screen in the scanner. (B) Time course of a single trial. Each trial consisted of 3 events. First, a high-calorie food, low-calorie food, or non- food picture appeared for 6 seconds. Second, two rating scales were presented for 3 seconds each and consisted of liking and wanting scales with values 1–9, where a rating of 1 indicated “not at all” and a rating of 9 indicated “very much.” At the end of a trial, a fixation cross appeared, and subjects relaxed until the onset of the next trial. Neural activation and behavioral ratings caused a greater wanting (P = 0.02, covaried for BMI) but no dif- Main effects of condition. In the total group, a significant effect was ference in liking of food (Figure 4B). detected for euglycemic versus hypoglycemic conditions across all Mild hypoglycemia preferentially increased activation of the food and non-food visual stimuli (see Table 1 for all brain regions striatum and insula in response to high-calorie food stimuli (Figure that were significantly affected by euglycemia relative to hypogly- 4C) and provoked a greater wanting (P = 0.006, covaried for BMI) cemia). There was greater activation of the prefrontal cortex (PFC) but no difference in liking of high-calorie foods (Figure 4D). In and anterior cingulate cortex (ACC) under euglycemia relative to contrast, low-calorie food cues did not provoke a differential brain hypoglycemia, whereas the nucleus accumbens, insula, hypothala- response (data not shown) or a significant difference in the behav- mus, thalamus, caudate, and putamen were preferentially activat- ioral response to mild hypoglycemia compared with euglycemia ed under hypoglycemia relative to euglycemia (P < 0.05, corrected, (Supplemental Figure 2). These results could not be attributed to covaried for BMI, Figure 3A). Hunger ratings were greater under nonspecific time-related effects, since no differences in brain activa- hypoglycemic (5.7 ± 0.5) versus euglycemic (4.5 ± 0.5) conditions tion to food cues or in hunger ratings were observed during the sec- (P = 0.009) and did not significantly vary as a function of BMI. ond half of the euglycemic control study session compared with the However, significant BMI group interactions were seen with condi- first half (Supplemental Figure 3). Thus, mild hypoglycemia sets in tion. Obese individuals showed greater left substantia nigra/ventral motion adaptive mechanisms in motivational pathways to specifi- tegmental area (SN/VTA) activation and greater bilateral activation cally increase wanting of high-energy and glucose-rich foods. of the hypothalamus, thalamus, striatum, and insula during hypo- glycemia relative to euglycemia (P < 0.05, corrected). Furthermore, Neural activation and neuroendocrine correlations increased activation of the medial PFC or ACC under euglycemia The association of changes in circulating glucose and hormones relative to hypoglycemia did not occur in obese individuals (Fig- with brain activation to high-calorie food images was assessed ure 3B). Nonobese individuals demonstrated greater right insula using whole-brain, voxel-based correlation analyses (Figure 5). and putamen activity during hypoglycemia relative to euglycemia Higher plasma glucose levels correlated with greater brain activ- and greater activity in the left SN/VTA, bilateral hippocampus, and ity in executive control centers in the ACC and ventromedial PFC, medial PFC and ACC during euglycemia rela- tive to hypoglycemia (Figure 3C). Condition × task effects. Next we compared how the level of plasma glucose influenced the ability of visual food stimuli (high-calo- rie and low-calorie foods) to affect brain activation and wanting and liking of food (Figure 4). During euglycemia compared with hypoglycemia, there was significantly greater activation in the PFC and ACC, whereas hypoglycemia compared with eug- lycemia provoked greater activation in the insula and striatum in response to images Figure 2 of high- and low-calorie foods (P < 0.05, cor- Plasma glucose and insulin levels. (A) Plasma glucose and (B) insulin levels (mean ± SEM) dur- rected, covaried for BMI, Figure 4A). Hypo- ing the stepped euglycemic-hypoglycemic (black circles) and euglycemic control (white squares) glycemia compared with euglycemia also study sessions. *P < 0.001 unpaired t test, euglycemic versus hypoglycemic session. 4162 The Journal of Clinical Investigation http://www.jci.org Volume 121 Number 10 October 2011
- 3. Table 1 Brain responses during euglycemia relative to hypoglycemia Region of activation Lat Whole-group Lean Obese Coordinates Volume t Coordinates Volume t Coordinates Volume t x y z (mm3) x y z (mm3) x y z (mm3) Lateral prefontal cortex L –56 7 6 534 –2.47 – – – – – –45 24 7 12,926 –2.57 R 39 26 9 8,460 –2.48 – – – – – 43 23 11 7,612 –2.48 Premotor cortex (BA6) L –29 –7 48 4,113 –2.63 – – – – – –25 –2 52 11,714 –2.54 R 54 3 20 3,499 –2.62 – – – – – 29 –3 50 14,723 –2.82 Medial prefrontal cortex B –7 54 12 18,092 2.5 –2 56 12 15,106 2.68 – – – – – ACC B –3 44 9 3,707 2.53 –4 45 8 1,728 2.38 1 21 26 4,928 –2.48 Insula L –40 11 –3 2,818 –2.58 – – – – – –37 14 –5 3,245 –2.66 R 38 12 1 2,593 –2.5 37 8 2 1,114 –2.5 39 17 –3 2,385 –2.53 Striatum (caudate, putamen) L –22 7 2 3,143 –2.52 – – – – – –18 –12 2 1,808 –2.44 R 25 5 1 3,715 –2.65 29 1 –1 3,103 –2.46 23 4 1 4,101 –2.49 Thalamus B 3 –12 8 3,425 –2.63 – – – – – 1 –14 8 6,858 –2.6 Hypothalamus L –8 –4 –6 87 –2.27 – – – – – –8 –3 –7 125 –2.37 R – – – – – 5 –5 –6 174 –2.56 Hippocampus L – – – – – –28 –20 –15 1,567 2.5 – – – – – R – – – – – 32 –18 –18 2222 2.54 – – – – – Midbrain (SN/VTA) L – – – – – –7 –19 –14 436 2.41 –10 –15 –12 628 –2.58 Temporal lobe (superior/middle/inferior) L – – – – – –40 –14 –22 4,502 2.5 –55 –4 –3 1,719 –2.45 R 55 –44 12 1,580 –2.34 41 3 –29 2,440 2.54 41 –24 –7 1,077 –2.34 Parietal lobe (superior/middle) L –44 –39 39 9,772 –2.63 – – – – – –40 –43 42 13,890 –2.77 R 38 –49 43 18,216 –2.91 39 –49 44 10,418 –2.74 36 –49 45 13,210 –2.67 The Journal of Clinical Investigation http://www.jci.org Volume 121 Number 10 October 2011 Note: Activity increased during euglycemia relative to hypoglycemia is indicated in bold. All other values reflect greater activity in hypoglycemia relative to euglycemia. Whole-brain FWE corrected, thresholds at P < 0.05. MNI coordinates were used. Lat, laterality; L, left; R, right; B, bilateral; BA, Brodmann area. research article 4163
- 4. research article Figure 3 Differences between euglycemic and hypoglycemic conditions. Axial slices with (A) whole group, covaried for BMI (n = 14), (B) obese group (n = 5), and (C) nonobese group (n = 9) averages, showing brain response to euglycemia compared with mild hypoglycemia across visual cue tasks (threshold of P < 0.05, 2 tailed, FWE whole brain corrected). Red and yellow areas show greater activity during euglyce- mia, and blue areas indicate greater activity during hypoglycemia. The color scale gives the t value of the functional activity. Eu, euglycemia; Hypo, hypoglycemia; NAcc, nucleus accumbens; Hyp, hypothalamus; VMPFC, ventromedial prefrontal cortex; Hipp, hippocampus; L, left; R, right. MNI coordinates were used to define brain regions. whereas higher levels of plasma cortisol, but not other hormones, were correlated with greater activation in reward regions, such as the insula and putamen (P < 0.01, corrected), in response to high- calorie food cues. Discussion The pattern of neural activation we observed is consistent with earlier work showing that fasting increases activation of the hypo- thalamus, insula, and striatum (9, 10), while meal consumption increases activation of the PFC (9). In contrast to previous work, however, we isolated one physiological stimulus, glycemic state, and demonstrated that circulating glucose levels interact with external food cues to modulate reward-related brain activation and concurrent motivation for food. Specifically, the PFC activation and decreased wanting of food during euglycemia in non-obese individuals seems to be a general response to both high- and low- calorie foods. In contrast, the stimulation of brain reward regions and motivation for food under hypoglycemic relative to euglyce- mic conditions is dependent on the specific type of food, since only high-calorie food cues provoked a differential brain response and greater “wanting” of food. The role of the PFC in regulating impulse control and reduc- ing motivation for rewarding stimuli such as food and drugs is well established (11), whereas the limbic and reward regions (e.g., insula, VTA, and striatum) promote desire and craving for reward- ing stimuli (12). The thalamus acts as a relay between subcortical and cortical areas (13), and the hypothalamus is critical for fuel homeostasis and appetite control (1). Consistent with our find- ings, previous studies have demonstrated thalamic and hypotha- lamic activation under hypoglycemic conditions (14–16). The cur- rent data demonstrating oppositely directed modulation of PFC and brain reward center activation by circulating glucose support its role in stimulating executive control regions that exert inhibi- tory control of feeding behavior when glucose is available and promoting survival under hypoglycemic conditions by favoring instinctual motivation for food seeking and consumption when glucose is deficient. Interestingly, BMI significantly influenced this pattern of find- ings. In obese individuals mild hypoglycemia (relative to euglyce- mia) caused activation of the VTA and bilateral subcortical hypo- thalamic, thalamic, insula, and striatal activation, whereas these subjects lacked the prefrontal activation seen during euglycemia relative to hypoglycemia in nonobese subjects. These results are consistent with reports showing that high BMI is associated with decreased prefrontal activity at rest (17) and after meal consump- tion (18) and that obese subjects have an attenuated postprandial deactivation of the hypothalamus (19). These altered obesity-asso- 4164 The Journal of Clinical Investigation http://www.jci.org Volume 121 Number 10 October 2011
- 5. research article Figure 4 Condition × task effects. (A) Axial slices with group averages (n = 14), covaried for BMI, showing brain response to food (high-calorie and low-calorie) cues under euglycemia compared with mild hypoglycemia (threshold of P < 0.05, 2-tailed, FWE whole brain corrected). (B) Want- ing and liking ratings for food during euglycemia (gray bars) and mild hypoglycemia (black bars). *P = 0.02. (C) Brain response specifically to high-calorie food images under euglycemia compared with mild hypoglycemia (threshold of P < 0.05, 2-tailed, FWE whole brain corrected). (D) Wanting and liking ratings for high-calorie foods during euglycemia (gray bars) and mild hypoglycemia (black bars); **P = 0.006. Red/orange areas show greater activity, and blue areas indicate more suppressed activity during euglycemia relative to hypoglycemia. MNI coordinates were used to define brain regions. ciated neural responses to food cues may contribute to overeating rent study we observed that mild glucose reductions engage these behavior, especially several hours after consumption of high-car- brain motivational centers to increase hunger and food-seeking bohydrate meals, a time when glucose often declines significantly behavior. This effect was seen in the absence of changes in circu- below baseline levels (3, 4). lating insulin, leptin, or ghrelin but was associated with higher Glucose may also influence cortical regulation of feeding behav- levels of cortisol, which was positively correlated with activation of ior via its modulatory effects on midbrain neurons. Dopaminergic the insula and striatum. Behavioral studies in humans have shown and GABA neurons in the VTA have projections to many brain that stress-induced elevations in cortisol secretion increase prefer- regions, including the PFC (20), and glucose modulates GABA and ence for calorie-dense foods (28), and our findings may provide a dopamine release in the SN/VTA (21, 22). Hypoglycemia inhib- neural basis for this response. its nigral GABA release while simultaneously increasing striatal It should be noted that we manipulated glucose levels in the dopamine release, suggesting disinhibition of striatal neurons presence of fixed hyperinsulinemia to investigate its effects on (21), whereas hyperglycemia suppresses the firing of midbrain brain activation to visual food stimuli. Since insulin is known to dopaminergic neurons (22). Thus, increased medial PFC activity inhibit feeding behavior through its actions on hypothalamic (29) during euglycemia relative to hypoglycemia in nonobese subjects and mesolimbic reward circuitry (30), our results suggest that mild may occur due to glucose acting on midbrain neurons and their hypoglycemia overcomes the inhibitory effect of hyperinsulinemia projections to the medial PFC. On the other hand, obesity-related on hypothalamic and mesolimbic circuitry, promoting CNS path- metabolic changes and their concomitant effects on the midbrain ways subserving food motivation and reward. How the level of (SN/VTA)/medial PFC reward pathways may result in lower medial insulin and insulin resistance influence the magnitude of brain PFC brain responses, thereby putting obese individuals at greater and behavioral responses to food stimuli under euglycemic relative risk for food motivation, particularly if glucose declines. to hypoglycemic conditions requires further study. A number of peripheral hormones involved in feeding behavior, We did not detect a specific sex-related influence on the effects including leptin, peptide YY, and insulin, act as satiety signals and of circulating glucose on brain activation to visual food cues; have been shown to deactivate homeostatic and hedonic brain however, this may have been due the relatively small number of regions (23–26). In contrast, the gut-derived orexigenic hormone females studied. Previous imaging studies have shown sex-based ghrelin activates motivation and reward regions, including the differences in neural responses to food-related stimuli (31, 32) insula and striatum, in response to food stimuli (27). In the cur- and intravenous glucose (33) as well as in the pattern of neural The Journal of Clinical Investigation http://www.jci.org Volume 121 Number 10 October 2011 4165
- 6. research article Figure 5 Whole-brain, voxel-based correlation analyses. Axial brain slices and corresponding scatter plots showing correlations between (A) plasma glucose levels and VMPFC/ACC response to high-calorie food images; and (B) plasma cortisol levels and left and right insula/striatal response to high-calorie food images. P < 0.01, 2-tailed, FWE whole brain corrected. Areas in yellow indicate brain regions positively correlated to plasma glucose and plasma cortisol levels. There were no outliers in these associations. MNI coordinates were used to define brain regions. response to hunger and satiation (32, 34–36). However, no studies included a medical history, physical examination, and blood tests. Female have investigated potential sex-based differences in the neural and subjects were studied during the follicular phase of their menstrual cycle. behavioral response to food cues under hypoglycemia, and future We excluded individuals with a history of smoking, medical illness, hema- work in this area is warranted. tocrit less than 33%, elevated hemoglobin A1C, claustrophobia, and metal We conclude that the glycemic state modulates the complex implants, as well as vegetarians and those taking medications known to interplay between the PFC and hypothalamic and mesolimbic neu- influence metabolism. ral control of food-seeking behavior. Transient modest reductions Study protocol. On the fMRI study day, subjects reported to the Yale–New in circulating glucose decrease prefrontal cortical inhibitory con- Haven Hospital Research Unit at noon, where they ingested a standard- trol and could promote overeating, particularly in an environment ized lunch. Then, an intravenous catheter was inserted into a distal arm inundated with visual cues of high-calorie foods. These data imply or hand vein: this arm was gently heated, allowing for sampling of arte- that strategies to minimize postprandial decrements in glucose, rialized venous blood. A second intravenous catheter was established for including consumption of smaller, more frequent meals, may be the administration of insulin and glucose. One hour before the scanning helpful in reducing the risk of overeating high-calorie foods, par- session, participants received pre-training for the task. Subjects were given ticularly in obese individuals. a demonstration of the two rating scales and completed a block of 15 prac- tice trials. Subjects were informed that they would receive insulin during Methods the study and that their glucose levels would be reduced below normal, Study participants. Twenty-one healthy male (n = 12) and female (n = 9) vol- which could lead to symptoms of low blood sugar. They were, however, unteers with a mean (±SD) age of 31.4 ± 7.9 years and BMI of 25.2 ± 4 blinded to the timing of changes in glycemic state. kg/m2 who were weight stable for the 3 months before recruitment partici- Two hours after the standardized lunch, subjects began the 120-minute pated in this study. Fourteen subjects (9 male, 5 female; mean [±SD] age, fMRI study session, which included a stepped euglycemic-hypoglycemic 30.4 ± 7.9 years; BMI, 25.6 ± 4.6 kg/m2) participated in a stepped euglyce- study or euglycemic-euglycemic control study. Blood oxygen level–depen- mic-hypoglycemic study; 9 of these subjects were nonobese (BMI, 22.8 ± 2.9 dent (BOLD) acquisitions were obtained while subjects viewed high-calorie kg/m2), and 5 were obese (BMI, 30.9 ± 1.4 kg/m2). Seven subjects (3 male, food, low-calorie food, and non-food visual images during euglycemia and 4 female; mean [±SD] age, 33.6 ± 8.0 years; BMI, 24.3 ± 2.4 kg/m2) partici- hypoglycemia. Insulin was infused at a constant rate of 2 mU/kg/min, with pated in a euglycemic-euglycemic control study. We recruited subjects with a variable infusion of 20% glucose adjusted to achieve euglycemia or mild a range of BMIs that allowed us to investigate a distribution representa- hypoglycemia. This approach allowed us to examine the effects of mild tive of the general population; however, whole group statistical analyses hypoglycemia compared with euglycemia on brain activation and behav- were covaried for BMI. All subjects participated in a screening visit, which ioral responses to food cues. Blood sampling was performed at approxi- 4166 The Journal of Clinical Investigation http://www.jci.org Volume 121 Number 10 October 2011
- 7. research article Table 2 of food items (http://www.nal.usda.gov/fnic/foodcomp/search). The con- Caloric density in high- and low-calorie food items used as visual trol stimuli consisted of neutral, non-food pictures (e.g., building, basket, food stimuli book, bicycle, and door). Non-food pictures did not include utensils, so as not to confuse participants by associating them with food stimuli. There Food item kcal (per 100 g) were 8 fMRI runs, and each run included 21 randomized images of 7 high- calorie foods, 7 low-calorie foods, and 7 non-food items, resulting in a total High-calorie of 168 pictures (56 high-calorie, 56 low-calorie, and 56 non-food). Each Brownie 440 glycemic session (euglycemic and hypoglycemic) consisted of 4 runs with Cake 380 84 pictures (28 high-calorie, 28 low-calorie, 28 non-food). Each picture was Cheeseburger 270 presented only once for a participant, and stimuli were counterbalanced Chocolate 531 Cookies 450 and randomized across participants. Doughnut 400 Task and behavioral ratings. A series of pictures were presented during the French fries 320 euglycemic and hypoglycemic phases of the task. A fast event-related design Fried chicken 300 was used that included a “time-jitter” technique to effectively differentiate Ice cream 255 BOLD activity into separate events of interest within a trial (38). Each trial Lasagna 130 consisted of 3 events. First, a high-calorie food, low-calorie food, or non- Macaroni and cheese 371 food picture appeared for 6 seconds. After the picture presentation, two Pizza 270 rating scales (liking and wanting) appeared for 3 seconds. Rating scales Potato chips 559 consisted of numbers 1–9, with a rating of 1 indicating “not at all” and a Steak 250 rating of 9 indicating “very much.” To select their ratings, the participant Low-calorie pressed buttons using a non-ferromagnetic button box. At the end of a trial, Asparagus 22 a fixation cross appeared with a jittered inter-trial interval (mean, 6 seconds; Broccoli 35 range, 3–9 seconds), during which participants relaxed until the onset of the Carrots 88 next trial. Eight runs (4 during euglycemic phase and 4 during hypoglyce- Cauliflower 93 mic phase) were acquired, each lasting 6 minutes 36 seconds. Pictures were Corn 73 Fresh fruit 90 presented in random order and counterbalanced during each phase of the Fruit salad 90 study. Each picture was presented only once for each participant. Peas 89 fMRI acquisition. Images were obtained using a 3-T Siemens Trio MRI sys- Peppers 92 tem equipped with a standard quadrature head coil, using T2*-sensitive Garden salad 95 gradient-recalled single-shot echo planar pulse sequence. Subjects were Soybeans 63 positioned in the coil, and head movements were restrained using foam Tofu 87 pillows. Anatomical images of the functional slice locations were next Tomato 94 obtained with spin echo imaging in the axial plane parallel to the AC-PC Zucchini 95 line with repetition time (TR) = 300 ms, echo time (TE) = 2.46 ms, band- High-calorie food items were significantly greater than low-calorie food width = 310 Hz/pixel, flip angle = 60°, field of view = 220 × 220 mm, matrix items in caloric density (352 ± 118 vs. 79 ± 23 kcal/100 g); P < 0.001. = 256 × 256, 32 slices with slice thickness = 4 mm and no gap. Functional The USDA National Nutrient Database was used to determine the nutri- BOLD signals were then acquired with a single-shot gradient echo planar tional content of food items. imaging (EPI) sequence. Thirty-two axial slices parallel to the AC-PC line covering the whole brain were acquired with TR = 2,000 ms, TE = 25 ms, bandwidth = 2,520 Hz/pixel, flip angle = 85°, field of view = 220 × 220 mately 5-minute intervals for glucose measurements and at 10- to 20-min- mm, matrix = 64 × 64, 32 slices with slice thickness = 4 mm and no gap, ute intervals for measurements of plasma insulin, C-peptide, epinephrine, 198 measurements. At the end of the functional imaging, a high-resolu- cortisol, glucagon, growth hormone, ghrelin, and leptin. tion 3D magnetization-prepared rapid gradient echo (MPRAGE) sequence Visual stimuli. Tasks were presented using E-Prime software (Psychologi- (TR = 2530 ms; TE = 2.62 ms; bandwidth = 240 Hz/pixel; flip angle = 9°; cal Software Tools Inc.). Picture stimuli for fMRI consisted of high-calorie slice thickness = 1 mm; field of view = 256 × 256 mm; matrix = 256 × 256) food, low-calorie food, and non-food neutral pictures. Pictures were selected was used to acquire sagittal images for multi-subject registration. from various Web sites and from the International Affective Picture System fMRI analysis. All data were converted from Digital Imaging and Commu- (37). High-calorie and low-calorie food pictures were balanced to ensure nication in Medicine (DICOM) format to Analyze format using XMedCon equivalent levels of emotional valence across glycemia sessions. All food (xmedcon.sourceforge.net) (39). During the conversion process, the first pictures had been previously rated on affective valence in a pilot study per- 3 images at the beginning of each of the 6 functional series were discarded formed outside the MRI scanner, and there was no statistical difference in to enable the signal to achieve steady-state equilibrium between radio affective valence between high- and low-calorie food items. Participants in frequency pulsing and relaxation, leaving 195 measurements for analysis. the pilot study were of age and BMI similar to those of the participants in Images were motion corrected for 3 translational and 3 rotational direc- the fMRI study. High-calorie food pictures included items such as ham- tions (40). Trials with linear motion in excess of 1.5 mm or rotation greater burgers, French fries, cookies, ice cream, chocolate, and pizza. Low-calorie than 2 degrees were discarded. The first run of each phase was removed food pictures included items such as salads, broccoli, bean sprouts, tofu, (leaving 3 runs for each phase) because some subjects had not achieved and fruits. High-calorie food items were significantly greater than low- the target mild hypoglycemic level prior to the first run. Individual subject calorie food items in caloric density (352 ± 118 vs. 79 ± 23 kcal/100 g) and data were analyzed using a general linear model (GLM) on each voxel in the fat content (16.6 ± 9 vs. 1.2 ± 2.5 g/100 g) (P < 0.001, Table 2). The USDA entire brain volume with 3 regressors specific for the task. The regressors National Nutrient Database was used to determine the nutritional content were those images that pertained to the time when the subject was viewing The Journal of Clinical Investigation http://www.jci.org Volume 121 Number 10 October 2011 4167
- 8. research article the high-calorie food image, low-calorie food image, or non food image. The factors in the models included session type (euglycemia or hypoglyce- resulting functional images for each image type were spatially smoothed mia), food task (non-food, low-calorie, high-calorie), and their interaction with a 6-mm Gaussian kernel to account for variations in the location of for liking and wanting ratings. For hunger ratings the model included activation across subjects. The output maps were normalized beta-maps, session type and time of rating and their interaction. Post hoc linear con- which were in the acquired space (3.44 mm × 3.44 mm × 4 mm). trasts (2-tailed 0.05 significance level) were corrected for multiple com- To take these data into a common reference space, 3 registrations were parisons using a modified Bonferroni procedure. A random subject effect calculated within the Yale BioImage Suite software package (http://www. was included to account for the correlation of repeated assessments from bioimagesuite.org) (41, 42). The first registration performs a linear reg- each subject. All analyses were adjusted for BMI. Residual analysis was istration between the individual subject raw functional image and that performed to confirm that outcomes did not depart from the assump- subject’s 2D anatomical image. The 2D anatomical image is then linearly tion of normality. Paired t tests were performed on hormonal data registered to the individual’s 3D anatomical image. The 3D differs from averaged across euglycemia and hypoglycemia. A P value less than 0.05 the 2D in that it has a 1 × 1 × 1–mm resolution, whereas the 2D z-dimen- was considered significant. Unless otherwise stated, data are presented sion is set by slice thickness and its x-y dimensions are set by voxel size. as mean ± SEM. Finally, a nonlinear registration is computed between the individual 3D Study approval. All participants provided informed consent prior to anatomical image and a reference 3D image. The reference brain used was participation in this study. All aspects of the study were approved by the the Colin27 Brain (43), which is in Montreal Neurological Institute (MNI) Human Investigation Committee at the Yale School of Medicine, New space (44) and is commonly applied in SPM and other software packages. Haven, Connecticut, USA. All 3 registrations were applied sequentially to the individual normalized beta-maps to bring all data into the common reference space. Acknowledgments Data were converted to AFNI format (ref. 45; http://afni.nimh.nih.gov) We thank Ellen Hintz, Anne O’Connor, Darlene Tempesta, Karen for group analysis. We applied a linear mixed effects (LME) model (con- Martin, Hedy Sarofin, Terry Hickey, Kristen A. Tsou, Mikhail dition, which was either euglycemia or hypoglycemia, by task, which was Smolgovsky, Ralph Jacob, Codruta Todeasa, and Aida Groszmann either non-food, low-calorie food, or high-calorie food images) in which the for their assistance, as well as the subjects who participated in subject was treated as a random factor, covarying for BMI using the LME this study. This work was supported by in part by grants from the modeling program 3dLME from AFNI (http://afni.nimh.nih.gov/sscc/ NIH (DK 20495, P30 DK 45735, T32 DA022975, T32 DK07058), gangc/lme.html). Results were masked and converted back into ANALYZE the NIH Common Fund (UL1-DE019586, PL1-DA024859), the format for viewing in BioImage Suite. Whole-brain, voxel-based correlation Yale Center for Clinical Investigation supported by Clinical and analyses with plasma glucose and cortisol levels were implemented using Translational Science Award grant UL1 RR024139, and the BioImageSuite (41, 42) with the application of AFNI AlphaSim family-wise Yale Stress Center. error (FWE) correction for multiple comparisons. All data analyses were based on 2-tailed tests. Received for publication March 4, 2011, and accepted in revised Biochemical analysis. Plasma glucose was measured enzymatically using form July 27, 2011. glucose oxidase (YSI). Double-antibody radioimmunoassay was used to measure plasma insulin, ghrelin, leptin, and glucagon (Millipore) and cor- Address correspondence to: Robert S. Sherwin, C.N.H. Long Pro- tisol (Diagnostic Products Corp.). Plasma epinephrine was measured by fessor of Medicine, Director, Yale Center for Clinical Investigation, high-performance liquid chromatography (ESA). Yale School of Medicine, The Anlyan Center S141, PO Box 208020 Statistics. Analyses of ratings for liking, wanting, and hunger were con- New Haven, Connecticut 06520-8020, USA. Phone: 203.785.4183; ducted using LME models (PROC MIXED version 9.2, SAS) (46). Fixed Fax: 203.737.5558; E-mail: robert.sherwin@yale.edu. 1. Marty N, Dallaporta M, Thorens B. Brain glucose ullary response and increased susceptibility to neu- Diabetes. 2009;58(2):448–452. sensing, counterregulation, and energy homeosta- roglycopenia: mechanisms underlying the adverse 15. Arbelaez AM, Powers WJ, Videen TO, Price JL, Cryer sis. Physiology (Bethesda). 2007;22(4):241–251. effects of sugar ingestion in healthy children. J Pedi- PE. Attenuation of counterregulatory responses to 2. Levin BE, Routh VH, Kang L, Sanders NM, atr. 1995;126(2):171–177. recurrent hypoglycemia by active thalamic inhibi- Dunn-Meynell AA. Neuronal glucosensing: 9. Tataranni PA, et al. Neuroanatomical correlates of tion: a mechanism for hypoglycemia-associated what do we know after 50 years? Diabetes. 2004; hunger and satiation in humans using positron autonomic failure. Diabetes. 2008;57(2):470–475. 53(10):2521–2528. emission tomography. Proc Natl Acad Sci U S A. 1999; 16. Teh MM, et al. Evolution and resolution of human 3. Melanson KJ Westerterp-Plantenga MS, Saris WH 96(8):4569–4574. brain perfusion responses to the stress of induced Smith FJ, Campfield LA. Blood glucose patterns and 10. Hinton EC, Parkinson JA, Holland AJ, Arana FS, hypoglycemia. Neuroimage. 2010;53(2):584–592. appetite in time-blinded humans: carbohydrate ver- Roberts AC, Owen AM. Neural contributions to the 17. Volkow ND, et al. Inverse association between BMI sus fat. Am J Physiol. 1999;277(2 pt 2):R337–R345. motivational control of appetite in humans. Eur J and prefrontal metabolic activity in healthy adults. 4. Chaput JP, Tremblay A. The glucostatic theory of Neurosci. 2004;20(5):1411–1418. Obesity (Silver Spring). 2009;17(1):60–65. appetite control and the risk of obesity and diabe- 11. Ridderinkhof KR, van den Wildenberg WP, Sega- 18. Le DS, et al. Less activation of the left dorsolateral tes. Int J Obes (Lond). 2009;33(1):46–53. lowitz SJ, Carter CS. Neurocognitive mechanisms prefrontal cortex in response to a meal: a feature of 5. Thompson DA, Campbell RG. Hunger in humans of cognitive control: the role of prefrontal cortex in obesity. Am J Clin Nutr. 2006;84(4):725–731. induced by 2-deoxy-D-glucose: glucoprivic con- action selection, response inhibition, performance 19. Gautier JF, et al. Differential brain responses to trol of taste preference and food intake. Science. monitoring, and reward-based learning. Brain Cogn. satiation in obese and lean men. Diabetes. 2000; 1977;198(4321):1065–1068. 2004;56(2):129–140. 49(5):838–846. 6. Dewan S, Gillett A, Mugarza JA, Dovey TM, Half- 12. Naqvi NH, Rudrauf D, Damasio H, Bechara A. 20. Carr DB, Sesack SR. GABA-containing neurons in ord JC, Wilding JP. Effects of insulin-induced hypo- Damage to the insula disrupts addiction to ciga- the rat ventral tegmental area project to the pre- glycaemia on energy intake and food choice at a rette smoking. Science. 2007;315(5811):531–534. frontal cortex. Synapse. 2000;38(2):114–123. subsequent test meal. Diabetes Metab Res Rev. 2004; 13. Sherman SM. The thalamus is more than just a 21. During MJ, Leone P, Davis KE, Kerr D, Sherwin 20(5):405–410. relay. Curr Opin Neurobiol. 2007;17(4):417–422. RS. Glucose modulates rat substantia nigra GABA 7. McCrimmon RJ, Sherwin RS. Hypoglycemia in type 14. Page KA, Arora J, Qiu M, Relwani R, Constable RT, release in vivo via ATP-sensitive potassium chan- 1 diabetes. Diabetes. 2010;59(10):2333–2339. Sherwin RS. Small decrements in systemic glucose nels. J Clin Invest. 1995;95(5):2403–2408. 8. Jones TW, Borg WP, Boulware SD, McCarthy G, provoke increases in hypothalamic blood flow 22. Saller CF, Chiodo LA. Glucose suppresses basal fir- Sherwin RS, Tamborlane WV. Enhanced adrenomed- prior to the release of counterregulatory hormones. ing and haloperidol-induced increases in the firing 4168 The Journal of Clinical Investigation http://www.jci.org Volume 121 Number 10 October 2011
- 9. research article rate of central dopaminergic neurons. Science. 1980; 31. Cornier MA, Salzberg AK, Endly DC, Bessesen DH, image conversion toolkit. Eur J Nucl Med. 2003; 210(4475):1269–1271. Tregellas JR. Sex-based differences in the behav- 30(suppl 2):S246. 23. Batterham RL, et al. PYY modulation of cortical and ioral and neuronal responses to food. Physiol Behav. 40. Friston KJ, Williams S, Howard R, Frackowiak RS, hypothalamic brain areas predicts feeding behav- 2010;99(4):538–543. Turner R. Movement-related effects in fMRI time- iour in humans. Nature. 2007;450(7166):106–109. 32. Uher R, Treasure J, Heining M, Brammer MJ, Camp- series. Magn Reson Med. 1996;35(3):346–355. 24. Baicy K, et al. Leptin replacement alters brain response bell IC. Cerebral processing of food-related stim- 41. Duncan JS, Papademetris X, Yang J, Jackowski M, to food cues in genetically leptin-deficient adults. Proc uli: effects of fasting and gender. Behav Brain Res. Zeng X, Staib LH. Geometric strategies for neu- Natl Acad Sci U S A. 2007;104(46):18276–18279. 2006;169(1):111–119. roanatomic analysis from MRI. Neuroimage. 2004; 25. Rosenbaum M, Sy M, Pavlovich K, Leibel RL, Hirsch 33. Haltia LT, et al. Effects of intravenous glucose on 23(suppl 1):S34–S45. J. Leptin reverses weight loss-induced changes in dopaminergic function in the human brain in vivo. 42. Papademetris X, Jackowski M, Rajeevan N, Con- regional neural activity responses to visual food Synapse. 2007;61(9):748–756. stable RT, Staib LH. BioImage Suite: An integrated stimuli. J Clin Invest. 2008;118(7):2583–2591. 34. Wang GJ, et al. Evidence of gender differences in medical image analysis suite, Section of Bioimag- 26. Guthoff M, et al. Insulin modulates food-related the ability to inhibit brain activation elicited by ing Sciences, Department of Diagnostic Radiology, activity in the central nervous system. J Clin Endo- food stimulation. Proc Natl Acad Sci U S A. 2009; Yale School of Medicine. Bioimage Suite. http:// crinol Metab. 2010;95(2):748–755. 106(4):1249–1254. www.bioimagesuite.org. Accessed July 28, 2011. 27. Malik S, McGlone F, Bedrossian D, Dagher A. Ghre- 35. Smeets PA, de Graaf C, Stafleu A, van Osch MJ, 43. Holmes CJ, Hoge R, Collins L, Woods R, Toga AW, lin modulates brain activity in areas that control Nievelstein RA, van der Grond J. Effect of satiety on Evans AC. Enhancement of MR images using regis- appetitive behavior. Cell Metab. 2008;7(5):400–409. brain activation during chocolate tasting in men tration for signal averaging. J Comput Assist Tomogr. 28. Epel E, Lapidus R, McEwen B, Brownell K. Stress and women. Am J Clin Nutr. 2006;83(6):1297–1305. 1998;22(2):324–333. may add bite to appetite in women: a laboratory 36. Del Parigi A, et al. Sex differences in the human 44. Evans AC, Collins DL, Mills SR, Brown ED, Kelly RL, study of stress-induced cortisol and eating behav- brain’s response to hunger and satiation. Am J Clin Peters TM. 3D statistical neuroanatomical models ior. Psychoneuroendocrinology. 2001;26(1):37–49. Nutr. 2002;75(6):1017–1022. from 305 MRI volumes. In Nuclear Science Symposium 29. Figlewicz DP, Sipols AJ. Energy regulatory signals 37. Lang PJ, Bradley MM, Cuthbert BN, eds. Interna- and Medical Imaging Conference. San Francisco, USA; and food reward. Pharmacol Biochem Behav. 2010; tional Affective Picture System (Iaps): Technical Manual 1993:1813–1817. 97(1):15–24. And Affective Ratings. Gainesville, Florida, USA: Uni- 45. Cox RW. AFNI: software for analysis and visualiza- 30. Figlewicz DP, Bennett JL, Aliakbari S, Zavosh A, versity of Florida, Center for Research in Psycho- tion of functional magnetic resonance neuroim- Sipols AJ. Insulin acts at different CNS sites to physiology; 1999. ages. Comput Biomed Res. 1996;29(3):162–173. decrease acute sucrose intake and sucrose self- 38. Dale AM. Optimal experimental design for event- 46. Brown H, Prescott R. Applied Mixed Models in Medi- administration in rats. Am J Physiol Regul Integr Comp related fMRI. Hum Brain Mapp. 1999;8(2–3):109–114. cine. Chichester, United Kingdom: John Wiley and Physiol. 2008;295(2):R388–R394. 39. Nolf E. XMedCon — an open-source medical Sons; 1999. The Journal of Clinical Investigation http://www.jci.org Volume 121 Number 10 October 2011 4169