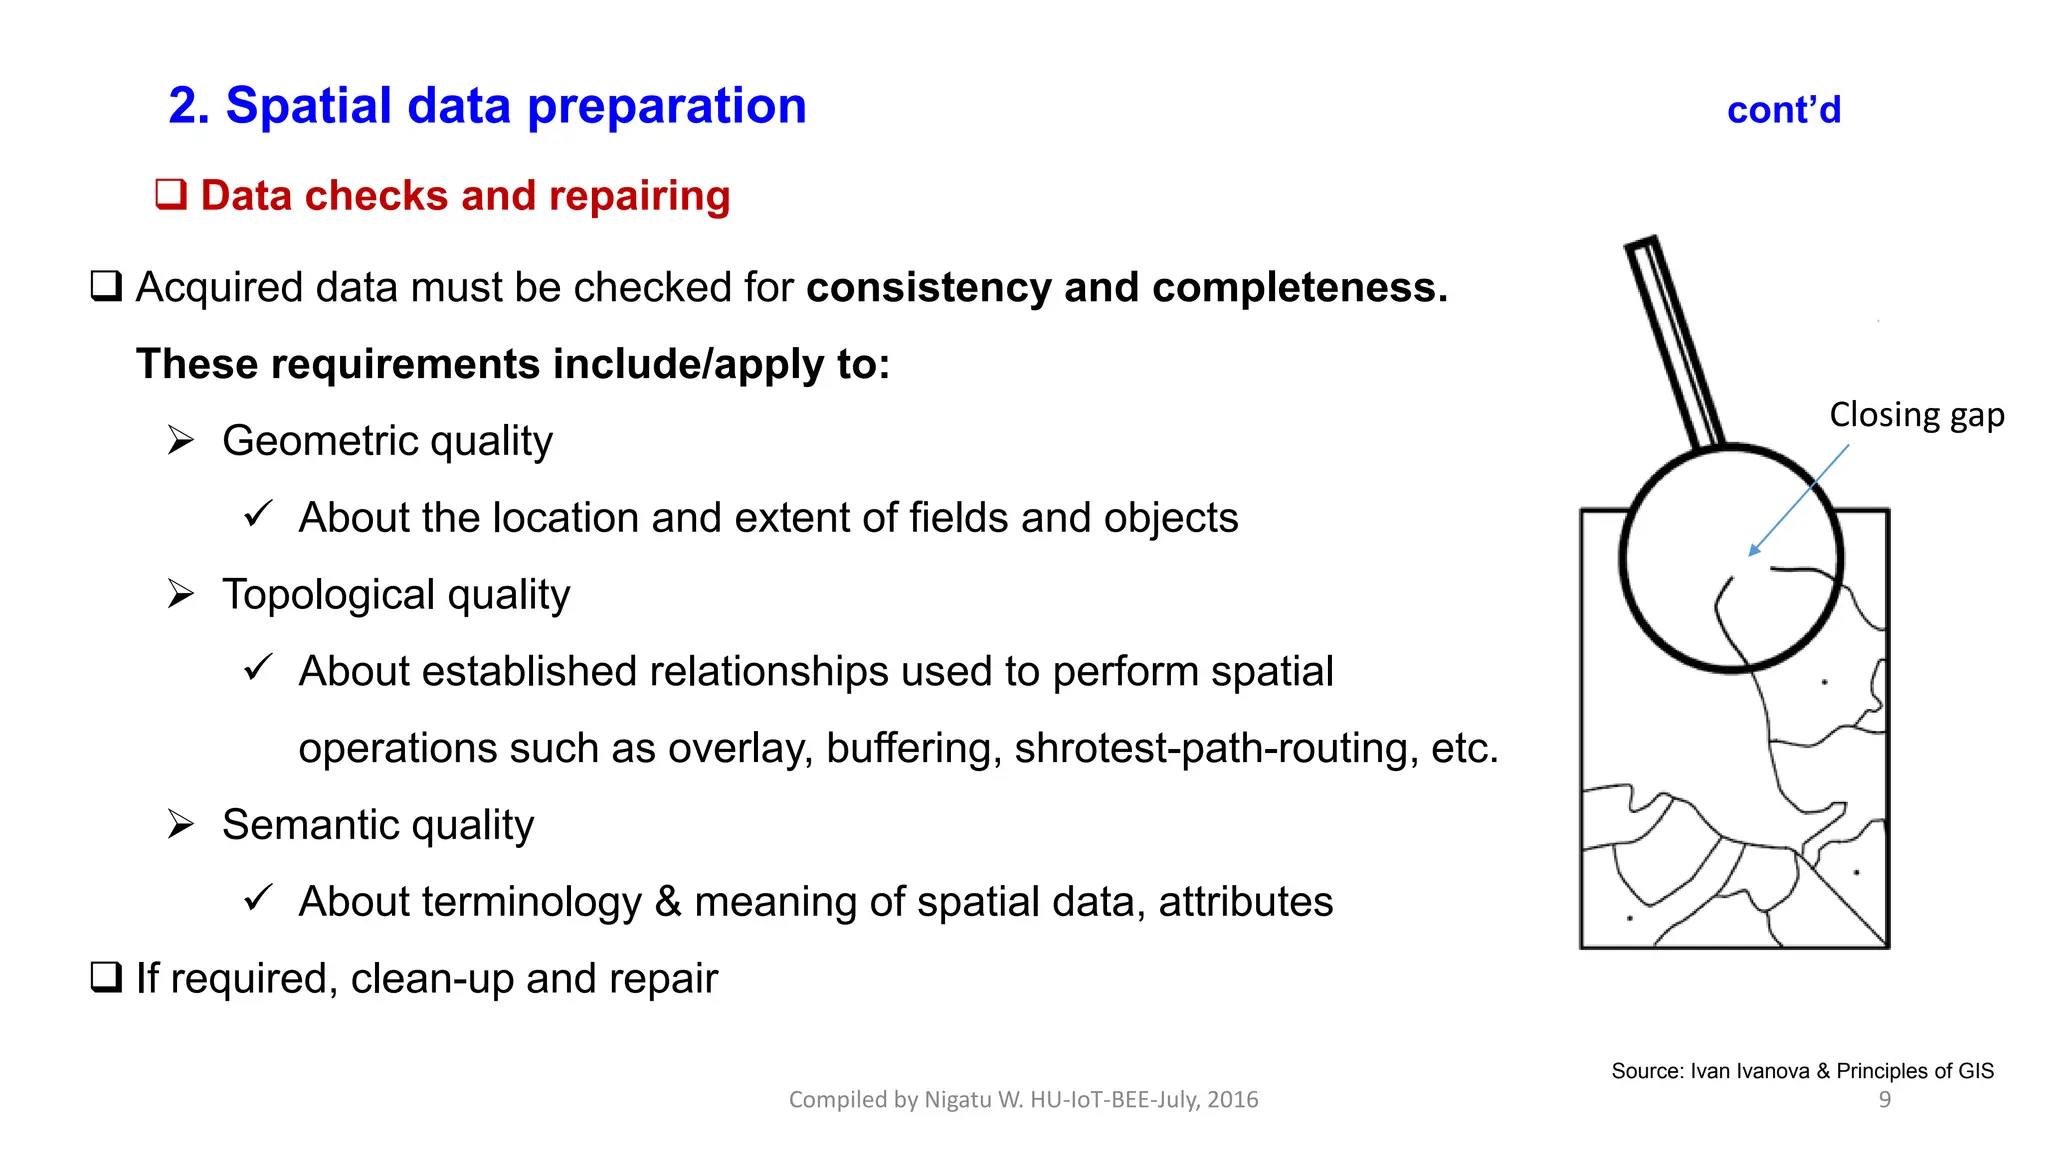
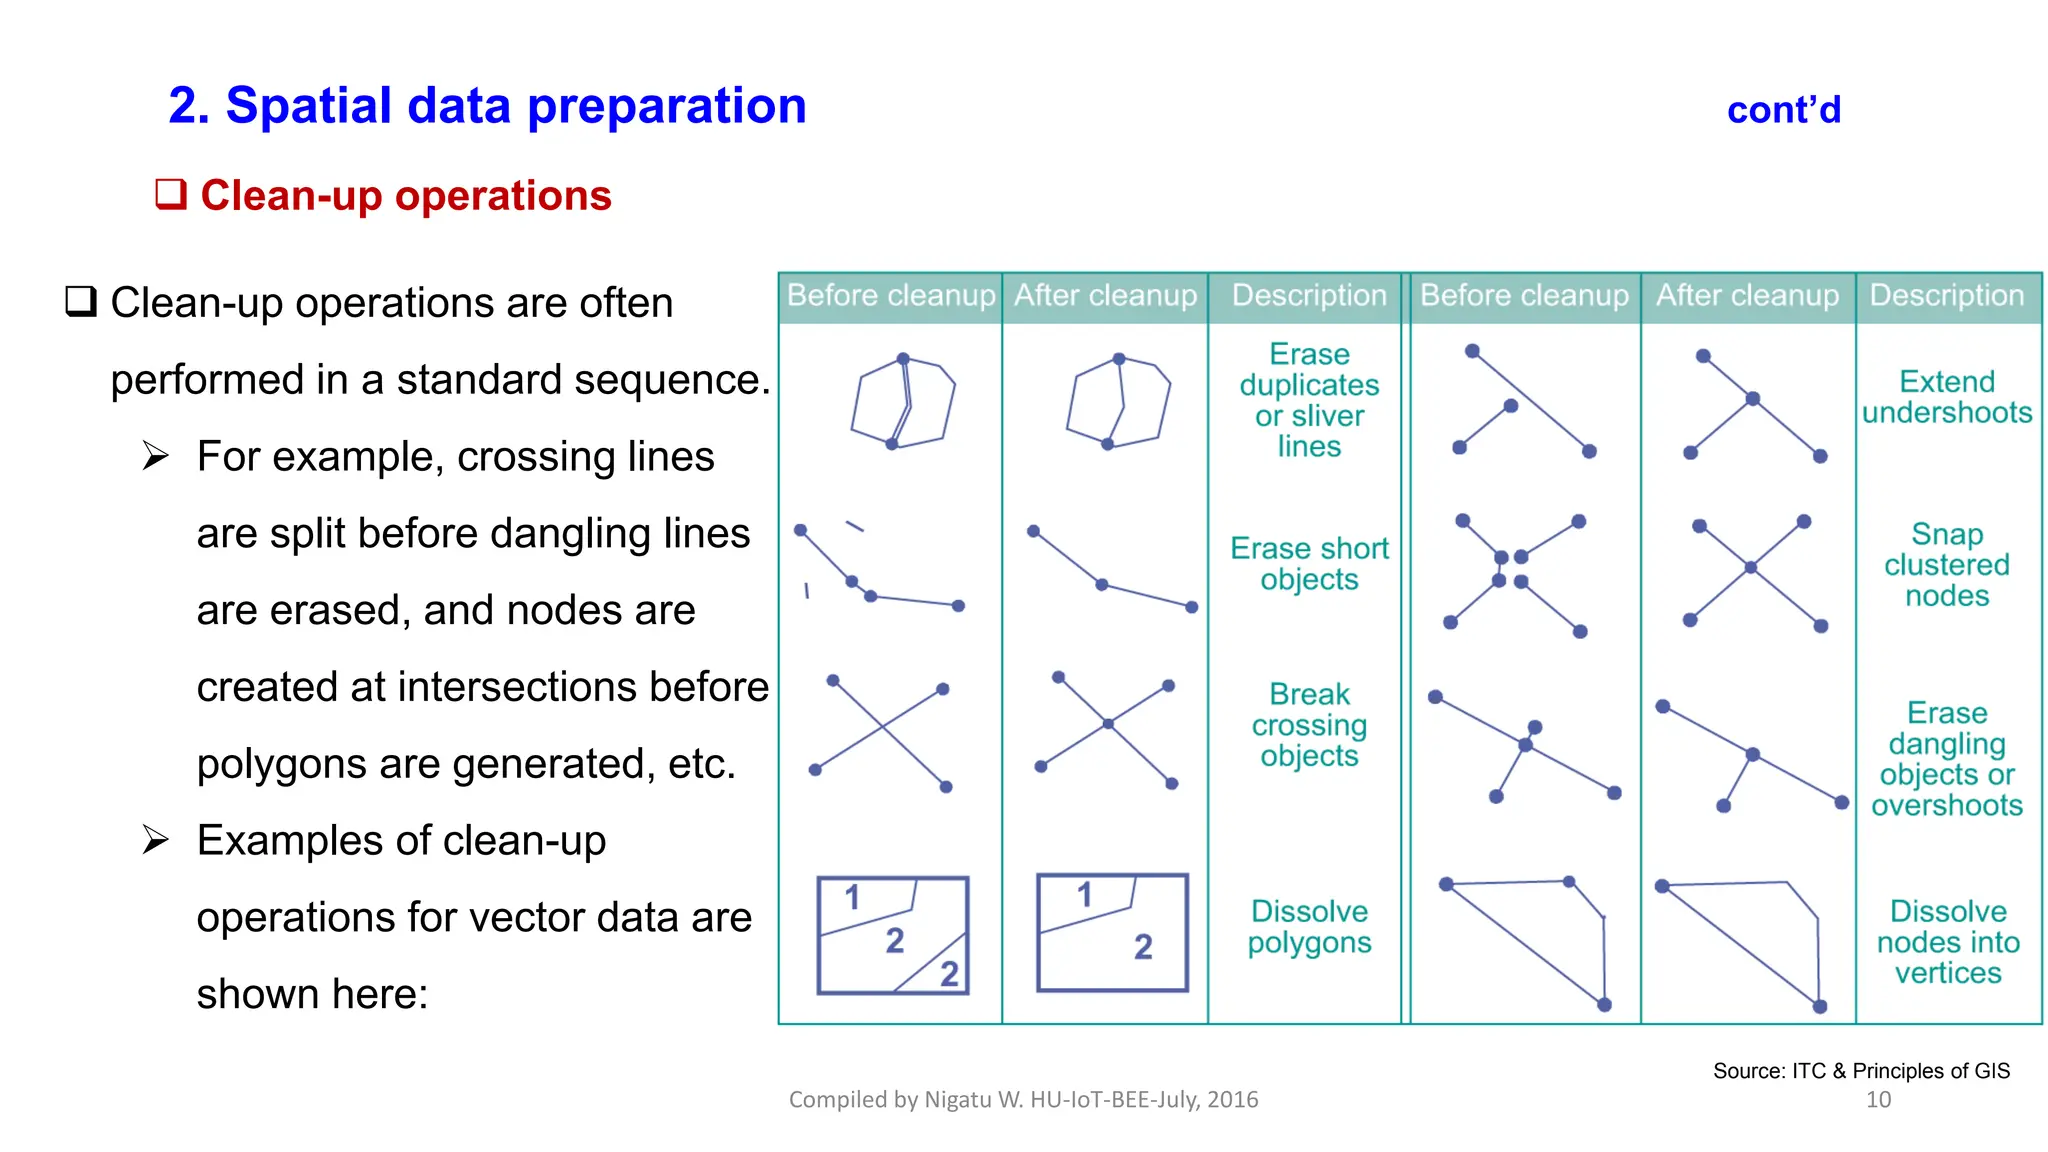
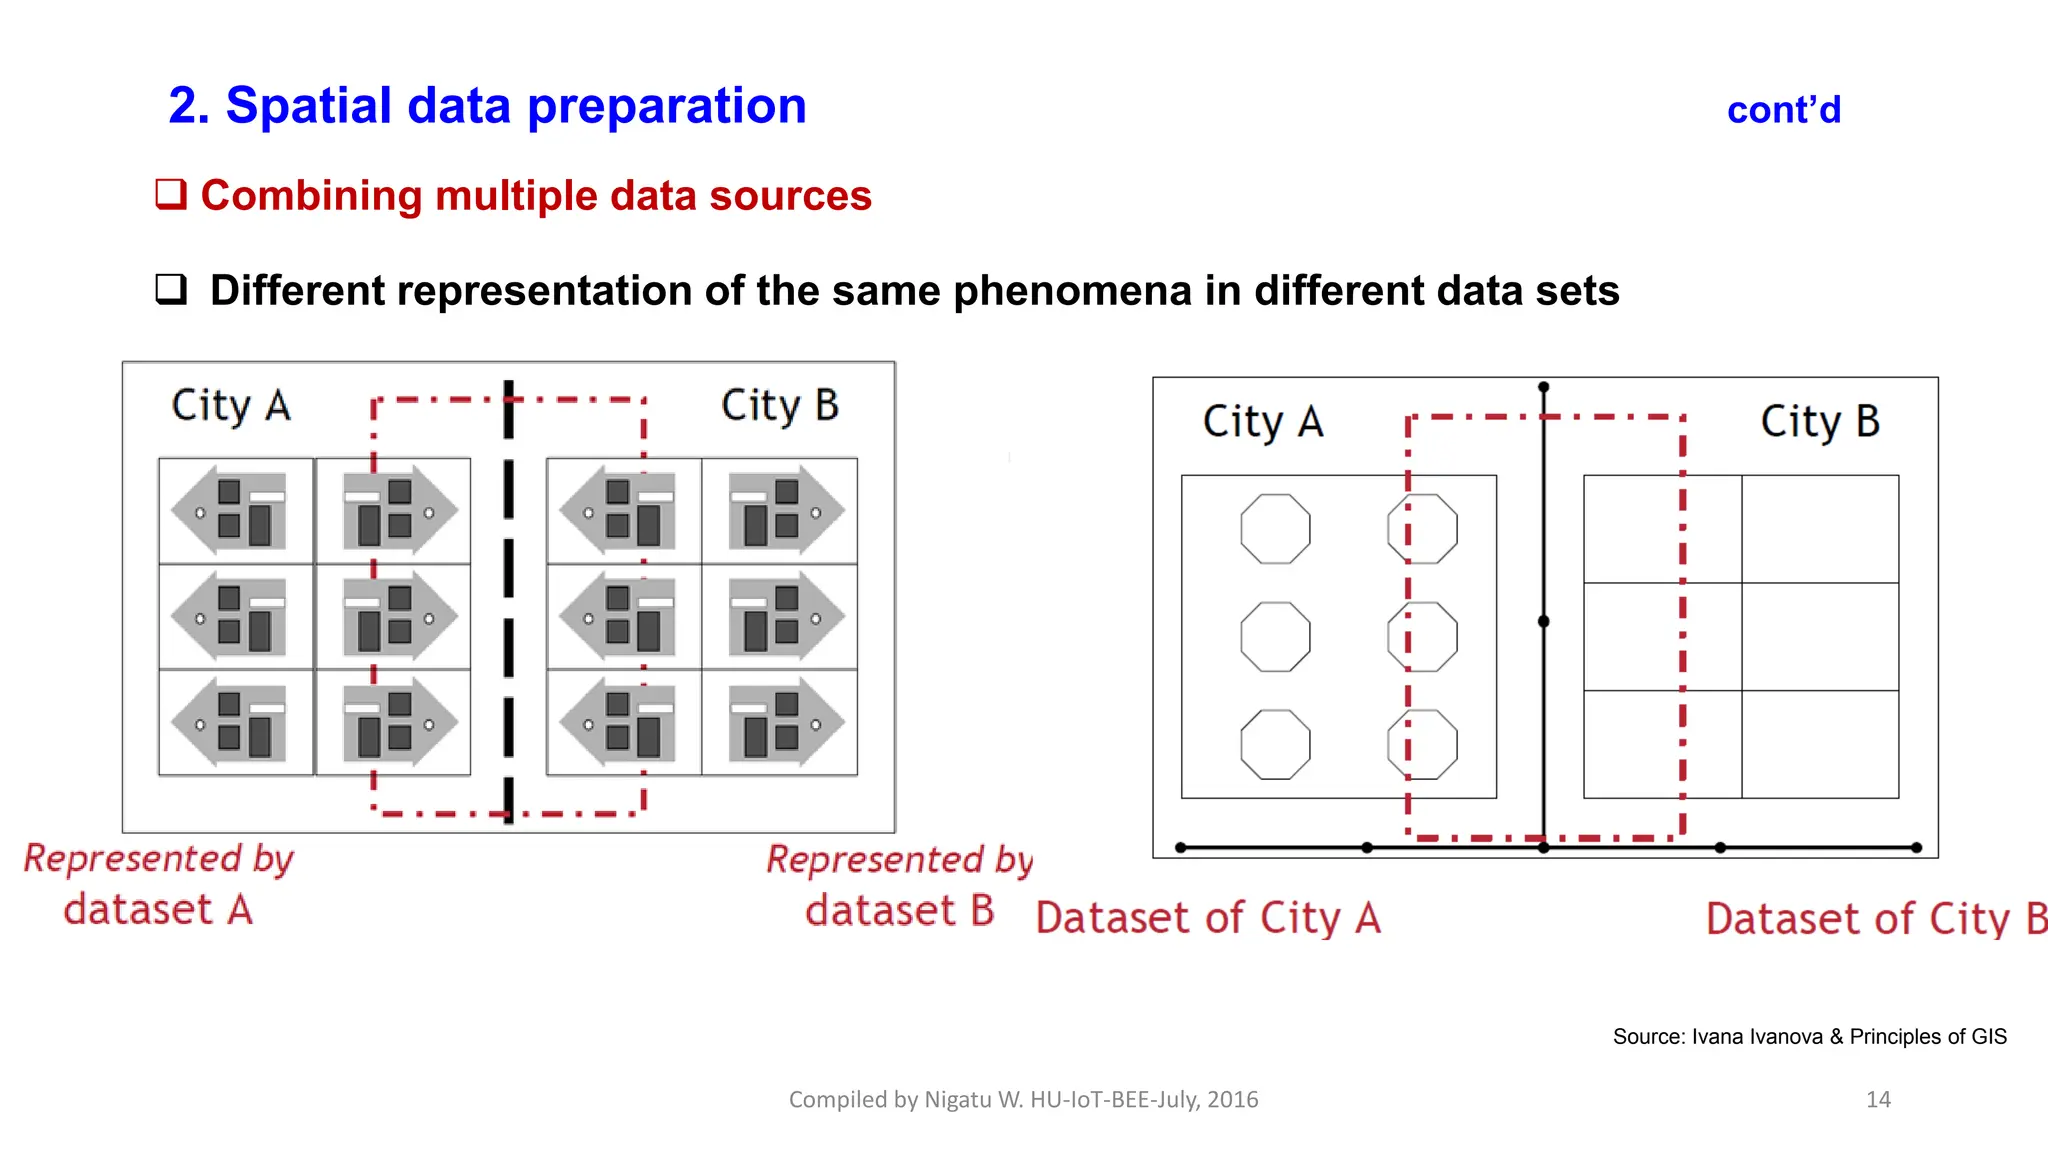
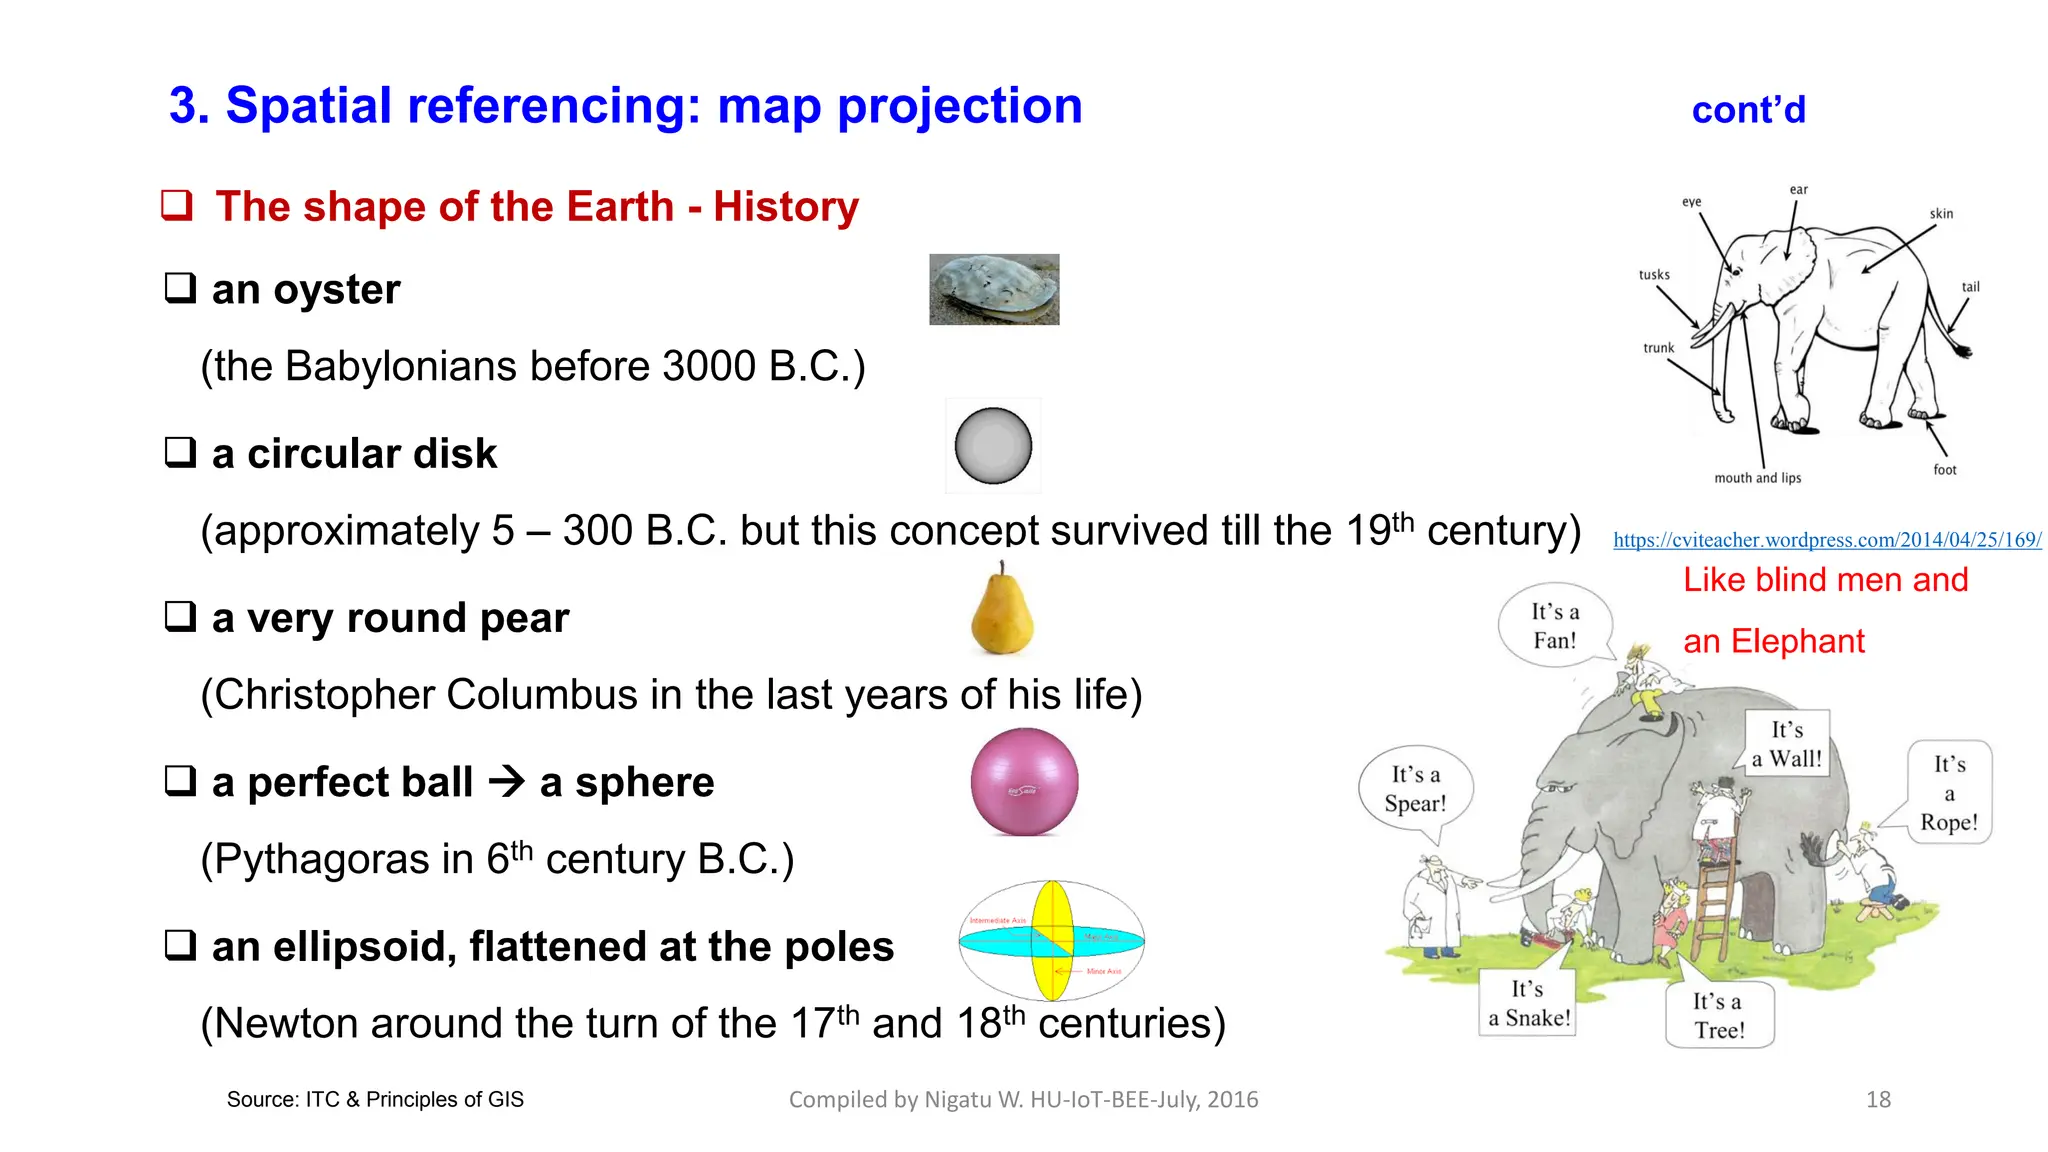
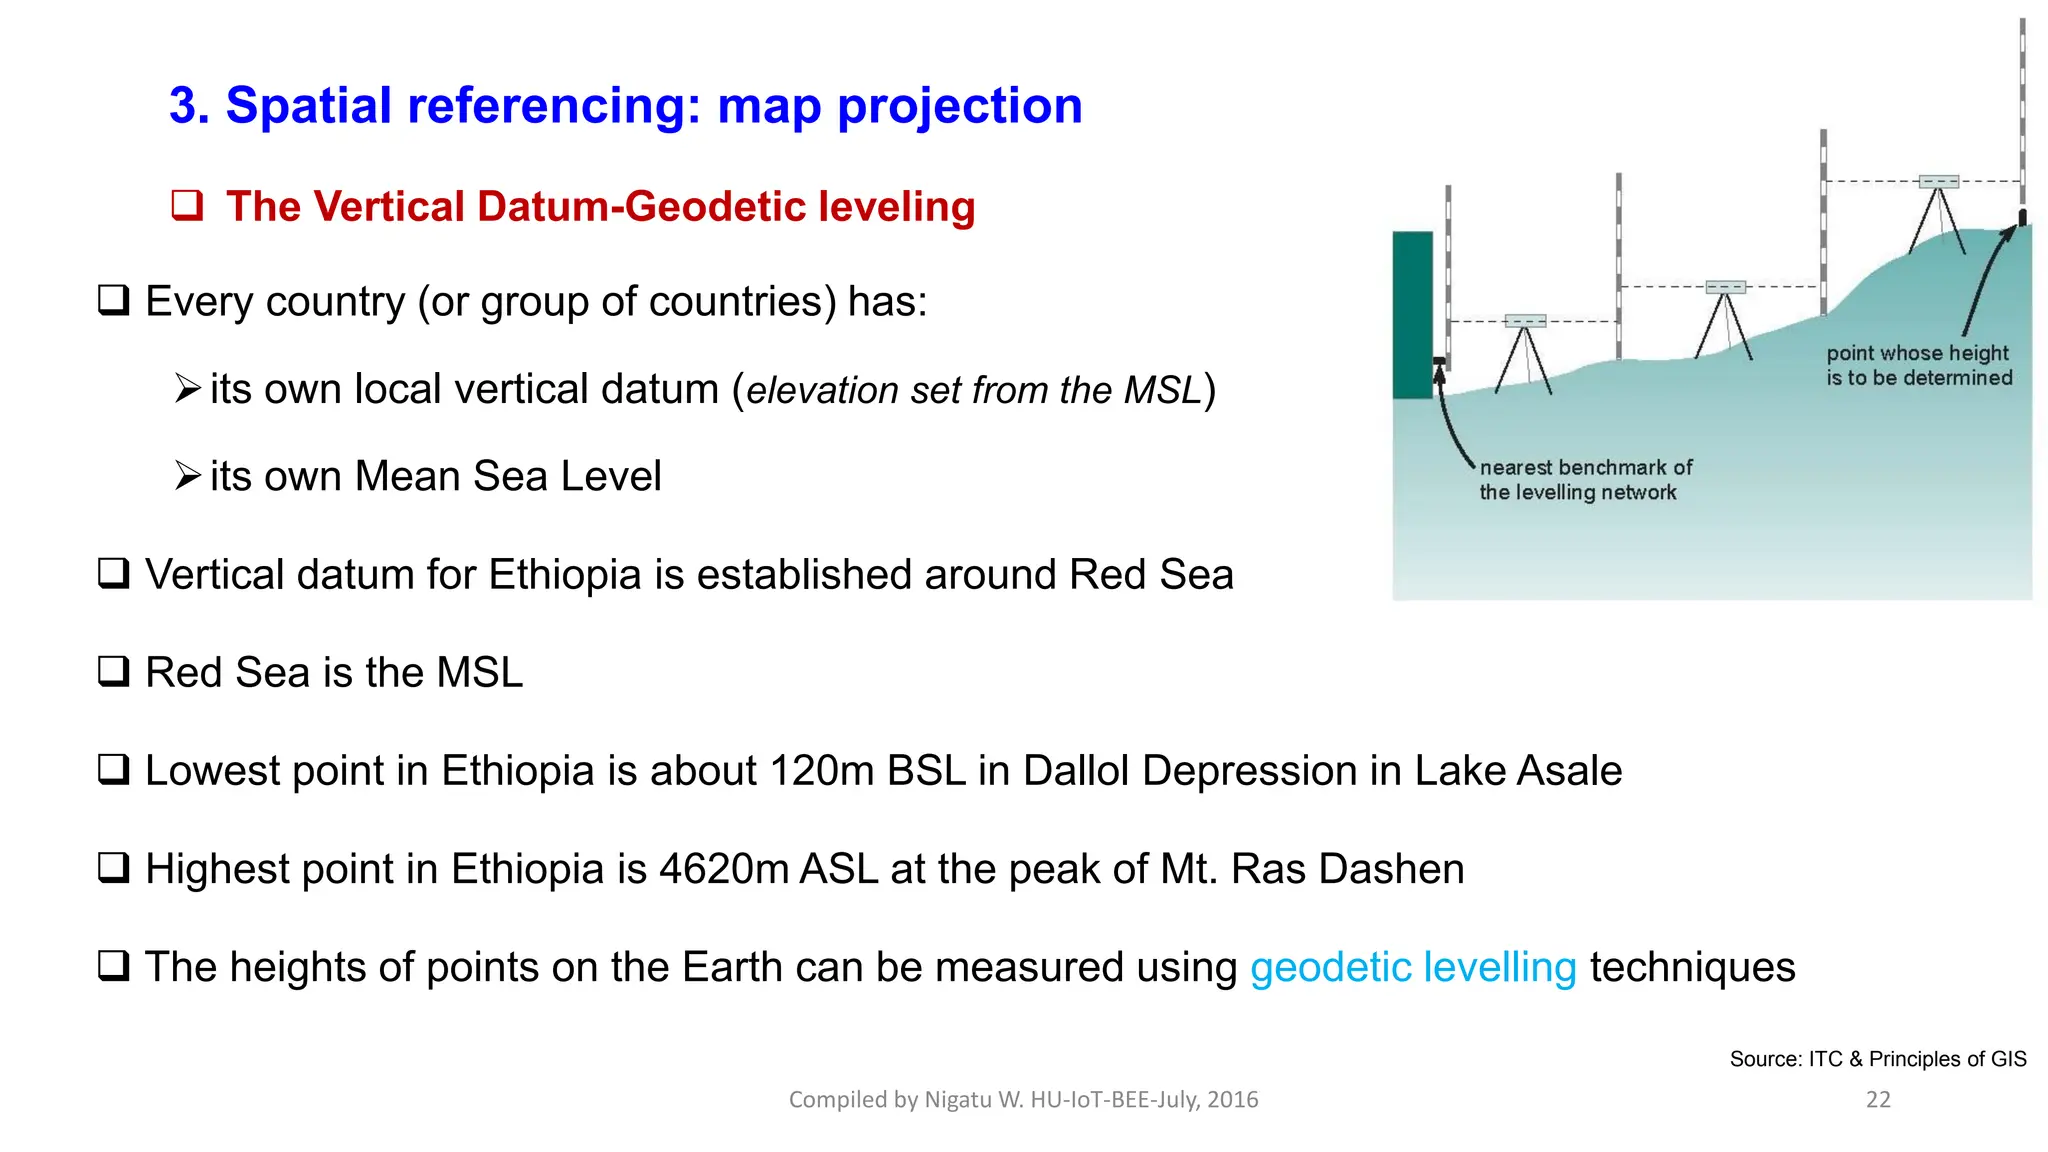
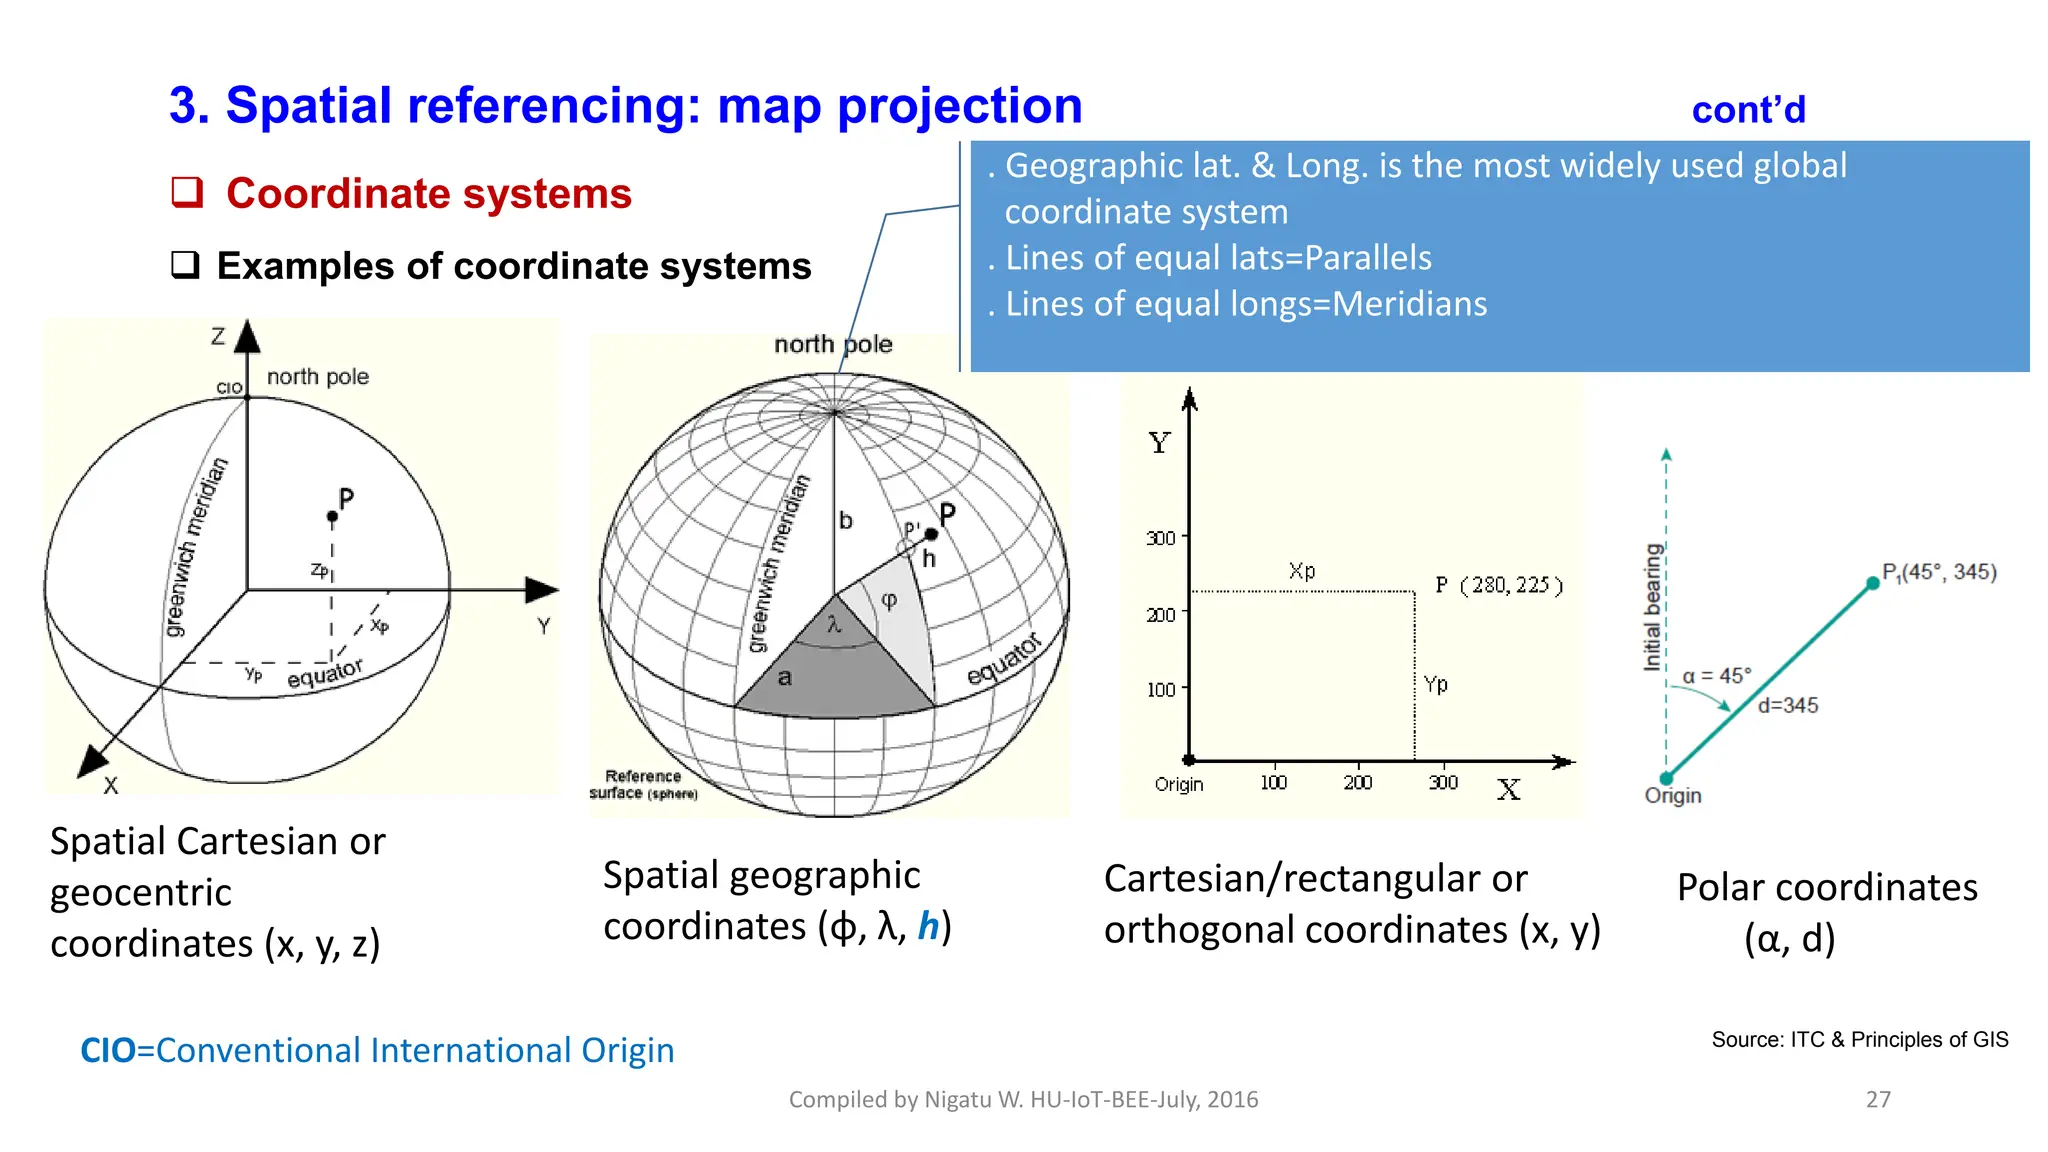
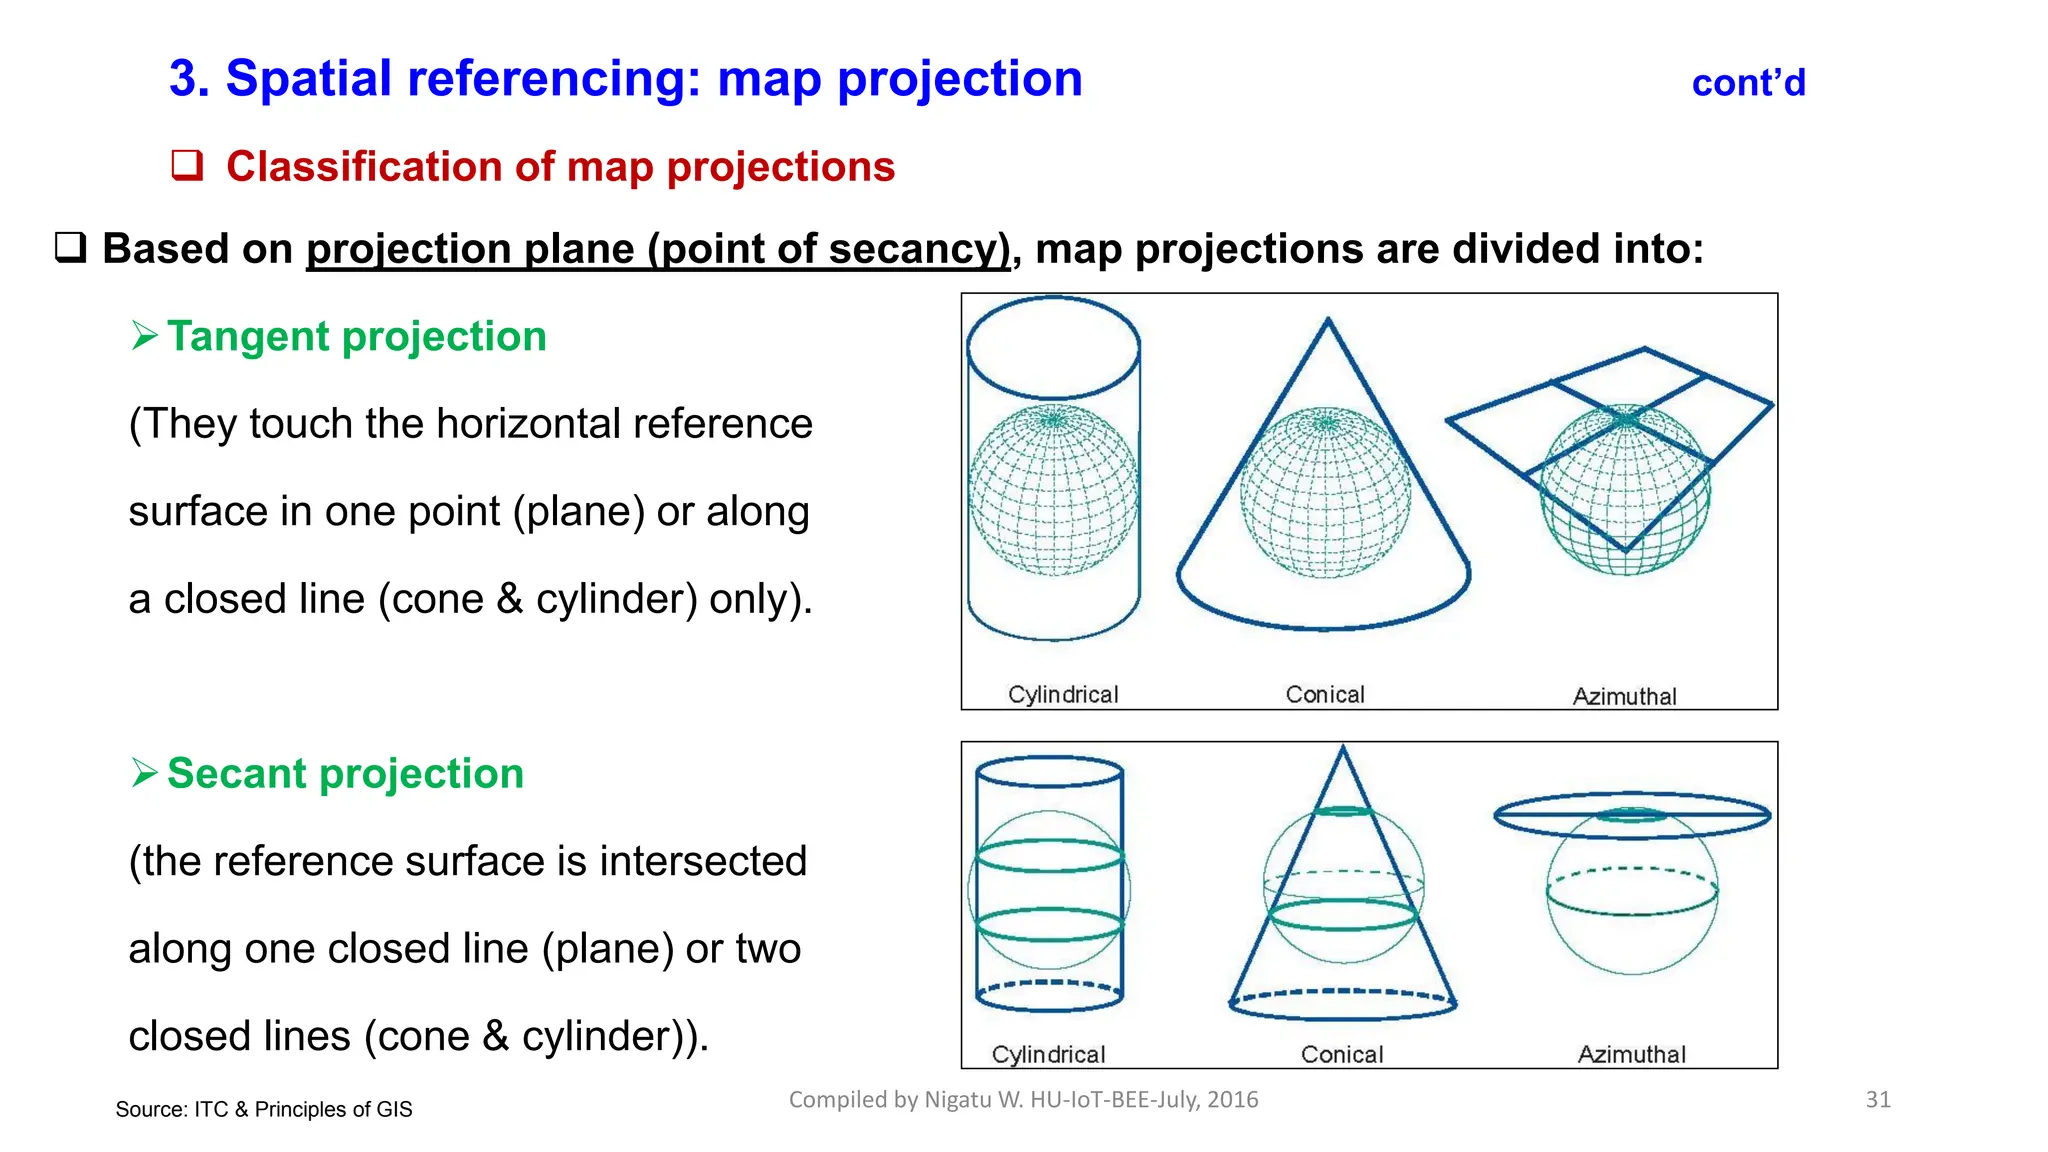
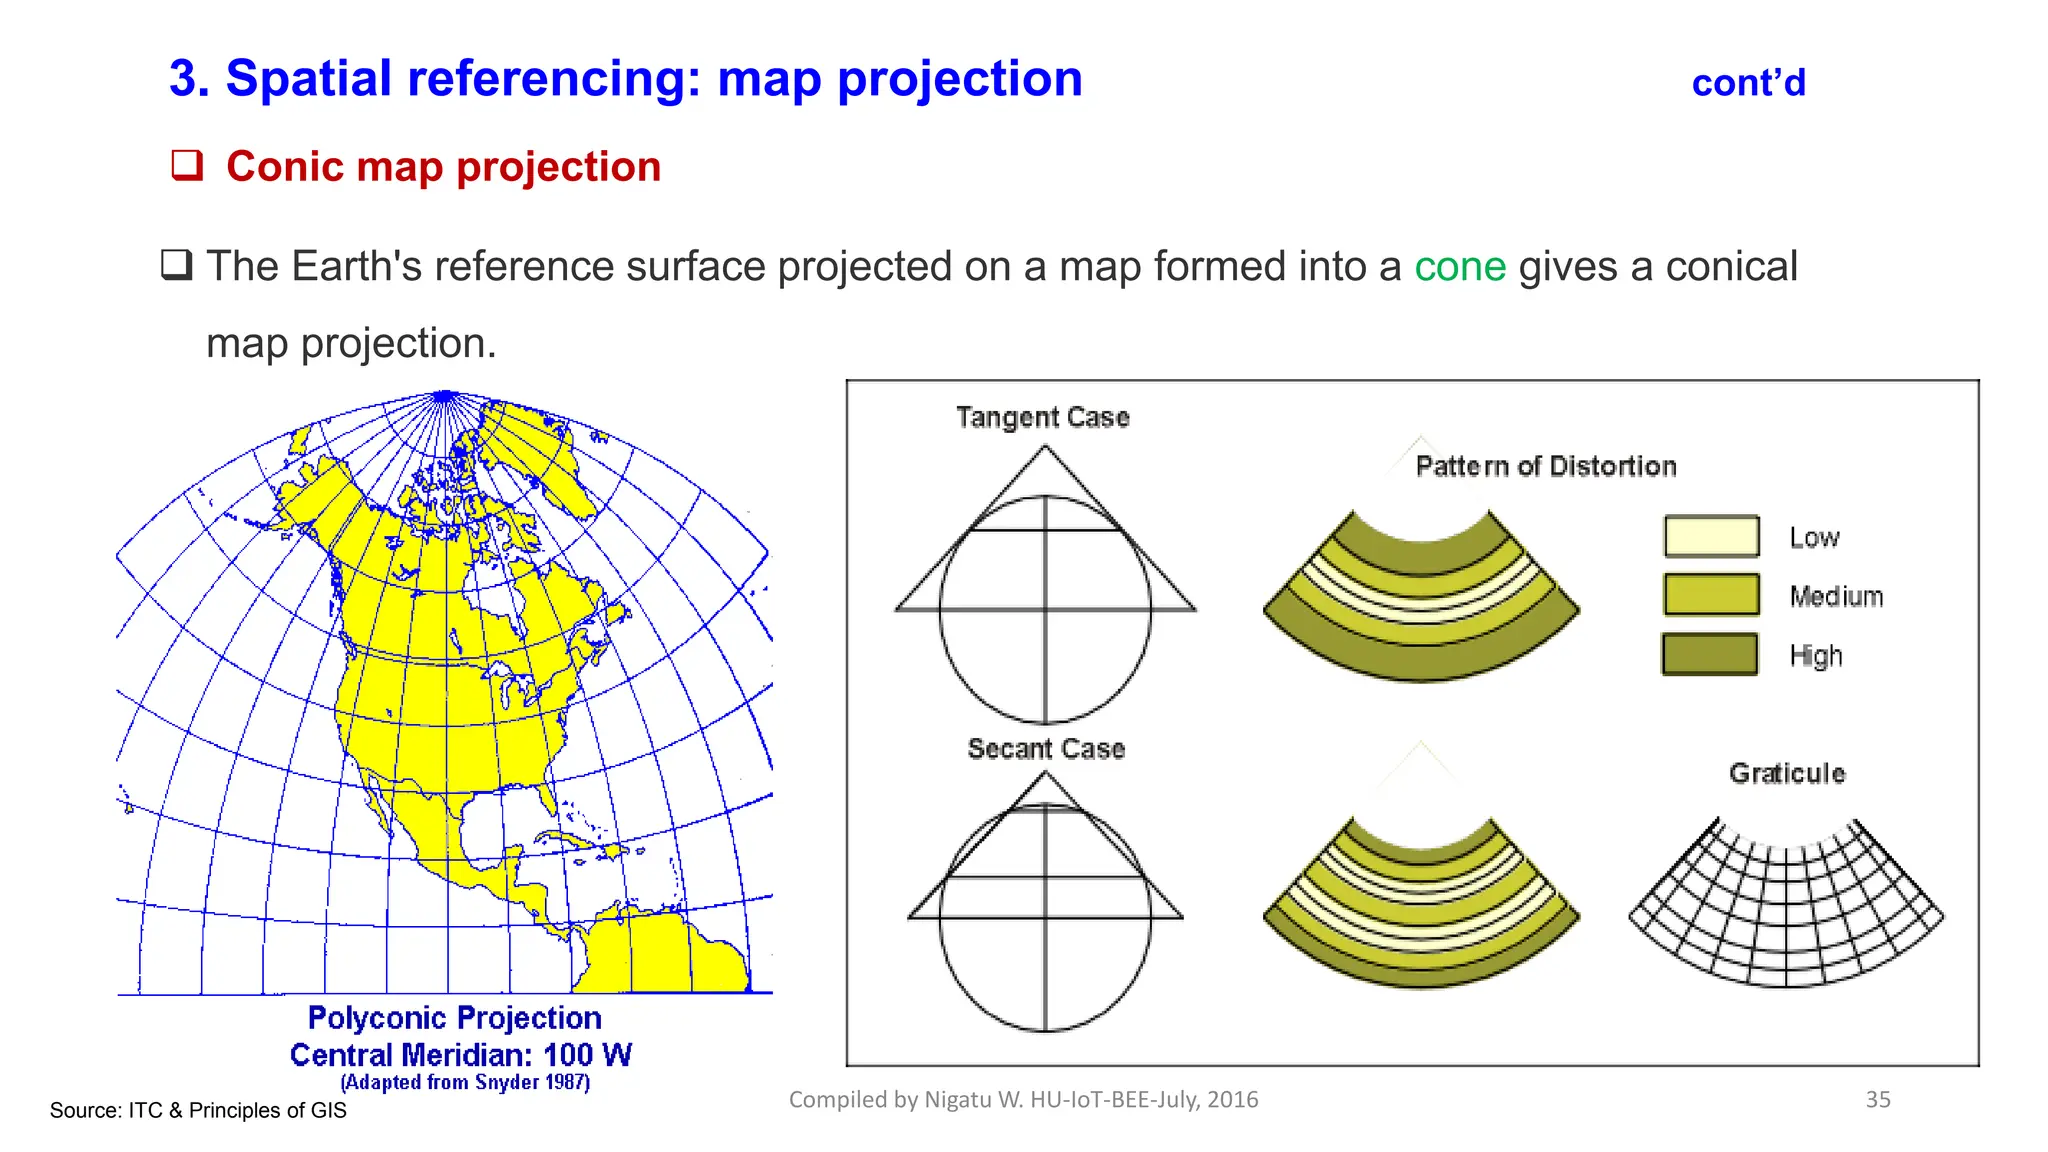
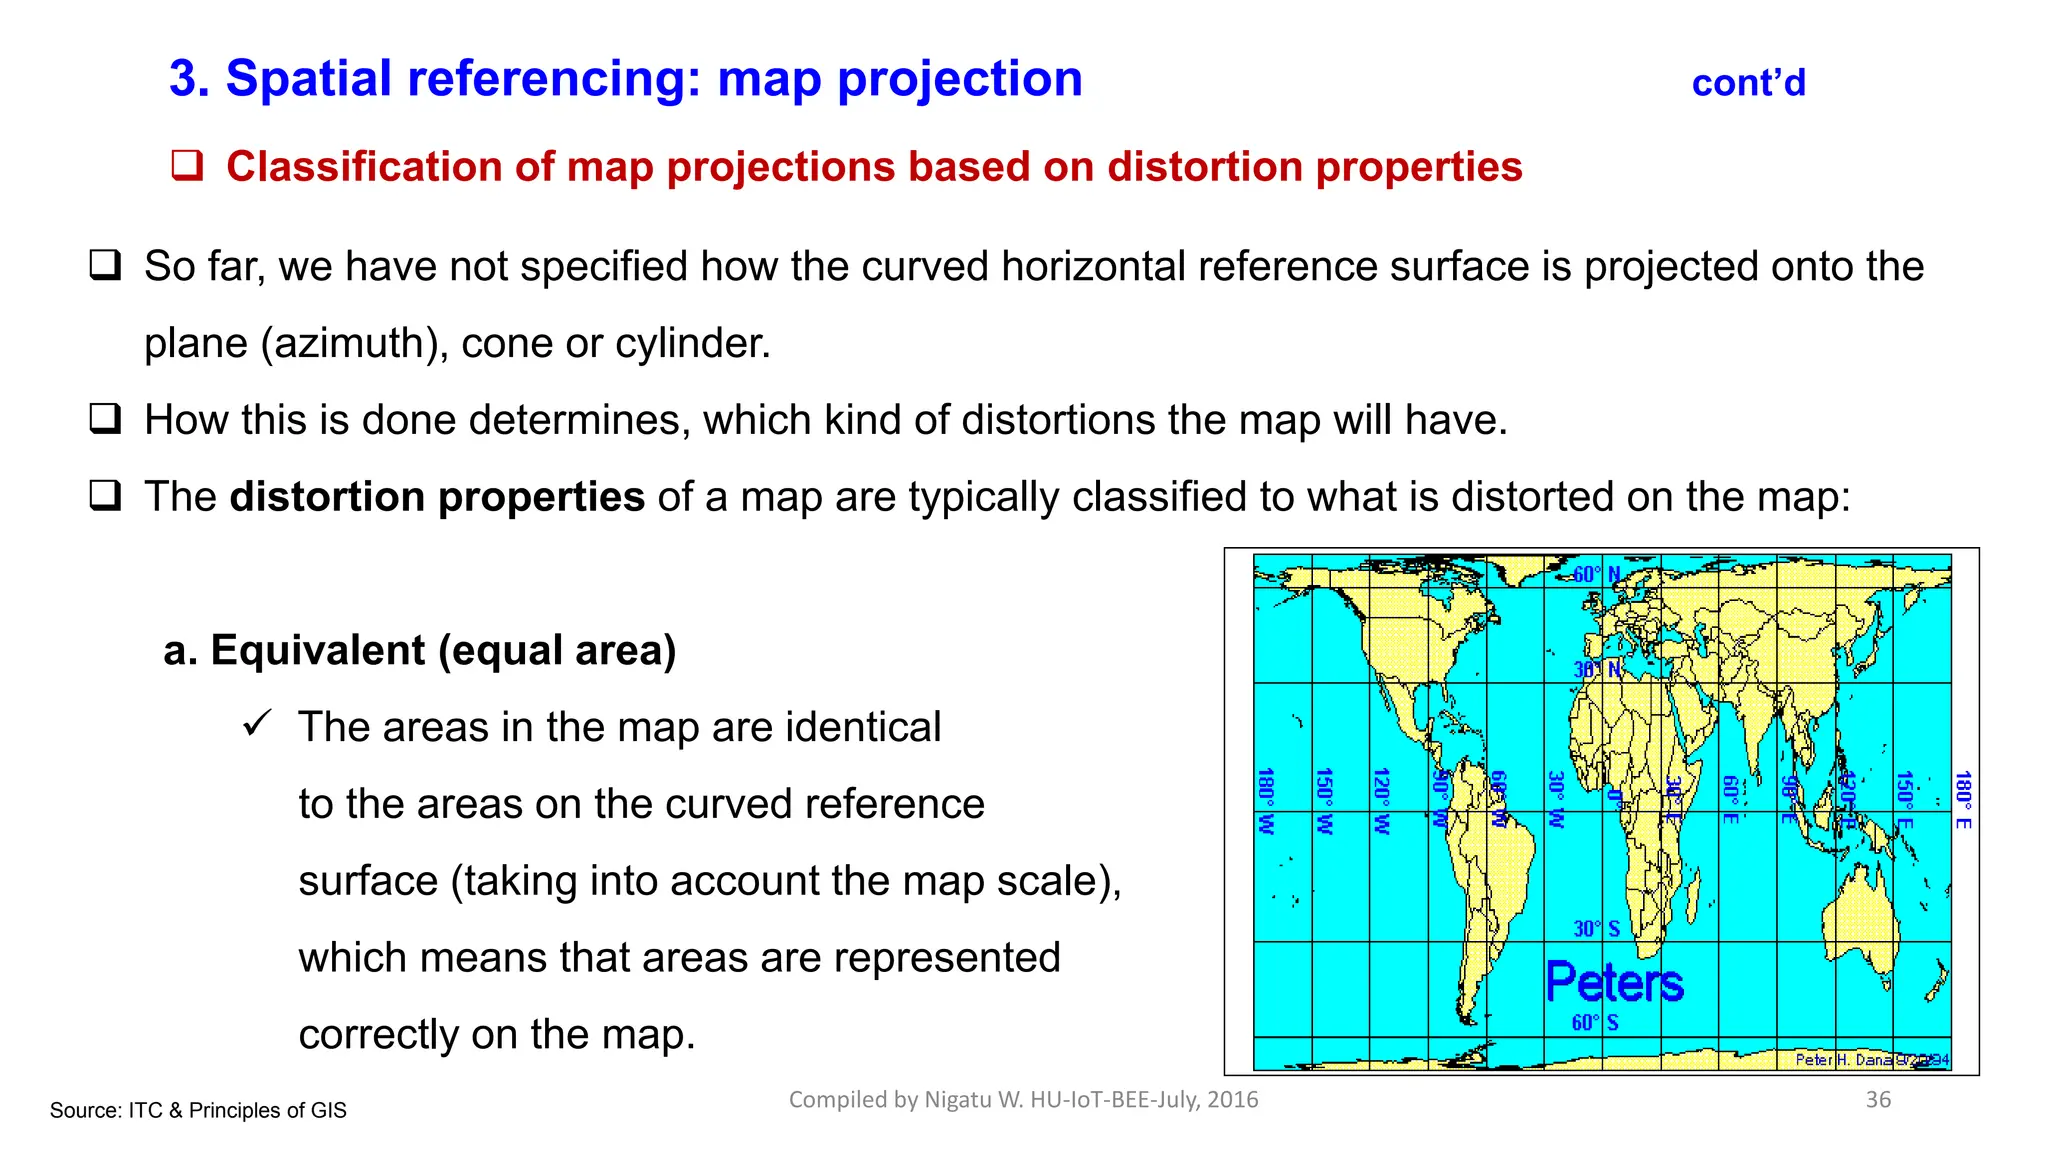
IV. DATA ENTRY & PREPARATION …
Contents
 Spatial data input
 Spatial data preparation
 Map projection
Compiled by Nigatu W. HU-IoT-BEE-July, 2016 1
Compiled by Nigatu W. HU-IoT-BEE-July, 2016
2
Data entry and preparation
 Spatial data can be obtained from various sources.
 It can be collected from scartch using direct spatial data acquisition techniques, or
 Indirectly by making use of existing spatial data collected by others.
 Any data which is captured directly from the environment is known as primary data.
 Any data which is not acquired directly from the environment is known as secondary data.
Source: ITC % Principles of GIS
Compiled by Nigatu W. HU-IoT-BEE-July, 2016 3
1. Spatial data input
Generally, data can be acquired through the following means:
 Direct spatial data acquisition: the most important source of reliable data
 Field surveys: direct observation of the relevant geographic phenomena
 Remote Sensing: data collected from space or air using satellites or airplanes
 Digitising existing maps and images: converts analogue map into digital
 Manual digitising
 Automated digitising  scanning, vectorisation
 Obtaining digital data from elsewhere: means that in different formats, standards & quality.
 data clearing houses
 Data input is very important:
 The quality of final products depends on the quality of the input data
 But data input can account for up to 70% of GIS operation time
Source: ITC & Principles of GIS
4
Compiled by Nigatu W. HU-IoT-BEE-July, 2016
Spatial data input/capturing examples
 Direct spatial data
acquisition examples:
Source: ITC & Principles of GIS
 Indirect spatial data
capture examples:
Existing paper maps Clearing houses & web portals
CD or DVD-ROM
Compiled by Nigatu W. HU-IoT-BEE-July, 2016
Source: ITC & Principles of GIS
Direct acquisition: Remote Sensing
 Remotely sensed imagery is usually not fit for immediate use, as various sources of error &
distortion may have been present, thus it should 1st be freed from these errors & distortions.
 An image refers to a raw data produced by an electronic sensor, which are arrays of digital
numbers related to some property of an object or scene, such as the amount of reflected light.
 When the reflectance values have been translated into some ‘thematic’ variable, we refer to it a
RASTER.
 We refer to image pixels, but
raster cells, although both are
stored in a GIS in the same way.
 Due to cost factor, it’s not always feasible to obtain spatial data by direct way.
Compiled by Nigatu W. HU-IoT-BEE-July, 2016 6
Indirect acquisition: Digitizing
 A traditional method of obtatining spatial data is through digitizing existing paper maps.
 Digitizing: is following lines on a printed map with a pointer, which is linked to a computer.
The movement of the pointer is recorded and converted into coordinates to be stored.
 There are two forms of manual digitizing:
 On-tablet (a) and
 On-screen (b)
 In on-tablet digitizing, the original map is fitted on a special surface (the tablet),
 While in on-screen digitizing, a scanned image of the map (or some other image) is shown
on the computer screen.
 In both of these forms, an operator follows the map’s features (mostly lines) with a mouse
device, thereby tracing the lines, and storing location coordinates relative to a number of
previously defined control points. Source: ITC & Principles of GIS
(a) (b)
Compiled by Nigatu W. HU-IoT-BEE-July, 2016 7
Indirect acquisition: Scanning process
 A map, a slide, a photograph or other paper document is put in digital form by moving an electronic
light detector across the map surface.
 The rsult is an image as a matrix of pixels, each of which holds an intensity of reflected light value.
 Ex., office scanners have a fixed maximum resolution, expressed as the highest number of pixels
they can identify per inch.
 The unit is called dots-per-inch (dpi).
 Some examples of scanners:
Large format sheet fed scanner
Flatbed scanner
Film scanner
Source: ITC & Principles of GIS
Compiled by Nigatu W. HU-IoT-BEE-July, 2016 8
2. Spatial data preparation
 Spataial data preparation aims to make the acquired spatial data fit for use:
 Images may require enhancements and corrections of the calssification schemes of the data
 Vector data may require editing, such as:
 the trimming of overshoots of lines at intersections,
 Deleting duplicate lines, and
 Closing gaps in lines.
 Data may require conversion to either vector format or raster format to match other data sets
which will be used in the data analysis
 The data preparation process also includes, associating attribute data with the spatial
features through either manual input or reading digital attribute files from GIS/DBMS
 The intended use of the acquired spatial data may require only a subset of the original data
set, as only some of the features are relevant for subsequent analysis or map production.
Source: ITC & Principles of GIS
Compiled by Nigatu W. HU-IoT-BEE-July, 2016 9
2. Spatial data preparation cont’d
 Data checks and repairing
 Acquired data must be checked for consistency and completeness.
These requirements include/apply to:
 Geometric quality
 About the location and extent of fields and objects
 Topological quality
 About established relationships used to perform spatial
operations such as overlay, buffering, shrotest-path-routing, etc.
 Semantic quality
 About terminology & meaning of spatial data, attributes
 If required, clean-up and repair
Source: Ivan Ivanova & Principles of GIS
Closing gap
Compiled by Nigatu W. HU-IoT-BEE-July, 2016 10
2. Spatial data preparation cont’d
 Clean-up operations
 Clean-up operations are often
performed in a standard sequence.
 For example, crossing lines
are split before dangling lines
are erased, and nodes are
created at intersections before
polygons are generated, etc.
 Examples of clean-up
operations for vector data are
shown here:
Source: ITC & Principles of GIS
Compiled by Nigatu W. HU-IoT-BEE-July, 2016 11
 In combining different data sources, the following aspects have to be taken into account:
 Differences in accuracy
 Differences in representation
 Differences in content (merging data sets)
 Differences in coordinate systems
2. Spatial data preparation cont’d
 Combining multiple data sources
 Differences in accuracy (=area)
2 data sets combined: Sliver polygons
Source: ITC & Principles of GIS
Digitizing:
Compiled by Nigatu W. HU-IoT-BEE-July, 2016 12
2. Spatial data preparation cont’d
 Combining multiple data sources
 Differences in choice of representation (but about the same area)
 Some GIS applications allow the possibility of representing the same geographic phenomena
in different ways. These are called multirepresentation systems.
 An example is the production of maps at various scales.
 The commonality is that phenomena must sometimes be viewed as points, and at other times
as polygons (due to scale variation)
 Generally, diffrences in representation include:
 the definition of the object of certain scale may differ from the definition of the same
object in another scale, this is about scale and
 Representing the same phenomena in different datasets differently about representation.
Source: ITC & Principles of GIS
Compiled by Nigatu W. HU-IoT-BEE-July, 2016 13
2. Spatial data preparation cont’d
 Combining multiple data sources
 Differences in representation-same area, but different scale.
Example of multi-scale system
Google Map
Enschede as a dot
Enschede as a polygon
Source: ITC & Principles of GIS
Compiled by Nigatu W. HU-IoT-BEE-July, 2016 14
2. Spatial data preparation cont’d
 Combining multiple data sources
 Different representation of the same phenomena in different data sets
Source: Ivana Ivanova & Principles of GIS
Compiled by Nigatu W. HU-IoT-BEE-July, 2016 15
2. Spatial data preparation cont’d
 Combining multiple data sources
 Differences in content (merging data sets or data of adjacent areas)
 When individual data sets have been
prepared, they sometimes have to be
matched into a single ‘seamless’ data set,
while ensuring that the appearance of the
integrated geometry is as homogeneous
as possible.
 Edge matching is the process of joining
two or more map sheets, for example,
after they have separately been digitized.
Source: ITC & Principles of GIS
Compiled by Nigatu W. HU-IoT-BEE-July, 2016 16
3. Spatial referencing: map projection
 In the early days of GIS, users were mainly handling spatially referenced data from a single
country. Such data was usually derived from paper maps published by the country’s mapping
organization.
 Nowadays, GIS users are combining spatial data from a given country with global spatial data
sets, reconciling spatial data from published maps with coordinates established with satelliete
positioning techniques and integrating their spatial data with that from neighbouring countries.
 To perform these kinds of tasks successfully, GIS users need to understand basic spatial
referencing concepts.
Source: ITC & Principles of GIS
Ex. Of Inconsistent referencing
Compiled by Nigatu W. HU-IoT-BEE-July, 2016 17
3. Spatial referencing: map projection cont’d
 The need to combine spatial data from different sources that use different spatial reference
systems involves a broad background of relevant concepts relating to the nature of spatial
reference systems and the translation of data from one spatial reference system into another.
These include:
 The shape of the Earth,
 Horizontal and vertical datum,
 Coordinate system, and
 Projections
Source: ITC & Principles of GIS
Compiled by Nigatu W. HU-IoT-BEE-July, 2016 18
3. Spatial referencing: map projection cont’d
 The shape of the Earth - History
 an oyster
(the Babylonians before 3000 B.C.)
 a circular disk
(approximately 5 – 300 B.C. but this concept survived till the 19th century)
 a very round pear
(Christopher Columbus in the last years of his life)
 a perfect ball  a sphere
(Pythagoras in 6th century B.C.)
 an ellipsoid, flattened at the poles
(Newton around the turn of the 17th and 18th centuries)
Like blind men and
an Elephant
Source: ITC & Principles of GIS
https://cviteacher.wordpress.com/2014/04/25/169/
Compiled by Nigatu W. HU-IoT-BEE-July, 2016 19
3. Spatial referencing: map projection cont’d
 The surface of the Earth is irregular and continuously changing in
shape due to irregularities in mass distribution inside the earth.
 The Earth has a “potato-like” shape
 The ‘true’ shape of the Earth is a Geoid
 It is the earth surface resulting if:
no topography would exist
oceans would cover the whole earth
the resulting water surface is only affected by gravity forces
 The shape of the Earth – ‘True shape’
Source: ITC & Principles of GIS
Compiled by Nigatu W. HU-IoT-BEE-July, 2016 20
 A reference surface for heights is called (vertical datum) and it must be:
 a surface of zero height
 measurable (to be sensed with instruments)
 level (i.e. horizontal)
 The geoid as a reference surface for heights is a choice:
 the geoid is approximately expressed by the surface of all the oceans of the Earth
(Mean Sea Level) i.e.
 every point on the geoid has the same zero height
 Mean sea level (MSL) is used as zero altitude
 The Ocean’s water level is registered at coastal locations over several years to get MSL
3. Spatial referencing: map projection cont’d
 The Geoid and the Vertical Datum
Source: ITC & Principles of GIS
Compiled by Nigatu W. HU-IoT-BEE-July, 2016 21
 Sea level at the measurement location is affected by:
 tidal differences
 ocean currents
 winds
 water temperature
 Salinity
 That is why measurements
are taken at different time
in points and MSL is computed.
Source: ITC & Principles of GIS
3. Spatial referencing: map projection cont’d
 The Geoid and the Vertical Datum
Compiled by Nigatu W. HU-IoT-BEE-July, 2016 22
 Every country (or group of countries) has:
its own local vertical datum (elevation set from the MSL)
its own Mean Sea Level
 Vertical datum for Ethiopia is established around Red Sea
 Red Sea is the MSL
 Lowest point in Ethiopia is about 120m BSL in Dallol Depression in Lake Asale
 Highest point in Ethiopia is 4620m ASL at the peak of Mt. Ras Dashen
 The heights of points on the Earth can be measured using geodetic levelling techniques
3. Spatial referencing: map projection cont’d
 The Vertical Datum-Geodetic leveling
Source: ITC & Principles of GIS
Compiled by Nigatu W. HU-IoT-BEE-July, 2016 23
3. Spatial referencing: map projection cont’d
 A reference surface for locations: The ellipsoid and the horizontal datum
 Geoid surface:
 continuously changes in shape due to changes in mass density inside the earth
 It is bumpy and complex to describe mathematically to use as a reference datum
 Thus, it is NOT suitable as a reference surface for the determination of locations
 Because of the above reasons, a mathematical reference frame is needed in order to:
 Compute positions, distances, directions, etc.
 Therefore, an oblate ELLIPSOID is the most convenient geometric reference for
measuring locations.
Source: ITC & Principles of GIS
Compiled by Nigatu W. HU-IoT-BEE-July, 2016 24
3. Spatial referencing: map projection cont’d
 A reference surface for locations: The ellipsoid and the horizontal datum
 A cross section of an ELLIPSOID used to represent the Earth’s surface is shown
below:
Source: ITC & Principles of GIS
 Ethiopia used the ellipsoid of Clarke 1880 with a=6378249m and b=6356515m
Compiled by Nigatu W. HU-IoT-BEE-July, 2016 25
 Horizontal datum
3. Spatial referencing: map projection cont’d
 A reference surface for locations: The ellipsoid and the horizontal datum
 Countries establish a horizontal datum
 an ellipsoid with a fixed position, so that the ellipsoid best fits the surface of the area of
interest (the country)
 topographic maps are produced relative to this horizontal (geodetic) datum
 Horizontal datum is defined by the size, shape and position of the selected ellipsoid:
 dimensions (a, b) of the ellipsoid
 the reference coordinates (φ, λ and h) of the datum’s fundamental point
 Angle (azimuth) from this point to fundamental point of another datum
 N.B. Hundreds of local horizontal datums do exist
Source: ITC & Principles of GIS
Compiled by Nigatu W. HU-IoT-BEE-July, 2016 26
3. Spatial referencing: map projection cont’d
 Coordinate systems
 Different kinds of coordinate systems are used to position data in space. These include:
 Spatial and planar coordinate systems:
 Spatial coordinate systems are used to locate data either on the Earth’s surface in a
3D space, or on the Earth’s reference surface (ellipsoid or sphere) in a 2D space.
These are:
o Geographic coordinate systems in 2D & 3D space, and
o Geocentric coordinate system, also known as 3D Cartesian coordinate system
 Planar coordinate systems are used to locate data on the flat surface of the map in a
2D space. These are:
o 2D cartesian coordinate system, and
o 2D polar coordinate system. Source: ITC & Principles of GIS
Compiled by Nigatu W. HU-IoT-BEE-July, 2016 27
3. Spatial referencing: map projection cont’d
 Coordinate systems
 Examples of coordinate systems
Spatial Cartesian or
geocentric
coordinates (x, y, z)
Spatial geographic
coordinates (φ, λ, h)
Cartesian/rectangular or
orthogonal coordinates (x, y)
Polar coordinates
(α, d)
Source: ITC & Principles of GIS
CIO=Conventional International Origin
. Geographic lat. & Long. is the most widely used global
coordinate system
. Lines of equal lats=Parallels
. Lines of equal longs=Meridians
Compiled by Nigatu W. HU-IoT-BEE-July, 2016 28
3. Spatial referencing: map projection cont’d
 Map projections
 Maps are one of the world’s oldest types of document.
 For quite some time, it was thought that our planet was flat and during those days, a map
was a miniature representation of part of the world.
 But now, we know that the Earth’s surface is curved in a specific way and maps are infact a
flattened representation of some part of the planet.
 The field of map projections deals with the ways of translating the curved surface of the
Earth into a fat map.
 Definition: A map projection is a mathematically described technique of how to represent
the curved Earth’s surface on a flat map.
Source: ITC & Principles of GIS
Compiled by Nigatu W. HU-IoT-BEE-July, 2016 29
3. Spatial referencing: map projection cont’d
 Map projections
 To represent parts of the surface of the Earth on a flat map
or on a computer screen, the curved horizontal reference
surface must be mapped onto the 2D mapping plane.
 The reference surface for large-scale mapping is
usually an oblate ellipsoid, (ex. 1: 50, 000) and
 The reference surface for small-scale mapping is a
sphere (ex. 1: 5, 000, 000).
 Mapping onto a 2D mapping plane means transforming
each point on the reference surface with geographic
coordinates (, ) to a set of Cartesian coordinates (𝒙, 𝒚)
representing position on the map plane.
Reference surface (ellipsoid)
2D mapping plane
(𝒙, 𝒚)=𝒇(, )
Source: ITC & Principles of GIS
Compiled by Nigatu W. HU-IoT-BEE-July, 2016 30
3. Spatial referencing: map projection cont’d
 Classification of map projections (based on class, pt. of secancy, aspect, & distortion property)
 Hundreds of map projections have been developed each with its own specific qualities.
 By definition, any map projection is associated with scale distortions.
 There is simply no way to flatten out a piece of ellipsoid or spherical surface without stretching
some parts of the surface than others….Spill orange & check!
 The amount and which kind of distortions a map have depends on the type of map projections that
has been used.
 Based on projection surface, map projections are classified into three classes:
 Azimuthal
 Cylindrical
 Conical
Source: ITC & Principles of GIS
Compiled by Nigatu W. HU-IoT-BEE-July, 2016 31
3. Spatial referencing: map projection cont’d
 Classification of map projections
 Based on projection plane (point of secancy), map projections are divided into:
Tangent projection
(They touch the horizontal reference
surface in one point (plane) or along
a closed line (cone & cylinder) only).
Secant projection
(the reference surface is intersected
along one closed line (plane) or two
closed lines (cone & cylinder)).
Source: ITC & Principles of GIS
Compiled by Nigatu W. HU-IoT-BEE-July, 2016 32
 Classification of map projections based
on aspect:
 Normal
 Transverse
 Oblique
3. Spatial referencing: map projection cont’d
 Classification of map projections
α
α
 In the 3 classes & secant projections given
above, the geometric depiction of map
projections, the symmetry axes of the plane,
cone and cylinder coincide with the rotation axis
of the ellipsoid or sphere, i. e. a line through N
and S pole. In such case, the projection is said to
be a NORMAL PROJECTION.
 The other cases are TRANSVERSE (symmetry
axis in the equator) and OBLIQUE (symmetry
axis is somewhere b/n the rotation axis and
equator of the ellipsoid or sphere).
Rotation axis of
the ellipsoid
Source: ITC & Principles of GIS
Compiled by Nigatu W. HU-IoT-BEE-July, 2016 33
3. Spatial referencing: map projection cont’d
 Azimuthal map projection
 In azimuthal map projection: When the Earth’s reference surface is projected dircectly
onto the mapping plane, it produces an azimuthal (or zenithal or planar) map projection.
Distortion:
from center
to outer part
Distortion: from
secant plane upward
& downward
Source: ITC & Principles of GIS
Compiled by Nigatu W. HU-IoT-BEE-July, 2016 34
3. Spatial referencing: map projection cont’d
 Cylyndrical map projection
 The Earth's reference surface projected on a map wrapped around the globe as a
cylinder produces a cylindrical map projection.
Square
Source: ITC & Principles of GIS
ISPIT (use different bars)
Compiled by Nigatu W. HU-IoT-BEE-July, 2016 35
 The Earth's reference surface projected on a map formed into a cone gives a conical
map projection.
3. Spatial referencing: map projection cont’d
 Conic map projection
Source: ITC & Principles of GIS
Compiled by Nigatu W. HU-IoT-BEE-July, 2016 36
3. Spatial referencing: map projection cont’d
 Classification of map projections based on distortion properties
 So far, we have not specified how the curved horizontal reference surface is projected onto the
plane (azimuth), cone or cylinder.
 How this is done determines, which kind of distortions the map will have.
 The distortion properties of a map are typically classified to what is distorted on the map:
a. Equivalent (equal area)
 The areas in the map are identical
to the areas on the curved reference
surface (taking into account the map scale),
which means that areas are represented
correctly on the map.
Source: ITC & Principles of GIS
Compiled by Nigatu W. HU-IoT-BEE-July, 2016 37
3. Spatial referencing: map projection cont’d
 Classification of map projections based on distortion properties
b. Equidistant
 The length of particular lines in the map are the same as the length of the original lines
on the curved reference surface (taking into account the map scale)
Plate Carree Projection Source: ITC & Principles of GIS
Compiled by Nigatu W. HU-IoT-BEE-July, 2016 38
3. Spatial referencing: map projection cont’d
 Classification of map projections based on distortion properties
c. Conformal
 In conformal map projection, the angles between lines in the map are identical to the
angles between the original lines on the curved reference surface. This means that
angles and shapes are shown correctly on the map.
Source: ITC & Principles of GIS
Compiled by Nigatu W. HU-IoT-BEE-July, 2016 39
3. Spatial referencing: map projection cont’d
 Universal Transverse Mercator (UTM)
 The Universal Transverse Mercator (UTM) uses a transverse cylinder, secant to the
horizontal reference surface.
 UTM is an important projection used world-wide (42% of the area in the world uses UTM).
 The UTM divides the world into 60 narrow longitudinal zones of 6 degrees, numbered from
1 to 60 (see the sub-division on the next page).
 Each zone mapped by the Transverse Mercator projection.
 The narrow zones of 6 degrees make the distortions small enough for large scale
topographical mapping.
Source: ITC & Principles of GIS
Compiled by Nigatu W. HU-IoT-BEE-July, 2016 40
3. Spatial referencing: map projection cont’d
 Systems of subdivision & nomenclature of map sheets
 Numbering and lettering map sheets
 This is for Northern hemisphere
ISPIT-where is ethiopia?....Sketch it.
Compiled by Nigatu W. HU-IoT-BEE-July, 2016 41
3. Spatial referencing: map projection cont’d
 Universal Transverse Mercator (UTM)
 Because of such differences in:
 Vertical dataum
 Horizontal datum, and
 Projections, it is necessay
to check data before
entering into database in
GIS
Hawassa, Ethiopia
37 N
Source: ITC & Principles of GIS
No I and O
Compiled by Nigatu W. HU-IoT-BEE-July, 2016 42

4.DATA ENTRY & PREPARATION ....modified.pdf

  • 1.
    IV. DATA ENTRY& PREPARATION … Contents  Spatial data input  Spatial data preparation  Map projection Compiled by Nigatu W. HU-IoT-BEE-July, 2016 1
  • 2.
    Compiled by NigatuW. HU-IoT-BEE-July, 2016 2 Data entry and preparation  Spatial data can be obtained from various sources.  It can be collected from scartch using direct spatial data acquisition techniques, or  Indirectly by making use of existing spatial data collected by others.  Any data which is captured directly from the environment is known as primary data.  Any data which is not acquired directly from the environment is known as secondary data. Source: ITC % Principles of GIS
  • 3.
    Compiled by NigatuW. HU-IoT-BEE-July, 2016 3 1. Spatial data input Generally, data can be acquired through the following means:  Direct spatial data acquisition: the most important source of reliable data  Field surveys: direct observation of the relevant geographic phenomena  Remote Sensing: data collected from space or air using satellites or airplanes  Digitising existing maps and images: converts analogue map into digital  Manual digitising  Automated digitising  scanning, vectorisation  Obtaining digital data from elsewhere: means that in different formats, standards & quality.  data clearing houses  Data input is very important:  The quality of final products depends on the quality of the input data  But data input can account for up to 70% of GIS operation time Source: ITC & Principles of GIS
  • 4.
    4 Compiled by NigatuW. HU-IoT-BEE-July, 2016 Spatial data input/capturing examples  Direct spatial data acquisition examples: Source: ITC & Principles of GIS  Indirect spatial data capture examples: Existing paper maps Clearing houses & web portals CD or DVD-ROM
  • 5.
    Compiled by NigatuW. HU-IoT-BEE-July, 2016 Source: ITC & Principles of GIS Direct acquisition: Remote Sensing  Remotely sensed imagery is usually not fit for immediate use, as various sources of error & distortion may have been present, thus it should 1st be freed from these errors & distortions.  An image refers to a raw data produced by an electronic sensor, which are arrays of digital numbers related to some property of an object or scene, such as the amount of reflected light.  When the reflectance values have been translated into some ‘thematic’ variable, we refer to it a RASTER.  We refer to image pixels, but raster cells, although both are stored in a GIS in the same way.  Due to cost factor, it’s not always feasible to obtain spatial data by direct way.
  • 6.
    Compiled by NigatuW. HU-IoT-BEE-July, 2016 6 Indirect acquisition: Digitizing  A traditional method of obtatining spatial data is through digitizing existing paper maps.  Digitizing: is following lines on a printed map with a pointer, which is linked to a computer. The movement of the pointer is recorded and converted into coordinates to be stored.  There are two forms of manual digitizing:  On-tablet (a) and  On-screen (b)  In on-tablet digitizing, the original map is fitted on a special surface (the tablet),  While in on-screen digitizing, a scanned image of the map (or some other image) is shown on the computer screen.  In both of these forms, an operator follows the map’s features (mostly lines) with a mouse device, thereby tracing the lines, and storing location coordinates relative to a number of previously defined control points. Source: ITC & Principles of GIS (a) (b)
  • 7.
    Compiled by NigatuW. HU-IoT-BEE-July, 2016 7 Indirect acquisition: Scanning process  A map, a slide, a photograph or other paper document is put in digital form by moving an electronic light detector across the map surface.  The rsult is an image as a matrix of pixels, each of which holds an intensity of reflected light value.  Ex., office scanners have a fixed maximum resolution, expressed as the highest number of pixels they can identify per inch.  The unit is called dots-per-inch (dpi).  Some examples of scanners: Large format sheet fed scanner Flatbed scanner Film scanner Source: ITC & Principles of GIS
  • 8.
    Compiled by NigatuW. HU-IoT-BEE-July, 2016 8 2. Spatial data preparation  Spataial data preparation aims to make the acquired spatial data fit for use:  Images may require enhancements and corrections of the calssification schemes of the data  Vector data may require editing, such as:  the trimming of overshoots of lines at intersections,  Deleting duplicate lines, and  Closing gaps in lines.  Data may require conversion to either vector format or raster format to match other data sets which will be used in the data analysis  The data preparation process also includes, associating attribute data with the spatial features through either manual input or reading digital attribute files from GIS/DBMS  The intended use of the acquired spatial data may require only a subset of the original data set, as only some of the features are relevant for subsequent analysis or map production. Source: ITC & Principles of GIS
  • 9.
    Compiled by NigatuW. HU-IoT-BEE-July, 2016 9 2. Spatial data preparation cont’d  Data checks and repairing  Acquired data must be checked for consistency and completeness. These requirements include/apply to:  Geometric quality  About the location and extent of fields and objects  Topological quality  About established relationships used to perform spatial operations such as overlay, buffering, shrotest-path-routing, etc.  Semantic quality  About terminology & meaning of spatial data, attributes  If required, clean-up and repair Source: Ivan Ivanova & Principles of GIS Closing gap
  • 10.
    Compiled by NigatuW. HU-IoT-BEE-July, 2016 10 2. Spatial data preparation cont’d  Clean-up operations  Clean-up operations are often performed in a standard sequence.  For example, crossing lines are split before dangling lines are erased, and nodes are created at intersections before polygons are generated, etc.  Examples of clean-up operations for vector data are shown here: Source: ITC & Principles of GIS
  • 11.
    Compiled by NigatuW. HU-IoT-BEE-July, 2016 11  In combining different data sources, the following aspects have to be taken into account:  Differences in accuracy  Differences in representation  Differences in content (merging data sets)  Differences in coordinate systems 2. Spatial data preparation cont’d  Combining multiple data sources  Differences in accuracy (=area) 2 data sets combined: Sliver polygons Source: ITC & Principles of GIS Digitizing:
  • 12.
    Compiled by NigatuW. HU-IoT-BEE-July, 2016 12 2. Spatial data preparation cont’d  Combining multiple data sources  Differences in choice of representation (but about the same area)  Some GIS applications allow the possibility of representing the same geographic phenomena in different ways. These are called multirepresentation systems.  An example is the production of maps at various scales.  The commonality is that phenomena must sometimes be viewed as points, and at other times as polygons (due to scale variation)  Generally, diffrences in representation include:  the definition of the object of certain scale may differ from the definition of the same object in another scale, this is about scale and  Representing the same phenomena in different datasets differently about representation. Source: ITC & Principles of GIS
  • 13.
    Compiled by NigatuW. HU-IoT-BEE-July, 2016 13 2. Spatial data preparation cont’d  Combining multiple data sources  Differences in representation-same area, but different scale. Example of multi-scale system Google Map Enschede as a dot Enschede as a polygon Source: ITC & Principles of GIS
  • 14.
    Compiled by NigatuW. HU-IoT-BEE-July, 2016 14 2. Spatial data preparation cont’d  Combining multiple data sources  Different representation of the same phenomena in different data sets Source: Ivana Ivanova & Principles of GIS
  • 15.
    Compiled by NigatuW. HU-IoT-BEE-July, 2016 15 2. Spatial data preparation cont’d  Combining multiple data sources  Differences in content (merging data sets or data of adjacent areas)  When individual data sets have been prepared, they sometimes have to be matched into a single ‘seamless’ data set, while ensuring that the appearance of the integrated geometry is as homogeneous as possible.  Edge matching is the process of joining two or more map sheets, for example, after they have separately been digitized. Source: ITC & Principles of GIS
  • 16.
    Compiled by NigatuW. HU-IoT-BEE-July, 2016 16 3. Spatial referencing: map projection  In the early days of GIS, users were mainly handling spatially referenced data from a single country. Such data was usually derived from paper maps published by the country’s mapping organization.  Nowadays, GIS users are combining spatial data from a given country with global spatial data sets, reconciling spatial data from published maps with coordinates established with satelliete positioning techniques and integrating their spatial data with that from neighbouring countries.  To perform these kinds of tasks successfully, GIS users need to understand basic spatial referencing concepts. Source: ITC & Principles of GIS Ex. Of Inconsistent referencing
  • 17.
    Compiled by NigatuW. HU-IoT-BEE-July, 2016 17 3. Spatial referencing: map projection cont’d  The need to combine spatial data from different sources that use different spatial reference systems involves a broad background of relevant concepts relating to the nature of spatial reference systems and the translation of data from one spatial reference system into another. These include:  The shape of the Earth,  Horizontal and vertical datum,  Coordinate system, and  Projections Source: ITC & Principles of GIS
  • 18.
    Compiled by NigatuW. HU-IoT-BEE-July, 2016 18 3. Spatial referencing: map projection cont’d  The shape of the Earth - History  an oyster (the Babylonians before 3000 B.C.)  a circular disk (approximately 5 – 300 B.C. but this concept survived till the 19th century)  a very round pear (Christopher Columbus in the last years of his life)  a perfect ball  a sphere (Pythagoras in 6th century B.C.)  an ellipsoid, flattened at the poles (Newton around the turn of the 17th and 18th centuries) Like blind men and an Elephant Source: ITC & Principles of GIS https://cviteacher.wordpress.com/2014/04/25/169/
  • 19.
    Compiled by NigatuW. HU-IoT-BEE-July, 2016 19 3. Spatial referencing: map projection cont’d  The surface of the Earth is irregular and continuously changing in shape due to irregularities in mass distribution inside the earth.  The Earth has a “potato-like” shape  The ‘true’ shape of the Earth is a Geoid  It is the earth surface resulting if: no topography would exist oceans would cover the whole earth the resulting water surface is only affected by gravity forces  The shape of the Earth – ‘True shape’ Source: ITC & Principles of GIS
  • 20.
    Compiled by NigatuW. HU-IoT-BEE-July, 2016 20  A reference surface for heights is called (vertical datum) and it must be:  a surface of zero height  measurable (to be sensed with instruments)  level (i.e. horizontal)  The geoid as a reference surface for heights is a choice:  the geoid is approximately expressed by the surface of all the oceans of the Earth (Mean Sea Level) i.e.  every point on the geoid has the same zero height  Mean sea level (MSL) is used as zero altitude  The Ocean’s water level is registered at coastal locations over several years to get MSL 3. Spatial referencing: map projection cont’d  The Geoid and the Vertical Datum Source: ITC & Principles of GIS
  • 21.
    Compiled by NigatuW. HU-IoT-BEE-July, 2016 21  Sea level at the measurement location is affected by:  tidal differences  ocean currents  winds  water temperature  Salinity  That is why measurements are taken at different time in points and MSL is computed. Source: ITC & Principles of GIS 3. Spatial referencing: map projection cont’d  The Geoid and the Vertical Datum
  • 22.
    Compiled by NigatuW. HU-IoT-BEE-July, 2016 22  Every country (or group of countries) has: its own local vertical datum (elevation set from the MSL) its own Mean Sea Level  Vertical datum for Ethiopia is established around Red Sea  Red Sea is the MSL  Lowest point in Ethiopia is about 120m BSL in Dallol Depression in Lake Asale  Highest point in Ethiopia is 4620m ASL at the peak of Mt. Ras Dashen  The heights of points on the Earth can be measured using geodetic levelling techniques 3. Spatial referencing: map projection cont’d  The Vertical Datum-Geodetic leveling Source: ITC & Principles of GIS
  • 23.
    Compiled by NigatuW. HU-IoT-BEE-July, 2016 23 3. Spatial referencing: map projection cont’d  A reference surface for locations: The ellipsoid and the horizontal datum  Geoid surface:  continuously changes in shape due to changes in mass density inside the earth  It is bumpy and complex to describe mathematically to use as a reference datum  Thus, it is NOT suitable as a reference surface for the determination of locations  Because of the above reasons, a mathematical reference frame is needed in order to:  Compute positions, distances, directions, etc.  Therefore, an oblate ELLIPSOID is the most convenient geometric reference for measuring locations. Source: ITC & Principles of GIS
  • 24.
    Compiled by NigatuW. HU-IoT-BEE-July, 2016 24 3. Spatial referencing: map projection cont’d  A reference surface for locations: The ellipsoid and the horizontal datum  A cross section of an ELLIPSOID used to represent the Earth’s surface is shown below: Source: ITC & Principles of GIS  Ethiopia used the ellipsoid of Clarke 1880 with a=6378249m and b=6356515m
  • 25.
    Compiled by NigatuW. HU-IoT-BEE-July, 2016 25  Horizontal datum 3. Spatial referencing: map projection cont’d  A reference surface for locations: The ellipsoid and the horizontal datum  Countries establish a horizontal datum  an ellipsoid with a fixed position, so that the ellipsoid best fits the surface of the area of interest (the country)  topographic maps are produced relative to this horizontal (geodetic) datum  Horizontal datum is defined by the size, shape and position of the selected ellipsoid:  dimensions (a, b) of the ellipsoid  the reference coordinates (φ, λ and h) of the datum’s fundamental point  Angle (azimuth) from this point to fundamental point of another datum  N.B. Hundreds of local horizontal datums do exist Source: ITC & Principles of GIS
  • 26.
    Compiled by NigatuW. HU-IoT-BEE-July, 2016 26 3. Spatial referencing: map projection cont’d  Coordinate systems  Different kinds of coordinate systems are used to position data in space. These include:  Spatial and planar coordinate systems:  Spatial coordinate systems are used to locate data either on the Earth’s surface in a 3D space, or on the Earth’s reference surface (ellipsoid or sphere) in a 2D space. These are: o Geographic coordinate systems in 2D & 3D space, and o Geocentric coordinate system, also known as 3D Cartesian coordinate system  Planar coordinate systems are used to locate data on the flat surface of the map in a 2D space. These are: o 2D cartesian coordinate system, and o 2D polar coordinate system. Source: ITC & Principles of GIS
  • 27.
    Compiled by NigatuW. HU-IoT-BEE-July, 2016 27 3. Spatial referencing: map projection cont’d  Coordinate systems  Examples of coordinate systems Spatial Cartesian or geocentric coordinates (x, y, z) Spatial geographic coordinates (φ, λ, h) Cartesian/rectangular or orthogonal coordinates (x, y) Polar coordinates (α, d) Source: ITC & Principles of GIS CIO=Conventional International Origin . Geographic lat. & Long. is the most widely used global coordinate system . Lines of equal lats=Parallels . Lines of equal longs=Meridians
  • 28.
    Compiled by NigatuW. HU-IoT-BEE-July, 2016 28 3. Spatial referencing: map projection cont’d  Map projections  Maps are one of the world’s oldest types of document.  For quite some time, it was thought that our planet was flat and during those days, a map was a miniature representation of part of the world.  But now, we know that the Earth’s surface is curved in a specific way and maps are infact a flattened representation of some part of the planet.  The field of map projections deals with the ways of translating the curved surface of the Earth into a fat map.  Definition: A map projection is a mathematically described technique of how to represent the curved Earth’s surface on a flat map. Source: ITC & Principles of GIS
  • 29.
    Compiled by NigatuW. HU-IoT-BEE-July, 2016 29 3. Spatial referencing: map projection cont’d  Map projections  To represent parts of the surface of the Earth on a flat map or on a computer screen, the curved horizontal reference surface must be mapped onto the 2D mapping plane.  The reference surface for large-scale mapping is usually an oblate ellipsoid, (ex. 1: 50, 000) and  The reference surface for small-scale mapping is a sphere (ex. 1: 5, 000, 000).  Mapping onto a 2D mapping plane means transforming each point on the reference surface with geographic coordinates (, ) to a set of Cartesian coordinates (𝒙, 𝒚) representing position on the map plane. Reference surface (ellipsoid) 2D mapping plane (𝒙, 𝒚)=𝒇(, ) Source: ITC & Principles of GIS
  • 30.
    Compiled by NigatuW. HU-IoT-BEE-July, 2016 30 3. Spatial referencing: map projection cont’d  Classification of map projections (based on class, pt. of secancy, aspect, & distortion property)  Hundreds of map projections have been developed each with its own specific qualities.  By definition, any map projection is associated with scale distortions.  There is simply no way to flatten out a piece of ellipsoid or spherical surface without stretching some parts of the surface than others….Spill orange & check!  The amount and which kind of distortions a map have depends on the type of map projections that has been used.  Based on projection surface, map projections are classified into three classes:  Azimuthal  Cylindrical  Conical Source: ITC & Principles of GIS
  • 31.
    Compiled by NigatuW. HU-IoT-BEE-July, 2016 31 3. Spatial referencing: map projection cont’d  Classification of map projections  Based on projection plane (point of secancy), map projections are divided into: Tangent projection (They touch the horizontal reference surface in one point (plane) or along a closed line (cone & cylinder) only). Secant projection (the reference surface is intersected along one closed line (plane) or two closed lines (cone & cylinder)). Source: ITC & Principles of GIS
  • 32.
    Compiled by NigatuW. HU-IoT-BEE-July, 2016 32  Classification of map projections based on aspect:  Normal  Transverse  Oblique 3. Spatial referencing: map projection cont’d  Classification of map projections α α  In the 3 classes & secant projections given above, the geometric depiction of map projections, the symmetry axes of the plane, cone and cylinder coincide with the rotation axis of the ellipsoid or sphere, i. e. a line through N and S pole. In such case, the projection is said to be a NORMAL PROJECTION.  The other cases are TRANSVERSE (symmetry axis in the equator) and OBLIQUE (symmetry axis is somewhere b/n the rotation axis and equator of the ellipsoid or sphere). Rotation axis of the ellipsoid Source: ITC & Principles of GIS
  • 33.
    Compiled by NigatuW. HU-IoT-BEE-July, 2016 33 3. Spatial referencing: map projection cont’d  Azimuthal map projection  In azimuthal map projection: When the Earth’s reference surface is projected dircectly onto the mapping plane, it produces an azimuthal (or zenithal or planar) map projection. Distortion: from center to outer part Distortion: from secant plane upward & downward Source: ITC & Principles of GIS
  • 34.
    Compiled by NigatuW. HU-IoT-BEE-July, 2016 34 3. Spatial referencing: map projection cont’d  Cylyndrical map projection  The Earth's reference surface projected on a map wrapped around the globe as a cylinder produces a cylindrical map projection. Square Source: ITC & Principles of GIS ISPIT (use different bars)
  • 35.
    Compiled by NigatuW. HU-IoT-BEE-July, 2016 35  The Earth's reference surface projected on a map formed into a cone gives a conical map projection. 3. Spatial referencing: map projection cont’d  Conic map projection Source: ITC & Principles of GIS
  • 36.
    Compiled by NigatuW. HU-IoT-BEE-July, 2016 36 3. Spatial referencing: map projection cont’d  Classification of map projections based on distortion properties  So far, we have not specified how the curved horizontal reference surface is projected onto the plane (azimuth), cone or cylinder.  How this is done determines, which kind of distortions the map will have.  The distortion properties of a map are typically classified to what is distorted on the map: a. Equivalent (equal area)  The areas in the map are identical to the areas on the curved reference surface (taking into account the map scale), which means that areas are represented correctly on the map. Source: ITC & Principles of GIS
  • 37.
    Compiled by NigatuW. HU-IoT-BEE-July, 2016 37 3. Spatial referencing: map projection cont’d  Classification of map projections based on distortion properties b. Equidistant  The length of particular lines in the map are the same as the length of the original lines on the curved reference surface (taking into account the map scale) Plate Carree Projection Source: ITC & Principles of GIS
  • 38.
    Compiled by NigatuW. HU-IoT-BEE-July, 2016 38 3. Spatial referencing: map projection cont’d  Classification of map projections based on distortion properties c. Conformal  In conformal map projection, the angles between lines in the map are identical to the angles between the original lines on the curved reference surface. This means that angles and shapes are shown correctly on the map. Source: ITC & Principles of GIS
  • 39.
    Compiled by NigatuW. HU-IoT-BEE-July, 2016 39 3. Spatial referencing: map projection cont’d  Universal Transverse Mercator (UTM)  The Universal Transverse Mercator (UTM) uses a transverse cylinder, secant to the horizontal reference surface.  UTM is an important projection used world-wide (42% of the area in the world uses UTM).  The UTM divides the world into 60 narrow longitudinal zones of 6 degrees, numbered from 1 to 60 (see the sub-division on the next page).  Each zone mapped by the Transverse Mercator projection.  The narrow zones of 6 degrees make the distortions small enough for large scale topographical mapping. Source: ITC & Principles of GIS
  • 40.
    Compiled by NigatuW. HU-IoT-BEE-July, 2016 40 3. Spatial referencing: map projection cont’d  Systems of subdivision & nomenclature of map sheets  Numbering and lettering map sheets  This is for Northern hemisphere ISPIT-where is ethiopia?....Sketch it.
  • 41.
    Compiled by NigatuW. HU-IoT-BEE-July, 2016 41 3. Spatial referencing: map projection cont’d  Universal Transverse Mercator (UTM)  Because of such differences in:  Vertical dataum  Horizontal datum, and  Projections, it is necessay to check data before entering into database in GIS Hawassa, Ethiopia 37 N Source: ITC & Principles of GIS No I and O
  • 42.
    Compiled by NigatuW. HU-IoT-BEE-July, 2016 42