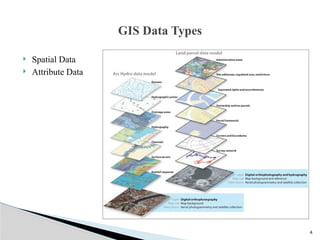
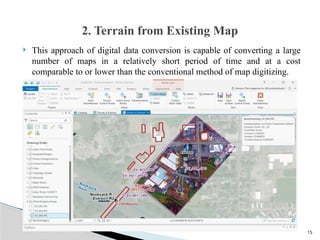
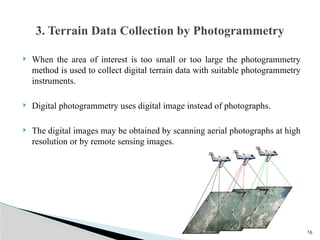
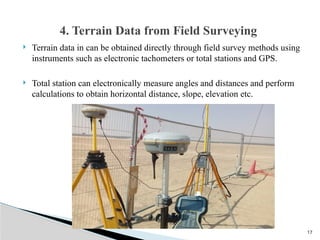
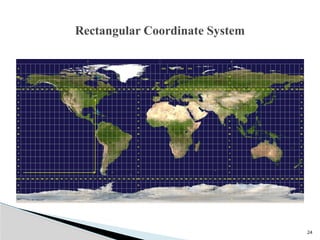
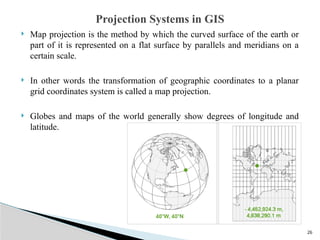
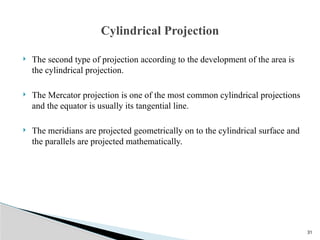
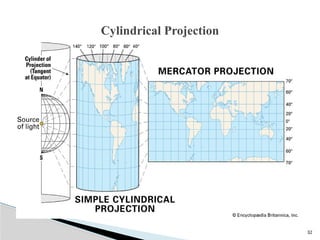
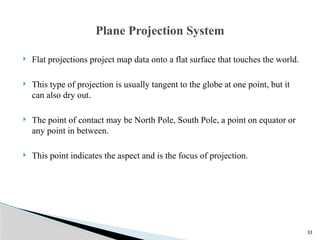
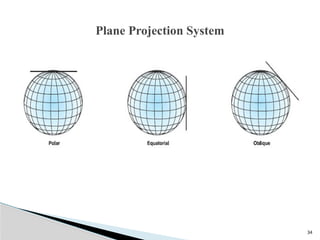
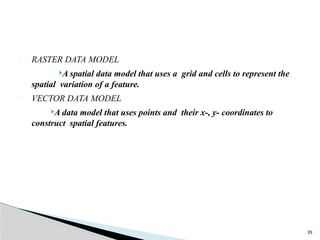
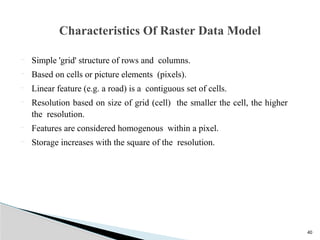
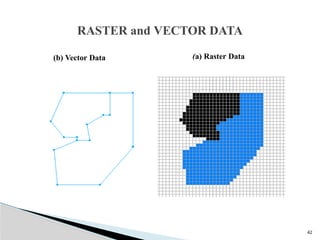
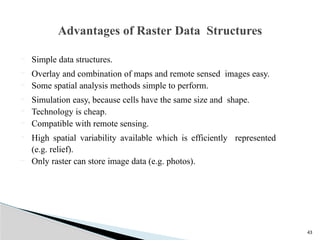
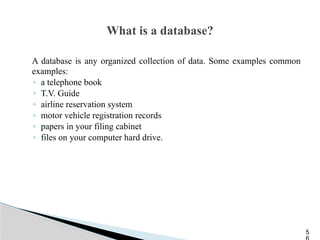
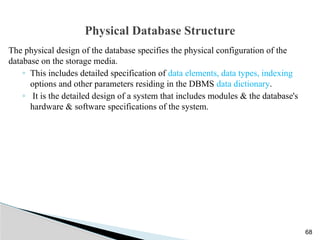
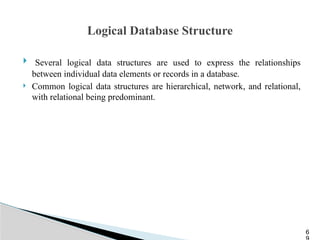
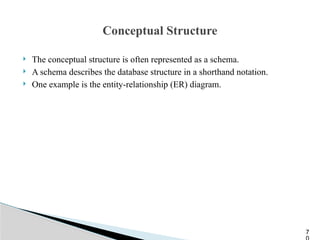
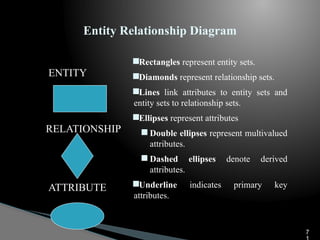
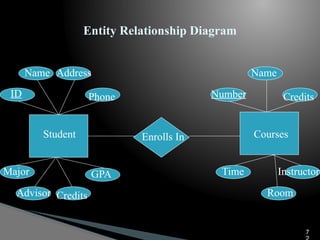
1
Unit No:05
GIS Data and Applications
2
 A model is simplified representation of a phenomenon or a system.
 A data model provides a set of guidelines for the transforming real world
in to digitally and logically spatial objects consisting of attribute and
geometry.
 The thematic layer approach allows to organize the complexity of real
world in to a simple representation to facilitate our understanding of
natural relationship.
 GIS can be viewed as a stack set of map layers with each layer aligned to
other layers.
Introduction
3
 Typically each layer contains a unique geographic theme or data type.
Those topics may include topography, soil type, land use, cadastral
information etc.
4
 Spatial Data
 Attribute Data
GIS Data Types
5
 Geographic data describes the absolute and relative position of geographic
features.
 Spatial features can be discrete or continuous. GIS can represent spatial
data that has a physical dimension on earth.

 The various components of geospatial data can be reduced to points, area,
polygons for effective processing.
1. Spatial Data
6
1. Spatial Data
7
 Discrete data are those that do not exist between observations, form
separate units and can be distinguished individually.
 Roads, wells, buildings are example of discrete data.
 Continuous features exists specifically between observations. Rainfall and
altitude are example of continuous features.
 Spatial features in the real world come in four types point, line, area and
surface.
8
 Attribute data describes the properties of spatial features. It contains the
characteristics of spatial features and descriptive information about
geographic features.
 Attribute data is non spatial data associated with units of type and area.
 Attribute data is a tabular data. GIS attributes are represented by colors,
textures, and liner or geographic symbol. For example university or school
structure are marked with spatial symbol and lines.
 The actual value of attribute that is measured and stored in the data base is
called the attribute value.
Attribute Data
9
 More than one attribute can be assigned to each spatial unit for example a
point representing a hotel can have multiple rooms, different
accommodation standards, different parking spaces etc.
 Primary Attributes: Socio economic characteristics and physical properties
of objects are primary attributes.
 Secondary Attributes: Flow level, districts, capitals are secondary
attributes.
 Spatial data is stored in a graphical file but attribute data is stored in a
rational database. Rational data base is collection of tables of values.
Attribute Data
10
 Data acquisition in GIS refers to all aspects of acquiring spatial data from
all available sources and converting it in to a digital format.
 The sources are,
 Natural Resource data:
 Consist of land use, crop type, cropping area, water bodies and drainage,
soil type, forest types.
 Demographic Data:
 It consists of data related to population, age structure, urban and rural
population, occupational structure.
Data Acquisition
11
 Agriculture and Economic Data:
 It consists of information about cropped and irrigated area, agricultural
production.
 Socio economic Data:
 It consists activities related to industrial, fishing, tourism development.
 Infrastructure Data:
 It consists information related to various facilities, utilities and services
such as education, health, power, transport, network, water supply,
communication etc.
Data Acquisition
12
Data Acquisition
13
1.Terrain data from satellite Remote Sensing:
 Terrain data recorded in digital format by sensors on board satellite
platforms can be used directly to create a GIS database after pre
processing.
 The digital images must be correctly locate in relation to a geodetic grid
other wise the data they contain can not be linked to their actual position
on the ground.
Data Acquisition
14
 Acquiring digital data by digitizing existing map is comparatively cheaper
and terrain data requires less time compare to other methods.
 Topographic maps covering a large part of a country are mostly available
and information needed for a particular job can be extracted from these
maps by digitization.
 The digitization of paper maps is done using a spatial data capturing
device called a digitizer.
 Map data conversion by scanning and vectorization is often referred to as
screen digitizing.
2. Terrain from Existing Map
15
 This approach of digital data conversion is capable of converting a large
number of maps in a relatively short period of time and at a cost
comparable to or lower than the conventional method of map digitizing.
2. Terrain from Existing Map
16
 When the area of interest is too small or too large the photogrammetry
method is used to collect digital terrain data with suitable photogrammetry
instruments.
 Digital photogrammetry uses digital image instead of photographs.
 The digital images may be obtained by scanning aerial photographs at high
resolution or by remote sensing images.
3. Terrain Data Collection by Photogrammetry
17
 Terrain data in can be obtained directly through field survey methods using
instruments such as electronic tachometers or total stations and GPS.
 Total station can electronically measure angles and distances and perform
calculations to obtain horizontal distance, slope, elevation etc.
4. Terrain Data from Field Surveying
18
 There are two basic field methods for GPS:
 Static and Differential
 GPS static survey is used to determine the location of survey control points
in areas where geodetic control is poor.
 Static GPS survey is primarily used for setting up geodetic controls and for
measuring national and international networks and is not intended for
usual ground data collection.
 Differential GPS surveying is used to determine the positions and heights
of ground points using new or existing control points.
5. Digital Terrain Data by GPS
19
 A spatial reference system is required to process information.
 The main purpose of a reference is to locate a feature on the surface of
earth or representation of that surface such as map.
 The aim of geo referencing is to provide a rigid spatial framework with
which to measure, calculate record and anlyze the positions of real features
for the length of line ,the size of area and shape of feature.
Geo Referencing of GIS Data
20
Geo Referencing of GIS Data
21
 The geographic coordinate system is the only system that defines the true
graphical coordinates in terms of latitude and longitudes.
 In this system of coordinates, the Earth is defined by a reference surface
using latitude and longitude.
1. Geographic Coordinate System
22
 The geographic coordinate system of latitude and longitude assumes that
the Earth is perfect sphere (Its not sphere).
 The Earth is actually an oblate spheroid and not a smooth and regular
surface.
1. Geographic Coordinate System
23
 Since most of the geospatial data available for use in GIS is 2D format, a
rectangular coordinate reference system is best.
 This required map grid or grid placed at the top of map.
 The grid is obtained by projecting the latitude or longitude of our
representation of the world as a globe on to a flat surface using a map
projection.
 The function of map projection is to define positions on the curved surface
of the earth when it is transformed into a flat map surface.
Rectangular Coordinate System
24
Rectangular Coordinate System
25
 the Universal Transverse Mercator projector system has been adopted by
many organizations for remote sensing and topographic mapping.
 Also used for natural resource inventory.
 Many GPS receivers are adopting this coordinate system as an option in
fact making it a standard coordinate system.
Rectangular Coordinate System
26
 Map projection is the method by which the curved surface of the earth or
part of it is represented on a flat surface by parallels and meridians on a
certain scale.
 In other words the transformation of geographic coordinates to a planar
grid coordinates system is called a map projection.
 Globes and maps of the world generally show degrees of longitude and
latitude.
Projection Systems in GIS
27
 Due to spherical shape of the earth and the plane surface on which this
shape has to be represented, cartographers have to device complex
graphical
 geometrical
 mathematical methods of transforming the earth, the resulting
transformation are collectively known as map projection.
Projection Systems in GIS
28
 A map projection is a method of representing the earths surface on a map
with the least amount of distortion or change in the shape, area, distance,
and direction of the feature.
 Globes represents the shape, area, distance and direction of features of
earth surface.
Projection Systems in GIS
29
 Because maps are flat some of simplest projections are made on geometric
shapes that can be flattened without stretching their surfaces. They are
called developable surfaces.
 Some common examples are cone, cylinders and planes.
 Conical Projection
 Cylindrical Projection
 Planar or Azimuthal Projection
Different Map Projections
30
 The first type of projection according to the development of surface is the
conical projection.
 The simplest cone projection is tangential to the globe along one degree of
latitude.
 This line is called standard parallel.
 The meridians project on to the conical surface and meet at the point of
cone.
Conical Projection
31
 The second type of projection according to the development of the area is
the cylindrical projection.
 The Mercator projection is one of the most common cylindrical projections
and the equator is usually its tangential line.
 The meridians are projected geometrically on to the cylindrical surface and
the parallels are projected mathematically.
Cylindrical Projection
32
Cylindrical Projection
33
 Flat projections project map data onto a flat surface that touches the world.
 This type of projection is usually tangent to the globe at one point, but it
can also dry out.
 The point of contact may be North Pole, South Pole, a point on equator or
any point in between.
 This point indicates the aspect and is the focus of projection.
Plane Projection System
34
Plane Projection System
35
Spatial Data Models
36
 Geographic features stored in a GIS can be considered as one of
three types:
• points: no area at this scale (e.g. building, tower)
• lines (arcs): no width at this scale (e.g. river, road, administrative
boundary)
• areas (polygons): line surrounding enclosed area (e.g. forest stand,
census district)
 Spatial characteristics of features can be stored in a GIS in one of two
ways:
 as raster data or as vector data.
RASTER AND VECTOR DATA
37
 Thus geographically referenced data is stored in: -
· Raster (grid or cellular-based) data structure.
·x, y coordinate reference-based (vector) data structure.
 Raster data structure
 Grid or cellular-based
Grid representation of a measured image property in which each grid cell
(pixel) comprises a digital number. The larger the area represented the lower
the resolution of the data. The smaller the area covered the greater the
resolution and the more accurately features are represented.
38
 Vector data structure
 Arc-node model
Arcs represent the shape of lines and are split at their intersections with
other arcs, where nodes occur; nodes represent the beginning and ending
vertex of each arc. Vector format- representation of features on the earth as
lines, points, or polygons as a series or XY Cartesian coordinates
39
• RASTER DATA MODEL
A spatial data model that uses a grid and cells to represent the
spatial variation of a feature.
• VECTOR DATA MODEL
A data model that uses points and their x-, y- coordinates to
construct spatial features.
40
 Simple 'grid' structure of rows and columns.
 Based on cells or picture elements (pixels).
 Linear feature (e.g. a road) is a contiguous set of cells.
 Resolution based on size of grid (cell) the smaller the cell, the higher
the resolution.
 Features are considered homogenous within a pixel.
 Storage increases with the square of the resolution.
Characteristics Of Raster Data Model
41
 Based on objects (points, lines, areas).
 Constructed using arcs, nodes and vertices.
 Resolution can be independent of detail.
 Every point has a unique location.
Characteristics Of Vector Data Model
42
RASTER and VECTOR DATA
(a) Raster Data
(b) Vector Data
43
 Simple data structures.
 Overlay and combination of maps and remote sensed images easy.
 Some spatial analysis methods simple to perform.
 Simulation easy, because cells have the same size and shape.
 Technology is cheap.
 Compatible with remote sensing.
 High spatial variability available which is efficiently represented
(e.g. relief).
 Only raster can store image data (e.g. photos).
Advantages of Raster Data Structures
44
 Good representation of phenomenonology.
 Topology can be completely described and easy to maintain.
 Accurate graphics, retrieval, updating and generalization of
graphics and attributes possible.
 Requires less disk storage.
 Graphical maps more closely represent hand- drawn.
 Compact data structure for homogenous areas.
 Better suited for map output.
Advantages of Vector Data Structures
45
 Crude raster maps are considerably less beautiful than line maps.
 Projection transformations are time consuming
 Requires more storage space.
 Boundaries has more blocky appearance.
 More difficult to represent topology.
 Data structure is not compact (though it can be modified).
 Topological relationships are harder to represent.
 Map output can appear 'blocky‘, less accurate maps.
 The use of large cells to reduce data volumes means that recognizable
structures can be lost and there can be a serious loss of information (drop
out).
Disadvantages of Raster Data Structures
46
 More complex Data Structures.
 Combination of several vector polygon maps or polygon and raster maps
through overlay creates difficulties.
 Simulation is difficult because each unit has a different topological form.
 Display and plotting can be expensive, particularly for high quality, color
and cross-hatching.
 Spatial analysis and filtering within polygons are impossible.
 Not as compatible with remote sensing as raster data.
 Overlay analysis more time-consuming than raster data.
 High spatial variability is less efficiently stored.
 Cannot store (continuously varying) image data.
Disadvantages of Vector Data Structures
47
 The primary focus of the vector data model is the geographic feature; the
primary focus of the raster data model is location.
 The vector data model is more suited to the question of “What do I know
about this geographic feature? The raster data model answers the
question, “What geographic phenomenon occurs at this location.”
 The vector model uses x, y coordinates to represent geographic features,
raster store rows and columns of cell values.
 The vector data model defines boundaries. There are no boundaries
defined in the raster data model.
COMPARISON OF RASTER AND VECTOR
DATA MODELS
48
 A separate data model is used to store and maintain attribute data for GIS
software. These data models may exist internally within the GIS software,
or may be reflected in external commercial Database Management
Software (DBMS). A variety of different data models exist for the storage
and management of attribute data. The most common are:
 Tabular
 Hierarchical
 Network
 Relational
 Object Oriented
ATTRIBUTE DATA MODELS
49
 The tabular model is the manner in which most early GIS software
packages stored their attribute data.
 The simple tabular model stores attribute data as sequential data files with
fixed formats (or comma delimited for ASCII data), for the location of
attribute values in a predefined record structure.
The tabular model
50
 The hierarchical data base organizes data in a tree structure. Data is
structured downward in a hierarchy of tables.
 They are oriented for data sets that are very stable, where primary
relationships among the data change infrequently or never at all.
 Also, the limitation on the number of parents that an element may have is
not always conducive to actual geographic phenomenon.
The hierarchical data base
51
 The network database organizes data in a network or plex structure. Any
column in a plex structure can be linked to any other.
 Like a tree structure, a plex structure can be described in terms of major
and minor.
 This model allows for minor to have more than one major.
 Network DBMS have not found much more acceptance in GIS than the
hierarchical DBMS.
The network database
52
 They have the same flexibility limitations as hierarchical databases;
however, the more powerful structure for representing data relationships
allows a more realistic modelling of geographic phenomenon.
 However, network databases tend to become overly complex too easily.

 In this regard it is easy to lose control and understanding of the
relationships between elements.
The network database
53
 The relational database organizes data in tables.
 Each table, is identified by a unique table name, and is organized by rows
and columns.
 Each column within a table also has a unique name.
 Columns store the values for a specific attribute, e.g. cover group, tree
height.
 Rows represent one record in the table. In a GIS each row is usually linked
to a separate spatial feature, e.g. a forestry stand.
 Accordingly, each row would be comprised of several columns, each
column containing a specific value for that geographic feature.
Relational Model
54
 Data is often stored in several tables.
 Tables can be joined or referenced to each other by common columns
(relational fields).
 Usually the common column is an identification number for a selected
geographic feature, e.g. a forestry stand polygon number.
 This identification number acts as the primary key for the table.
 The ability to join tables through use of a common column is the essence
of the relational model. Such relational joins are usually temporary in
nature and form the basis of for querying in a relational GIS product.
Relational Model
55
 The object-oriented database model manages data through objects.
 An object is a collection of data elements and operations that together are
considered a single entity.
 The object-oriented database is a relatively new model.
 This approach has the attraction that querying is very natural, as features
can be bundled together with attributes at the database administrator's
discretion.
 To date, only a few GIS packages are promoting the use of this attribute
data model.
 However, initial impressions indicate that this approach may hold many
operational benefits with respect to geographic data processing.
 Fulfillment of this promise with a commercial GIS product remains to be
seen.
OBJECT-ORIENTED DATA MODEL
What is a database?
A database is any organized collection of data. Some examples common
examples:
◦ a telephone book
◦ T.V. Guide
◦ airline reservation system
◦ motor vehicle registration records
◦ papers in your filing cabinet
◦ files on your computer hard drive.
5
Database Definitions
What is a database?
It’s an organized collection of data, it need not be a computer based system.
What is a database management system (DBMS)?
A software system designed to:
◦ Organize that data in a flexible manner,
◦ Provide tools to add, modify or delete data from the database,
◦ Query the data,
◦ Produce reports summarizing selected contents.
57
What is the ultimate purpose of a database
management system?
Data Information Knowledge Action
Is to transform
5
Features of a DBMS
Database Management Systems provide features to maintain database:
◦ Data independence - It refers to the immunity of user applications to
make changes in the definition and organization of data.
◦ Integrity and security - refers to maintaining and assuring the accuracy
and consistency of data over its entire life-cycle
59
Features of a DBMS
Database Management Systems provide features to maintain database:
◦ Transaction management - A transaction comprises a unit of work
performed within a DBMS against a database, and treated in a coherent
and reliable way independent of other transactions. Transactions in a
database environment have two main purposes:
 To provide isolation from other transactions.
 To have an “all or nothing” effect.
Transactions must pass the ACID test (atomic, consistent, isolated
and durable
60
Features of a DBMS
Database Management Systems provide features to maintain database:
◦ Concurrency control - ensures that correct results for concurrent
operations are generated, while getting those results as quickly as
possible.
◦ Backup and recovery
◦ Provides a language for the creation and querying of the database.
◦ A language for writing application programs
61
Selecting a Database Management System
Database management systems (or DBMSs) can be divided into two
categories:
◦ Desktop databases are oriented toward single-user applications and
reside on standard personal computers (hence the term desktop).
◦ Server databases contain mechanisms to ensure the reliability and
consistency of data and are geared toward multi-user applications.
6
Relational Databases
 The relational database model is the most dominant model in both the
corporate and GIS world, due to its flexibility, organization, and
functioning..
 It was defined by Edgar F. Codd (1970).
 It can accommodate a wide range of data types.
 It is not necessary to know beforehand the types of processing that will be
performed on the database.
6
Relational Database Terminology
 Each table contains the data for a single entity.
 Each instance of an entity is a row/record/tuple in the table. This is a specific
instance of the entity.
 Columns contain attributes/fields that describe the entity.
◦ Attributes in a column must be from the same domain (text, integer, date).
◦ An attribute may have a range (e.g.; 0 ≤ integers ≤ 100)
◦ Column order has no significance.
 Tables are related through keys.
6
Attributes
 An entity is represented by a set of attributes, that is descriptive properties
possessed by all members of an entity set.
Domain – the set of permitted values for each attribute
 Attribute types:
◦ Simple and composite attributes.
◦ Single-valued and multi-valued attributes
 E.g. multivalued attribute: phone-numbers
◦ Derived attributes
 Can be computed from other attributes
 E.g. age, given date of birth
6
Relational Database Terminology
6
Record, row,
tuple
A specific
instance of the
entity
Attribute, column
Entity
Keys
 A super key of an entity set is a set of one or more attributes whose values
uniquely determine each entity.
 A candidate key of an entity set is a minimal super key
◦ Customer-id is candidate key of customer
◦ account-number is candidate key of account
 Although several candidate keys may exist, one of the candidate keys is
selected to be the primary key.
6
Physical Database Structure
The physical design of the database specifies the physical configuration of the
database on the storage media.
◦ This includes detailed specification of data elements, data types, indexing
options and other parameters residing in the DBMS data dictionary.
◦ It is the detailed design of a system that includes modules & the database's
hardware & software specifications of the system.
68
Logical Database Structure
 Several logical data structures are used to express the relationships
between individual data elements or records in a database.
 Common logical data structures are hierarchical, network, and relational,
with relational being predominant.
6
Conceptual Structure
 The conceptual structure is often represented as a schema.
 A schema describes the database structure in a shorthand notation.
 One example is the entity-relationship (ER) diagram.
7
Entity Relationship Diagram
ENTITY
RELATIONSHIP
ATTRIBUTE
Rectangles represent entity sets.
Diamonds represent relationship sets.
Lines link attributes to entity sets and
entity sets to relationship sets.
Ellipses represent attributes
 Double ellipses represent multivalued
attributes.
 Dashed ellipses denote derived
attributes.
Underline indicates primary key
attributes.
7
Entity Relationship Diagram
Student Enrolls In Courses
ID
Name Address
Phone
Major
Advisor Credits
GPA
Number
Name
Credits
Time
Room
Instructor
7
Entity Relationship Model
 The result is a diagram of all of the entities, their attributes, and the
relationships between entities
◦ Each entity becomes a table.
 Student table
 Course table
◦ Each relationship (usually) becomes a table.
 Enrolls, which allows you to join information from both tables.
7
Coverages and Shapefiles
◦ Coverages are stored partially in their own folder and partially in the
common INFO folder.
◦ Shapefiles are stored in three to five files (with
extensions .shp, .shx, .dbf, .sbx and .sbn).
◦ Coverages store common boundaries between polygons only once, to avoid
redundancy.
◦ Shapefiles store all the geometry of each polygon regardless of redundancy.
◦ Coverage features are single lines or single polygons.
◦ Shapefiles allow features to have multiple, disconnected, intersecting and
overlapping components.
7
Geodatabase Model
 Stores geographic coordinates as one attribute (shape) in a relational database
table.
 Uses MS Access for “Personal Geodatabase” (single user)
 Uses a file system for a “File Geodatabse” (FGDB).
 Uses Oracle, Sybase, Ingress or other commercial relational databases for
“Enterprise Geodatabases” (many simultaneous users)
75

GIS Data(thematic layers) and its application

  • 1.
    1 Unit No:05 GIS Dataand Applications
  • 2.
    2  A modelis simplified representation of a phenomenon or a system.  A data model provides a set of guidelines for the transforming real world in to digitally and logically spatial objects consisting of attribute and geometry.  The thematic layer approach allows to organize the complexity of real world in to a simple representation to facilitate our understanding of natural relationship.  GIS can be viewed as a stack set of map layers with each layer aligned to other layers. Introduction
  • 3.
    3  Typically eachlayer contains a unique geographic theme or data type. Those topics may include topography, soil type, land use, cadastral information etc.
  • 4.
    4  Spatial Data Attribute Data GIS Data Types
  • 5.
    5  Geographic datadescribes the absolute and relative position of geographic features.  Spatial features can be discrete or continuous. GIS can represent spatial data that has a physical dimension on earth.   The various components of geospatial data can be reduced to points, area, polygons for effective processing. 1. Spatial Data
  • 6.
  • 7.
    7  Discrete dataare those that do not exist between observations, form separate units and can be distinguished individually.  Roads, wells, buildings are example of discrete data.  Continuous features exists specifically between observations. Rainfall and altitude are example of continuous features.  Spatial features in the real world come in four types point, line, area and surface.
  • 8.
    8  Attribute datadescribes the properties of spatial features. It contains the characteristics of spatial features and descriptive information about geographic features.  Attribute data is non spatial data associated with units of type and area.  Attribute data is a tabular data. GIS attributes are represented by colors, textures, and liner or geographic symbol. For example university or school structure are marked with spatial symbol and lines.  The actual value of attribute that is measured and stored in the data base is called the attribute value. Attribute Data
  • 9.
    9  More thanone attribute can be assigned to each spatial unit for example a point representing a hotel can have multiple rooms, different accommodation standards, different parking spaces etc.  Primary Attributes: Socio economic characteristics and physical properties of objects are primary attributes.  Secondary Attributes: Flow level, districts, capitals are secondary attributes.  Spatial data is stored in a graphical file but attribute data is stored in a rational database. Rational data base is collection of tables of values. Attribute Data
  • 10.
    10  Data acquisitionin GIS refers to all aspects of acquiring spatial data from all available sources and converting it in to a digital format.  The sources are,  Natural Resource data:  Consist of land use, crop type, cropping area, water bodies and drainage, soil type, forest types.  Demographic Data:  It consists of data related to population, age structure, urban and rural population, occupational structure. Data Acquisition
  • 11.
    11  Agriculture andEconomic Data:  It consists of information about cropped and irrigated area, agricultural production.  Socio economic Data:  It consists activities related to industrial, fishing, tourism development.  Infrastructure Data:  It consists information related to various facilities, utilities and services such as education, health, power, transport, network, water supply, communication etc. Data Acquisition
  • 12.
  • 13.
    13 1.Terrain data fromsatellite Remote Sensing:  Terrain data recorded in digital format by sensors on board satellite platforms can be used directly to create a GIS database after pre processing.  The digital images must be correctly locate in relation to a geodetic grid other wise the data they contain can not be linked to their actual position on the ground. Data Acquisition
  • 14.
    14  Acquiring digitaldata by digitizing existing map is comparatively cheaper and terrain data requires less time compare to other methods.  Topographic maps covering a large part of a country are mostly available and information needed for a particular job can be extracted from these maps by digitization.  The digitization of paper maps is done using a spatial data capturing device called a digitizer.  Map data conversion by scanning and vectorization is often referred to as screen digitizing. 2. Terrain from Existing Map
  • 15.
    15  This approachof digital data conversion is capable of converting a large number of maps in a relatively short period of time and at a cost comparable to or lower than the conventional method of map digitizing. 2. Terrain from Existing Map
  • 16.
    16  When thearea of interest is too small or too large the photogrammetry method is used to collect digital terrain data with suitable photogrammetry instruments.  Digital photogrammetry uses digital image instead of photographs.  The digital images may be obtained by scanning aerial photographs at high resolution or by remote sensing images. 3. Terrain Data Collection by Photogrammetry
  • 17.
    17  Terrain datain can be obtained directly through field survey methods using instruments such as electronic tachometers or total stations and GPS.  Total station can electronically measure angles and distances and perform calculations to obtain horizontal distance, slope, elevation etc. 4. Terrain Data from Field Surveying
  • 18.
    18  There aretwo basic field methods for GPS:  Static and Differential  GPS static survey is used to determine the location of survey control points in areas where geodetic control is poor.  Static GPS survey is primarily used for setting up geodetic controls and for measuring national and international networks and is not intended for usual ground data collection.  Differential GPS surveying is used to determine the positions and heights of ground points using new or existing control points. 5. Digital Terrain Data by GPS
  • 19.
    19  A spatialreference system is required to process information.  The main purpose of a reference is to locate a feature on the surface of earth or representation of that surface such as map.  The aim of geo referencing is to provide a rigid spatial framework with which to measure, calculate record and anlyze the positions of real features for the length of line ,the size of area and shape of feature. Geo Referencing of GIS Data
  • 20.
  • 21.
    21  The geographiccoordinate system is the only system that defines the true graphical coordinates in terms of latitude and longitudes.  In this system of coordinates, the Earth is defined by a reference surface using latitude and longitude. 1. Geographic Coordinate System
  • 22.
    22  The geographiccoordinate system of latitude and longitude assumes that the Earth is perfect sphere (Its not sphere).  The Earth is actually an oblate spheroid and not a smooth and regular surface. 1. Geographic Coordinate System
  • 23.
    23  Since mostof the geospatial data available for use in GIS is 2D format, a rectangular coordinate reference system is best.  This required map grid or grid placed at the top of map.  The grid is obtained by projecting the latitude or longitude of our representation of the world as a globe on to a flat surface using a map projection.  The function of map projection is to define positions on the curved surface of the earth when it is transformed into a flat map surface. Rectangular Coordinate System
  • 24.
  • 25.
    25  the UniversalTransverse Mercator projector system has been adopted by many organizations for remote sensing and topographic mapping.  Also used for natural resource inventory.  Many GPS receivers are adopting this coordinate system as an option in fact making it a standard coordinate system. Rectangular Coordinate System
  • 26.
    26  Map projectionis the method by which the curved surface of the earth or part of it is represented on a flat surface by parallels and meridians on a certain scale.  In other words the transformation of geographic coordinates to a planar grid coordinates system is called a map projection.  Globes and maps of the world generally show degrees of longitude and latitude. Projection Systems in GIS
  • 27.
    27  Due tospherical shape of the earth and the plane surface on which this shape has to be represented, cartographers have to device complex graphical  geometrical  mathematical methods of transforming the earth, the resulting transformation are collectively known as map projection. Projection Systems in GIS
  • 28.
    28  A mapprojection is a method of representing the earths surface on a map with the least amount of distortion or change in the shape, area, distance, and direction of the feature.  Globes represents the shape, area, distance and direction of features of earth surface. Projection Systems in GIS
  • 29.
    29  Because mapsare flat some of simplest projections are made on geometric shapes that can be flattened without stretching their surfaces. They are called developable surfaces.  Some common examples are cone, cylinders and planes.  Conical Projection  Cylindrical Projection  Planar or Azimuthal Projection Different Map Projections
  • 30.
    30  The firsttype of projection according to the development of surface is the conical projection.  The simplest cone projection is tangential to the globe along one degree of latitude.  This line is called standard parallel.  The meridians project on to the conical surface and meet at the point of cone. Conical Projection
  • 31.
    31  The secondtype of projection according to the development of the area is the cylindrical projection.  The Mercator projection is one of the most common cylindrical projections and the equator is usually its tangential line.  The meridians are projected geometrically on to the cylindrical surface and the parallels are projected mathematically. Cylindrical Projection
  • 32.
  • 33.
    33  Flat projectionsproject map data onto a flat surface that touches the world.  This type of projection is usually tangent to the globe at one point, but it can also dry out.  The point of contact may be North Pole, South Pole, a point on equator or any point in between.  This point indicates the aspect and is the focus of projection. Plane Projection System
  • 34.
  • 35.
  • 36.
    36  Geographic featuresstored in a GIS can be considered as one of three types: • points: no area at this scale (e.g. building, tower) • lines (arcs): no width at this scale (e.g. river, road, administrative boundary) • areas (polygons): line surrounding enclosed area (e.g. forest stand, census district)  Spatial characteristics of features can be stored in a GIS in one of two ways:  as raster data or as vector data. RASTER AND VECTOR DATA
  • 37.
    37  Thus geographicallyreferenced data is stored in: - · Raster (grid or cellular-based) data structure. ·x, y coordinate reference-based (vector) data structure.  Raster data structure  Grid or cellular-based Grid representation of a measured image property in which each grid cell (pixel) comprises a digital number. The larger the area represented the lower the resolution of the data. The smaller the area covered the greater the resolution and the more accurately features are represented.
  • 38.
    38  Vector datastructure  Arc-node model Arcs represent the shape of lines and are split at their intersections with other arcs, where nodes occur; nodes represent the beginning and ending vertex of each arc. Vector format- representation of features on the earth as lines, points, or polygons as a series or XY Cartesian coordinates
  • 39.
    39 • RASTER DATAMODEL A spatial data model that uses a grid and cells to represent the spatial variation of a feature. • VECTOR DATA MODEL A data model that uses points and their x-, y- coordinates to construct spatial features.
  • 40.
    40  Simple 'grid'structure of rows and columns.  Based on cells or picture elements (pixels).  Linear feature (e.g. a road) is a contiguous set of cells.  Resolution based on size of grid (cell) the smaller the cell, the higher the resolution.  Features are considered homogenous within a pixel.  Storage increases with the square of the resolution. Characteristics Of Raster Data Model
  • 41.
    41  Based onobjects (points, lines, areas).  Constructed using arcs, nodes and vertices.  Resolution can be independent of detail.  Every point has a unique location. Characteristics Of Vector Data Model
  • 42.
    42 RASTER and VECTORDATA (a) Raster Data (b) Vector Data
  • 43.
    43  Simple datastructures.  Overlay and combination of maps and remote sensed images easy.  Some spatial analysis methods simple to perform.  Simulation easy, because cells have the same size and shape.  Technology is cheap.  Compatible with remote sensing.  High spatial variability available which is efficiently represented (e.g. relief).  Only raster can store image data (e.g. photos). Advantages of Raster Data Structures
  • 44.
    44  Good representationof phenomenonology.  Topology can be completely described and easy to maintain.  Accurate graphics, retrieval, updating and generalization of graphics and attributes possible.  Requires less disk storage.  Graphical maps more closely represent hand- drawn.  Compact data structure for homogenous areas.  Better suited for map output. Advantages of Vector Data Structures
  • 45.
    45  Crude rastermaps are considerably less beautiful than line maps.  Projection transformations are time consuming  Requires more storage space.  Boundaries has more blocky appearance.  More difficult to represent topology.  Data structure is not compact (though it can be modified).  Topological relationships are harder to represent.  Map output can appear 'blocky‘, less accurate maps.  The use of large cells to reduce data volumes means that recognizable structures can be lost and there can be a serious loss of information (drop out). Disadvantages of Raster Data Structures
  • 46.
    46  More complexData Structures.  Combination of several vector polygon maps or polygon and raster maps through overlay creates difficulties.  Simulation is difficult because each unit has a different topological form.  Display and plotting can be expensive, particularly for high quality, color and cross-hatching.  Spatial analysis and filtering within polygons are impossible.  Not as compatible with remote sensing as raster data.  Overlay analysis more time-consuming than raster data.  High spatial variability is less efficiently stored.  Cannot store (continuously varying) image data. Disadvantages of Vector Data Structures
  • 47.
    47  The primaryfocus of the vector data model is the geographic feature; the primary focus of the raster data model is location.  The vector data model is more suited to the question of “What do I know about this geographic feature? The raster data model answers the question, “What geographic phenomenon occurs at this location.”  The vector model uses x, y coordinates to represent geographic features, raster store rows and columns of cell values.  The vector data model defines boundaries. There are no boundaries defined in the raster data model. COMPARISON OF RASTER AND VECTOR DATA MODELS
  • 48.
    48  A separatedata model is used to store and maintain attribute data for GIS software. These data models may exist internally within the GIS software, or may be reflected in external commercial Database Management Software (DBMS). A variety of different data models exist for the storage and management of attribute data. The most common are:  Tabular  Hierarchical  Network  Relational  Object Oriented ATTRIBUTE DATA MODELS
  • 49.
    49  The tabularmodel is the manner in which most early GIS software packages stored their attribute data.  The simple tabular model stores attribute data as sequential data files with fixed formats (or comma delimited for ASCII data), for the location of attribute values in a predefined record structure. The tabular model
  • 50.
    50  The hierarchicaldata base organizes data in a tree structure. Data is structured downward in a hierarchy of tables.  They are oriented for data sets that are very stable, where primary relationships among the data change infrequently or never at all.  Also, the limitation on the number of parents that an element may have is not always conducive to actual geographic phenomenon. The hierarchical data base
  • 51.
    51  The networkdatabase organizes data in a network or plex structure. Any column in a plex structure can be linked to any other.  Like a tree structure, a plex structure can be described in terms of major and minor.  This model allows for minor to have more than one major.  Network DBMS have not found much more acceptance in GIS than the hierarchical DBMS. The network database
  • 52.
    52  They havethe same flexibility limitations as hierarchical databases; however, the more powerful structure for representing data relationships allows a more realistic modelling of geographic phenomenon.  However, network databases tend to become overly complex too easily.   In this regard it is easy to lose control and understanding of the relationships between elements. The network database
  • 53.
    53  The relationaldatabase organizes data in tables.  Each table, is identified by a unique table name, and is organized by rows and columns.  Each column within a table also has a unique name.  Columns store the values for a specific attribute, e.g. cover group, tree height.  Rows represent one record in the table. In a GIS each row is usually linked to a separate spatial feature, e.g. a forestry stand.  Accordingly, each row would be comprised of several columns, each column containing a specific value for that geographic feature. Relational Model
  • 54.
    54  Data isoften stored in several tables.  Tables can be joined or referenced to each other by common columns (relational fields).  Usually the common column is an identification number for a selected geographic feature, e.g. a forestry stand polygon number.  This identification number acts as the primary key for the table.  The ability to join tables through use of a common column is the essence of the relational model. Such relational joins are usually temporary in nature and form the basis of for querying in a relational GIS product. Relational Model
  • 55.
    55  The object-orienteddatabase model manages data through objects.  An object is a collection of data elements and operations that together are considered a single entity.  The object-oriented database is a relatively new model.  This approach has the attraction that querying is very natural, as features can be bundled together with attributes at the database administrator's discretion.  To date, only a few GIS packages are promoting the use of this attribute data model.  However, initial impressions indicate that this approach may hold many operational benefits with respect to geographic data processing.  Fulfillment of this promise with a commercial GIS product remains to be seen. OBJECT-ORIENTED DATA MODEL
  • 56.
    What is adatabase? A database is any organized collection of data. Some examples common examples: ◦ a telephone book ◦ T.V. Guide ◦ airline reservation system ◦ motor vehicle registration records ◦ papers in your filing cabinet ◦ files on your computer hard drive. 5
  • 57.
    Database Definitions What isa database? It’s an organized collection of data, it need not be a computer based system. What is a database management system (DBMS)? A software system designed to: ◦ Organize that data in a flexible manner, ◦ Provide tools to add, modify or delete data from the database, ◦ Query the data, ◦ Produce reports summarizing selected contents. 57
  • 58.
    What is theultimate purpose of a database management system? Data Information Knowledge Action Is to transform 5
  • 59.
    Features of aDBMS Database Management Systems provide features to maintain database: ◦ Data independence - It refers to the immunity of user applications to make changes in the definition and organization of data. ◦ Integrity and security - refers to maintaining and assuring the accuracy and consistency of data over its entire life-cycle 59
  • 60.
    Features of aDBMS Database Management Systems provide features to maintain database: ◦ Transaction management - A transaction comprises a unit of work performed within a DBMS against a database, and treated in a coherent and reliable way independent of other transactions. Transactions in a database environment have two main purposes:  To provide isolation from other transactions.  To have an “all or nothing” effect. Transactions must pass the ACID test (atomic, consistent, isolated and durable 60
  • 61.
    Features of aDBMS Database Management Systems provide features to maintain database: ◦ Concurrency control - ensures that correct results for concurrent operations are generated, while getting those results as quickly as possible. ◦ Backup and recovery ◦ Provides a language for the creation and querying of the database. ◦ A language for writing application programs 61
  • 62.
    Selecting a DatabaseManagement System Database management systems (or DBMSs) can be divided into two categories: ◦ Desktop databases are oriented toward single-user applications and reside on standard personal computers (hence the term desktop). ◦ Server databases contain mechanisms to ensure the reliability and consistency of data and are geared toward multi-user applications. 6
  • 63.
    Relational Databases  Therelational database model is the most dominant model in both the corporate and GIS world, due to its flexibility, organization, and functioning..  It was defined by Edgar F. Codd (1970).  It can accommodate a wide range of data types.  It is not necessary to know beforehand the types of processing that will be performed on the database. 6
  • 64.
    Relational Database Terminology Each table contains the data for a single entity.  Each instance of an entity is a row/record/tuple in the table. This is a specific instance of the entity.  Columns contain attributes/fields that describe the entity. ◦ Attributes in a column must be from the same domain (text, integer, date). ◦ An attribute may have a range (e.g.; 0 ≤ integers ≤ 100) ◦ Column order has no significance.  Tables are related through keys. 6
  • 65.
    Attributes  An entityis represented by a set of attributes, that is descriptive properties possessed by all members of an entity set. Domain – the set of permitted values for each attribute  Attribute types: ◦ Simple and composite attributes. ◦ Single-valued and multi-valued attributes  E.g. multivalued attribute: phone-numbers ◦ Derived attributes  Can be computed from other attributes  E.g. age, given date of birth 6
  • 66.
    Relational Database Terminology 6 Record,row, tuple A specific instance of the entity Attribute, column Entity
  • 67.
    Keys  A superkey of an entity set is a set of one or more attributes whose values uniquely determine each entity.  A candidate key of an entity set is a minimal super key ◦ Customer-id is candidate key of customer ◦ account-number is candidate key of account  Although several candidate keys may exist, one of the candidate keys is selected to be the primary key. 6
  • 68.
    Physical Database Structure Thephysical design of the database specifies the physical configuration of the database on the storage media. ◦ This includes detailed specification of data elements, data types, indexing options and other parameters residing in the DBMS data dictionary. ◦ It is the detailed design of a system that includes modules & the database's hardware & software specifications of the system. 68
  • 69.
    Logical Database Structure Several logical data structures are used to express the relationships between individual data elements or records in a database.  Common logical data structures are hierarchical, network, and relational, with relational being predominant. 6
  • 70.
    Conceptual Structure  Theconceptual structure is often represented as a schema.  A schema describes the database structure in a shorthand notation.  One example is the entity-relationship (ER) diagram. 7
  • 71.
    Entity Relationship Diagram ENTITY RELATIONSHIP ATTRIBUTE Rectanglesrepresent entity sets. Diamonds represent relationship sets. Lines link attributes to entity sets and entity sets to relationship sets. Ellipses represent attributes  Double ellipses represent multivalued attributes.  Dashed ellipses denote derived attributes. Underline indicates primary key attributes. 7
  • 72.
    Entity Relationship Diagram StudentEnrolls In Courses ID Name Address Phone Major Advisor Credits GPA Number Name Credits Time Room Instructor 7
  • 73.
    Entity Relationship Model The result is a diagram of all of the entities, their attributes, and the relationships between entities ◦ Each entity becomes a table.  Student table  Course table ◦ Each relationship (usually) becomes a table.  Enrolls, which allows you to join information from both tables. 7
  • 74.
    Coverages and Shapefiles ◦Coverages are stored partially in their own folder and partially in the common INFO folder. ◦ Shapefiles are stored in three to five files (with extensions .shp, .shx, .dbf, .sbx and .sbn). ◦ Coverages store common boundaries between polygons only once, to avoid redundancy. ◦ Shapefiles store all the geometry of each polygon regardless of redundancy. ◦ Coverage features are single lines or single polygons. ◦ Shapefiles allow features to have multiple, disconnected, intersecting and overlapping components. 7
  • 75.
    Geodatabase Model  Storesgeographic coordinates as one attribute (shape) in a relational database table.  Uses MS Access for “Personal Geodatabase” (single user)  Uses a file system for a “File Geodatabse” (FGDB).  Uses Oracle, Sybase, Ingress or other commercial relational databases for “Enterprise Geodatabases” (many simultaneous users) 75

Editor's Notes

  • #64 Column order has no significance.