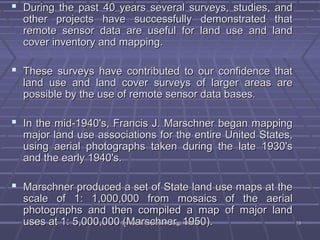
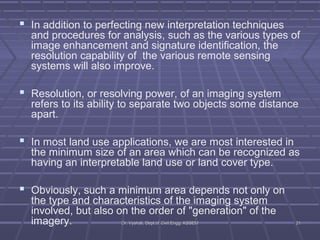
In additionto perfecting new interpretation techniques
and procedures for analysis, such as the various types of
image enhancement and signature identification, the
resolution capability of the various remote sensing
systems will also improve.
Resolution, or resolving power, of an imaging system
refers to its ability to separate two objects some distance
apart.
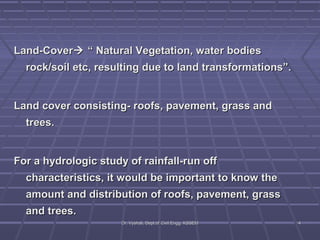
In most land use applications, we are most interested in
the minimum size of an area which can be recognized as
having an interpretable land use or land cover type.
Obviously, such a minimum area depends not only on
the type and characteristics of the imaging system
involved, but also on the order of "generation" of the
imagery. DDrr.. VVyysshhaallii,, DDeepptt..ooff CCiivviill EEnngggg.. KKSSSSEEMM 2211
22.
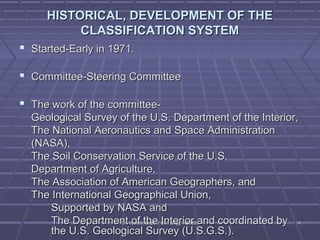
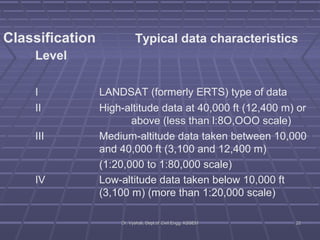
Classification Typical datacharacteristics
Level
I LANDSAT (formerly ERTS) type of data
II High-altitude data at 40,000 ft (12,400 m) or
above (less than l:8O,OOO scale)
III Medium-altitude data taken between 10,000
and 40,000 ft (3,100 and 12,400 m)
(1:20,000 to 1:80,000 scale)
IV Low-altitude data taken below 10,000 ft
(3,100 m) (more than 1:20,000 scale)
DDrr.. VVyysshhaallii,, DDeepptt..ooff CCiivviill EEnngggg.. KKSSSSEEMM 2222
23.
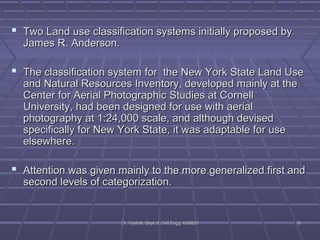
Information atLevels I and II would generally be of
interest to users who desire data on a nationwide,
interstate, or statewide basis.
More detailed land use and land cover data such as
those categorized at Levels III and IV usually will be
used more frequently by those who need and generate
local information at the intrastate, regional, county, or
municipal level.
In general, Level II land use and land cover data
interface quite effectively with point and line data
available on the standard U.S.G.S. topographic maps
DDrr.. VVyysshhaallii,, DDeepptt..ooff CCiivviill EEnngggg.. KKSSSSEEMM 2233
24.
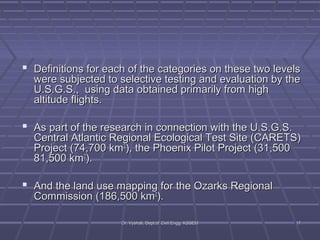
Level Iland use information, efficiently and economically
gathered over large areas by a LANDSAT type of satellite or
from high-altitude imagery, could also be interpreted from
conventional large-scale aircraft imagery or compiled by
ground survey.
This same information can be displayed at a wide variety of
scales ranging from a standard topographic map scale, such
as 1:24,000 or even larger, to the much smaller scale of the
orbital imagery, such as 1 :1,000,000.
Similarly, several Level II categories (and, in some instances,
Level III categories) have been interpreted from LANDSAT
data.
Presently, though, Level II categories are obtained more
accurately from high altitude photographs. Much Level III and
Level IV land use and land cover data can also be obtained
from high altitude imDDarr.. gVVyyseshhaarllii,,y DDee.pptt..ooff CCiivviill EEnngggg.. KKSSSSEEMM 2244
25.
DEVELOPING THE CLASSIFICATIONSYSTEM
Special attention has been paid to the definitions of land
use categories used by other agencies, to the extent that
they are useful in categorizing data obtained from
remote sensor sources.
The definition of Urban or Built-up Land, for example,
includes those uses similarly classified (Wooten and
Anderson, 1957) by the U.S. Department of Agriculture,
plus the built-up portions of major recreational sites,
public installations, and other similar facilities.
Agricultural land has been defined to include Cropland
and Pasture; Orchards, Groves, Vineyards, Nurseries,
and Ornamental Horticultural Areas; and Confined
Feeding Operations as the principal DDrr.. VVyysshhaallii,, DDeepptt..ooff CCiivviill EEnngggg.. KKSSSSEE MMcomponents. 2255
26.
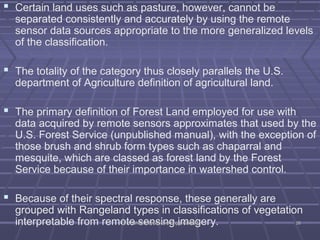
Certain landuses such as pasture, however, cannot be
separated consistently and accurately by using the remote
sensor data sources appropriate to the more generalized levels
of the classification.
The totality of the category thus closely parallels the U.S.
department of Agriculture definition of agricultural land.
The primary definition of Forest Land employed for use with
data acquired by remote sensors approximates that used by the
U.S. Forest Service (unpublished manual), with the exception of
those brush and shrub form types such as chaparral and
mesquite, which are classed as forest land by the Forest
Service because of their importance in watershed control.
Because of their spectral response, these generally are
grouped with Rangeland types in classifications of vegetation
interpretable from remote DDrr.. VVyyss hhsaallii,,e DDeenpptt..sooff iCCniivviillg EEnn ggiggm.. KKSSSSaEEMMgery. 2266
27.
Table 1 presentsa general summary of land use compiled
every 5 years by the Economic Research Service of the U.S.
Department of Agriculture and supplemented from other
sources.
These statistics, which are available only for States, are
provided by the various government agencies which compile
information on some categories of land use, several of which
parallel the U.S.G.S.. land use classification
system.
DDrr.. VVyysshhaallii,, DDeepptt..ooff CCiivviill EEnngggg.. KKSSSSEEMM 2277
28.
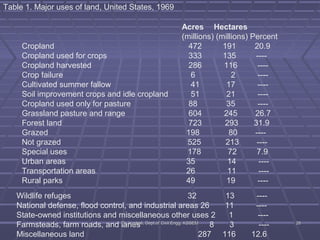
Table 1. Majoruses of land, United States, 1969
Acres Hectares
(millions) (millions) Percent
Cropland 472 191 20.9
Cropland used for crops 333 135 ----
Cropland harvested 286 116 ----
Crop failure 6 2 ----
Cultivated summer fallow 41 17 ----
Soil improvement crops and idle cropland 51 21 ----
Cropland used only for pasture 88 35 ----
Grassland pasture and range 604 245 26.7
Forest land 723 293 31.9
Grazed 198 80 ----
Not grazed 525 213 ----
Special uses 178 72 7.9
Urban areas 35 14 ----
Transportation areas 26 11 ----
Rural parks 49 19 ----
Wildlife refuges 32 13 ----
National defense, flood control, and industrial areas 26 11 ----
State-owned institutions and miscellaneous other uses 2 1 ----
Farmsteads, farm roads, and lanes 8 3 ----
Miscellaneous land 287 116 12.6
DDrr.. VVyysshhaallii,, DDeepptt..ooff CCiivviill EEnngggg.. KKSSSSEEMM 2288
29.
The landuse and land cover classification system
presented in this report (table 2) includes only the more
generalized first and second levels.
The system satisfies the three major attributes of the
classification process as outlined by Grigg (1965):
(1) it gives names to categories by simply using
accepted terminology;
(2) it enables information to be transmitted; and
(3) it allows inductive generalizations to be made.
DDrr.. VVyysshhaallii,, DDeepptt..ooff CCiivviill EEnngggg.. KKSSSSEEMM 2299