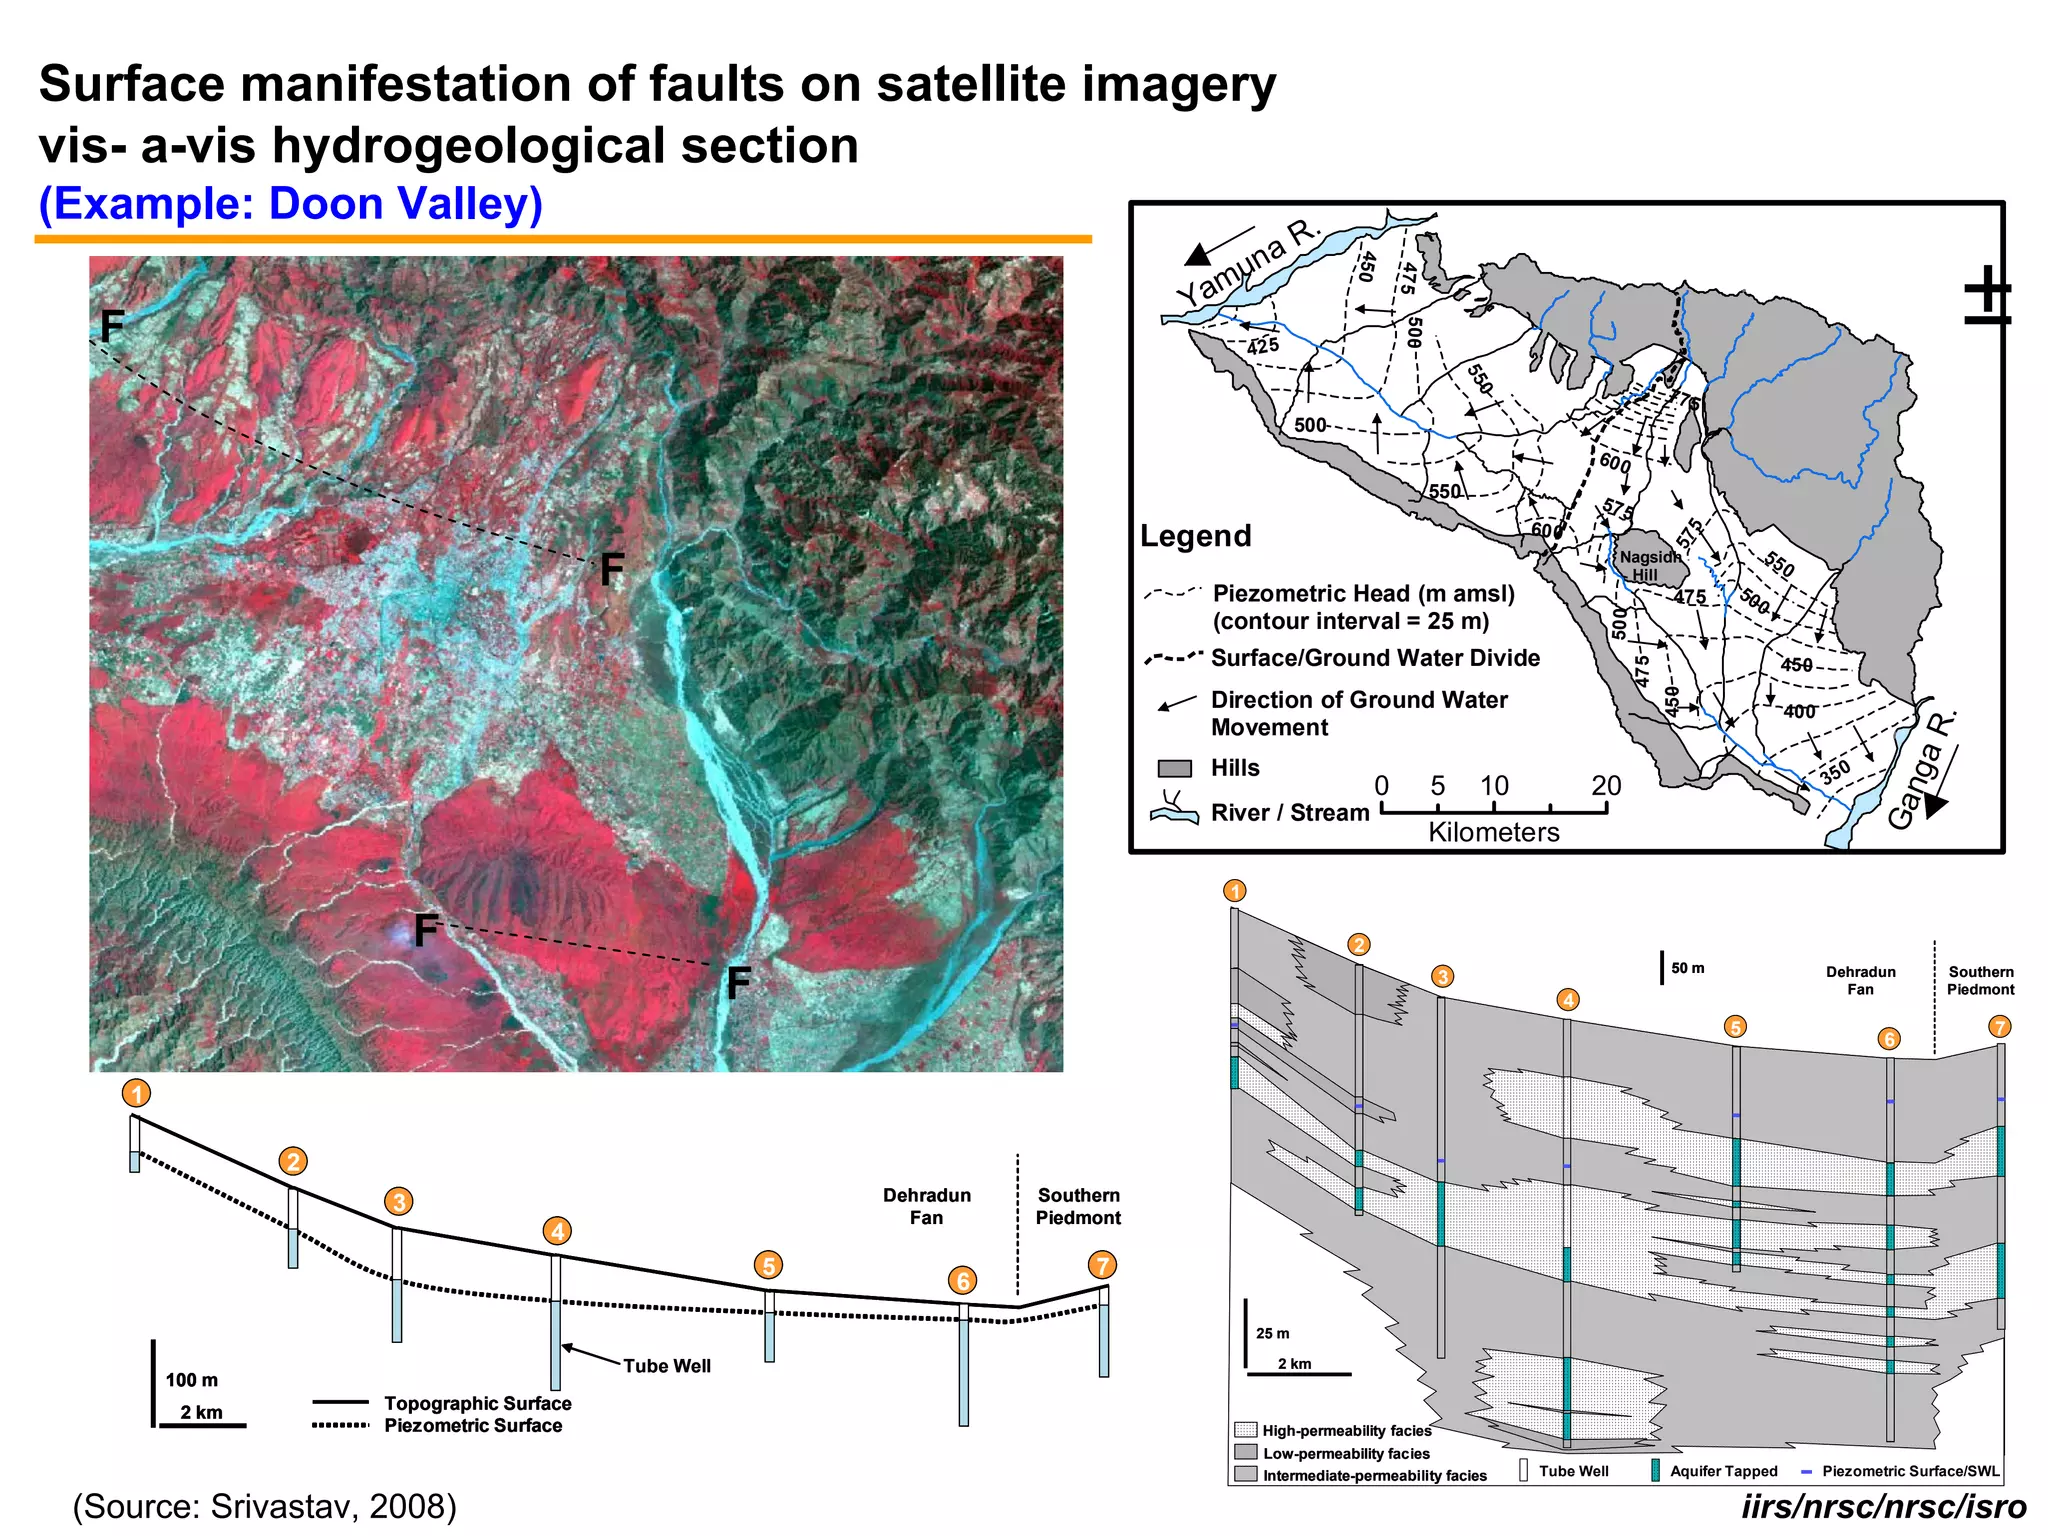
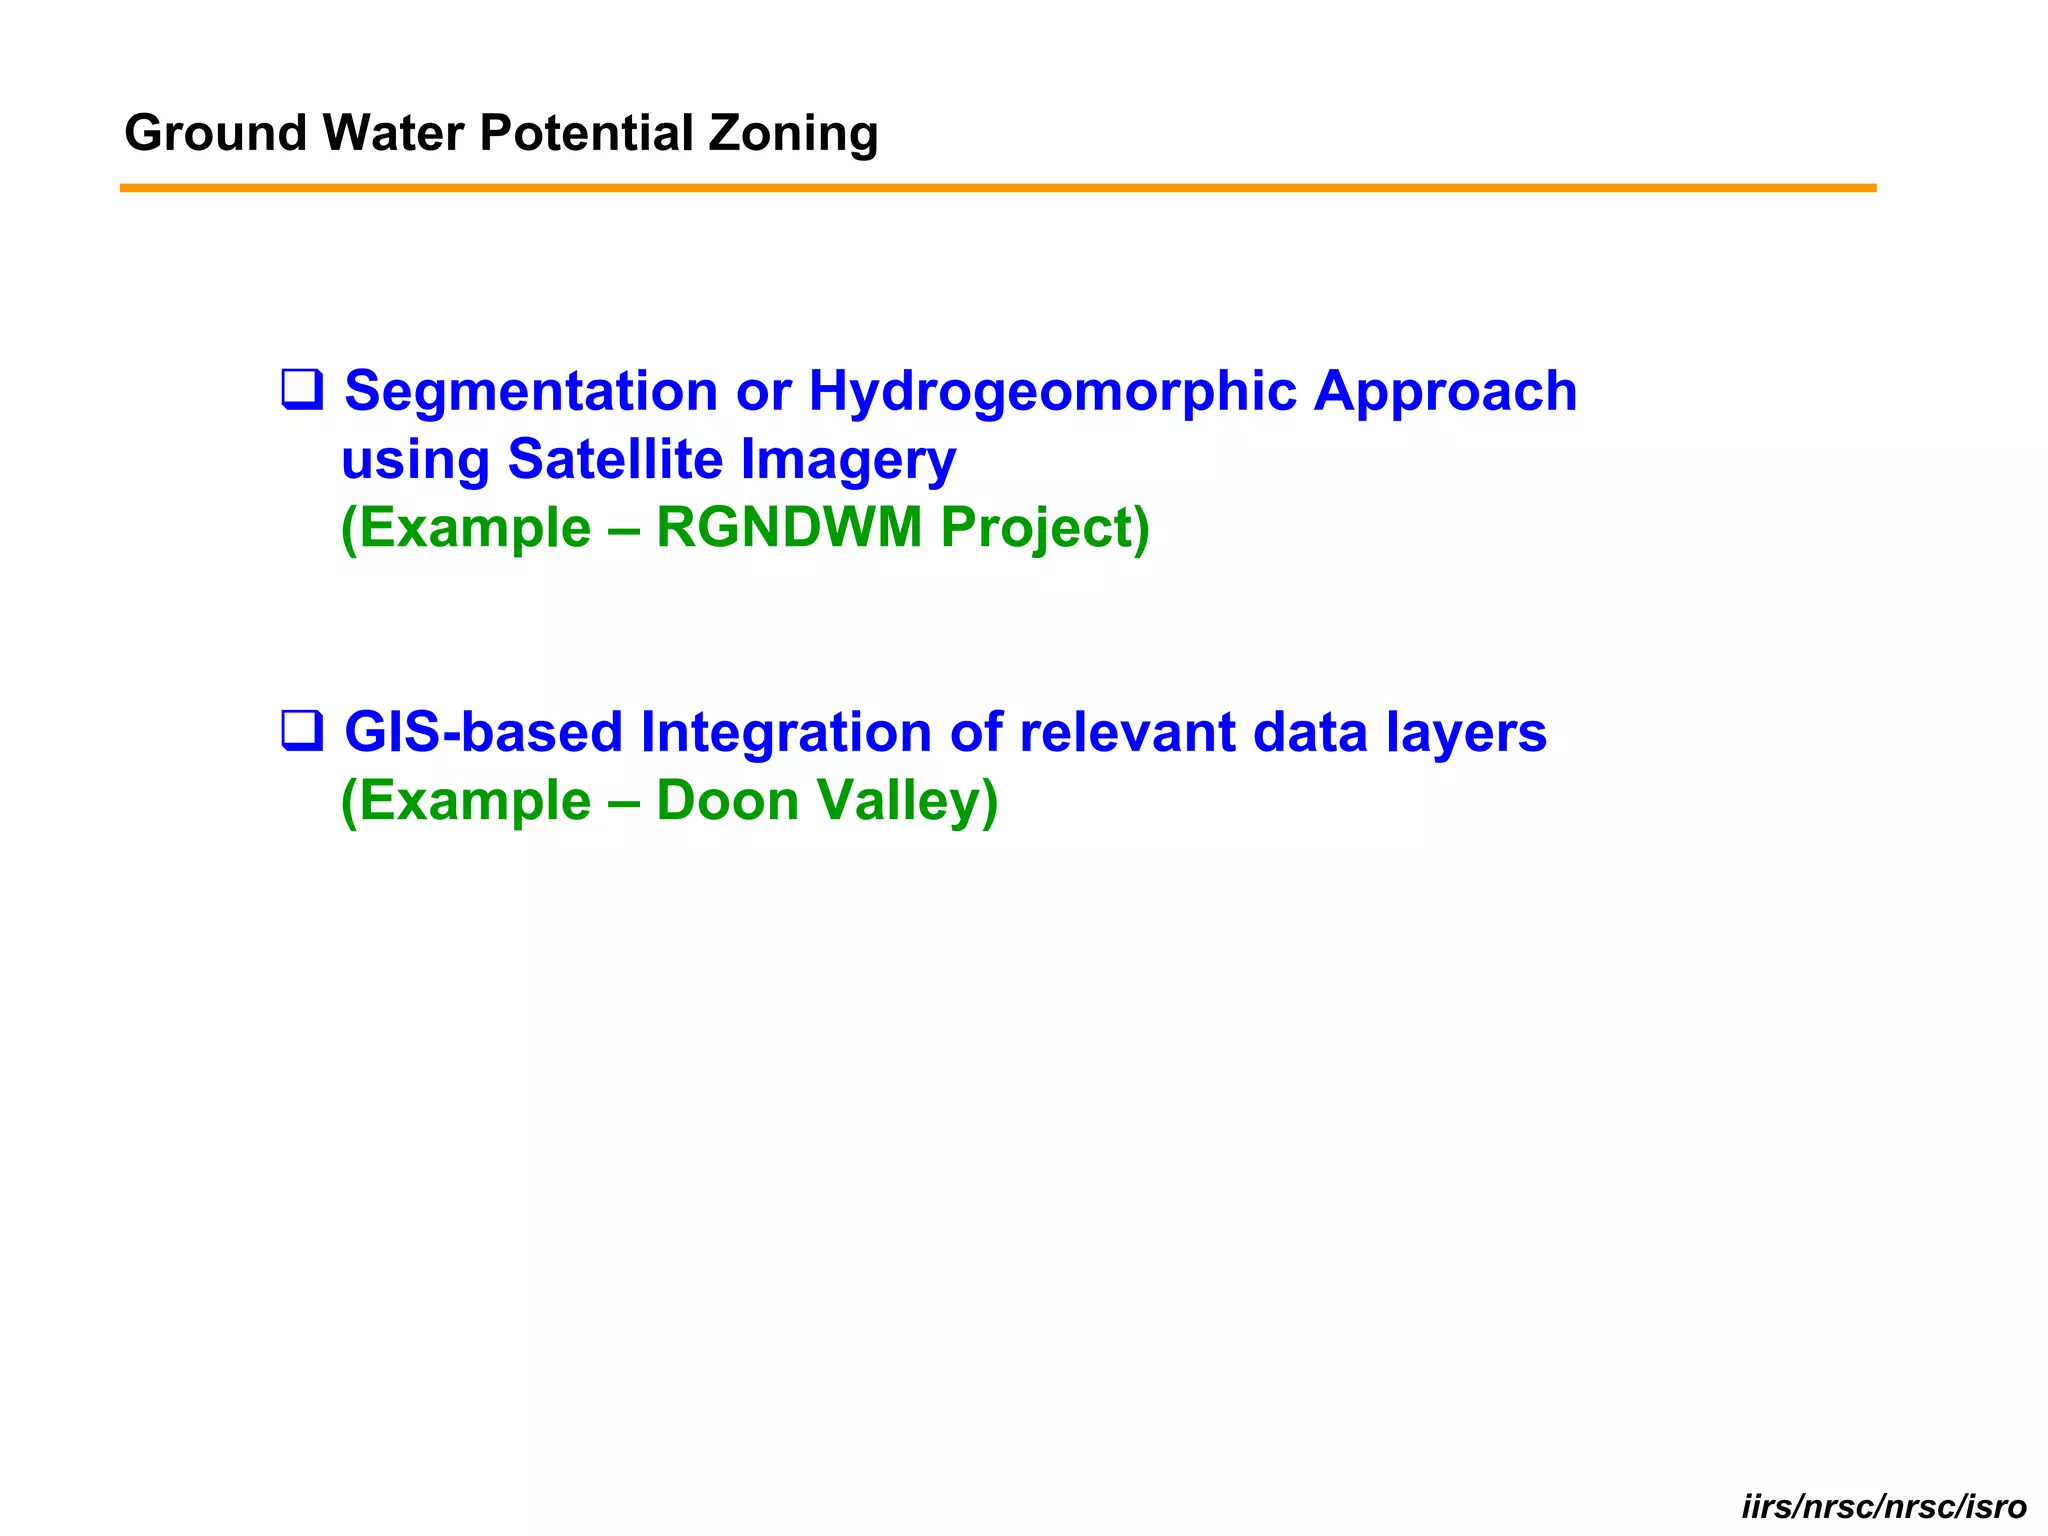
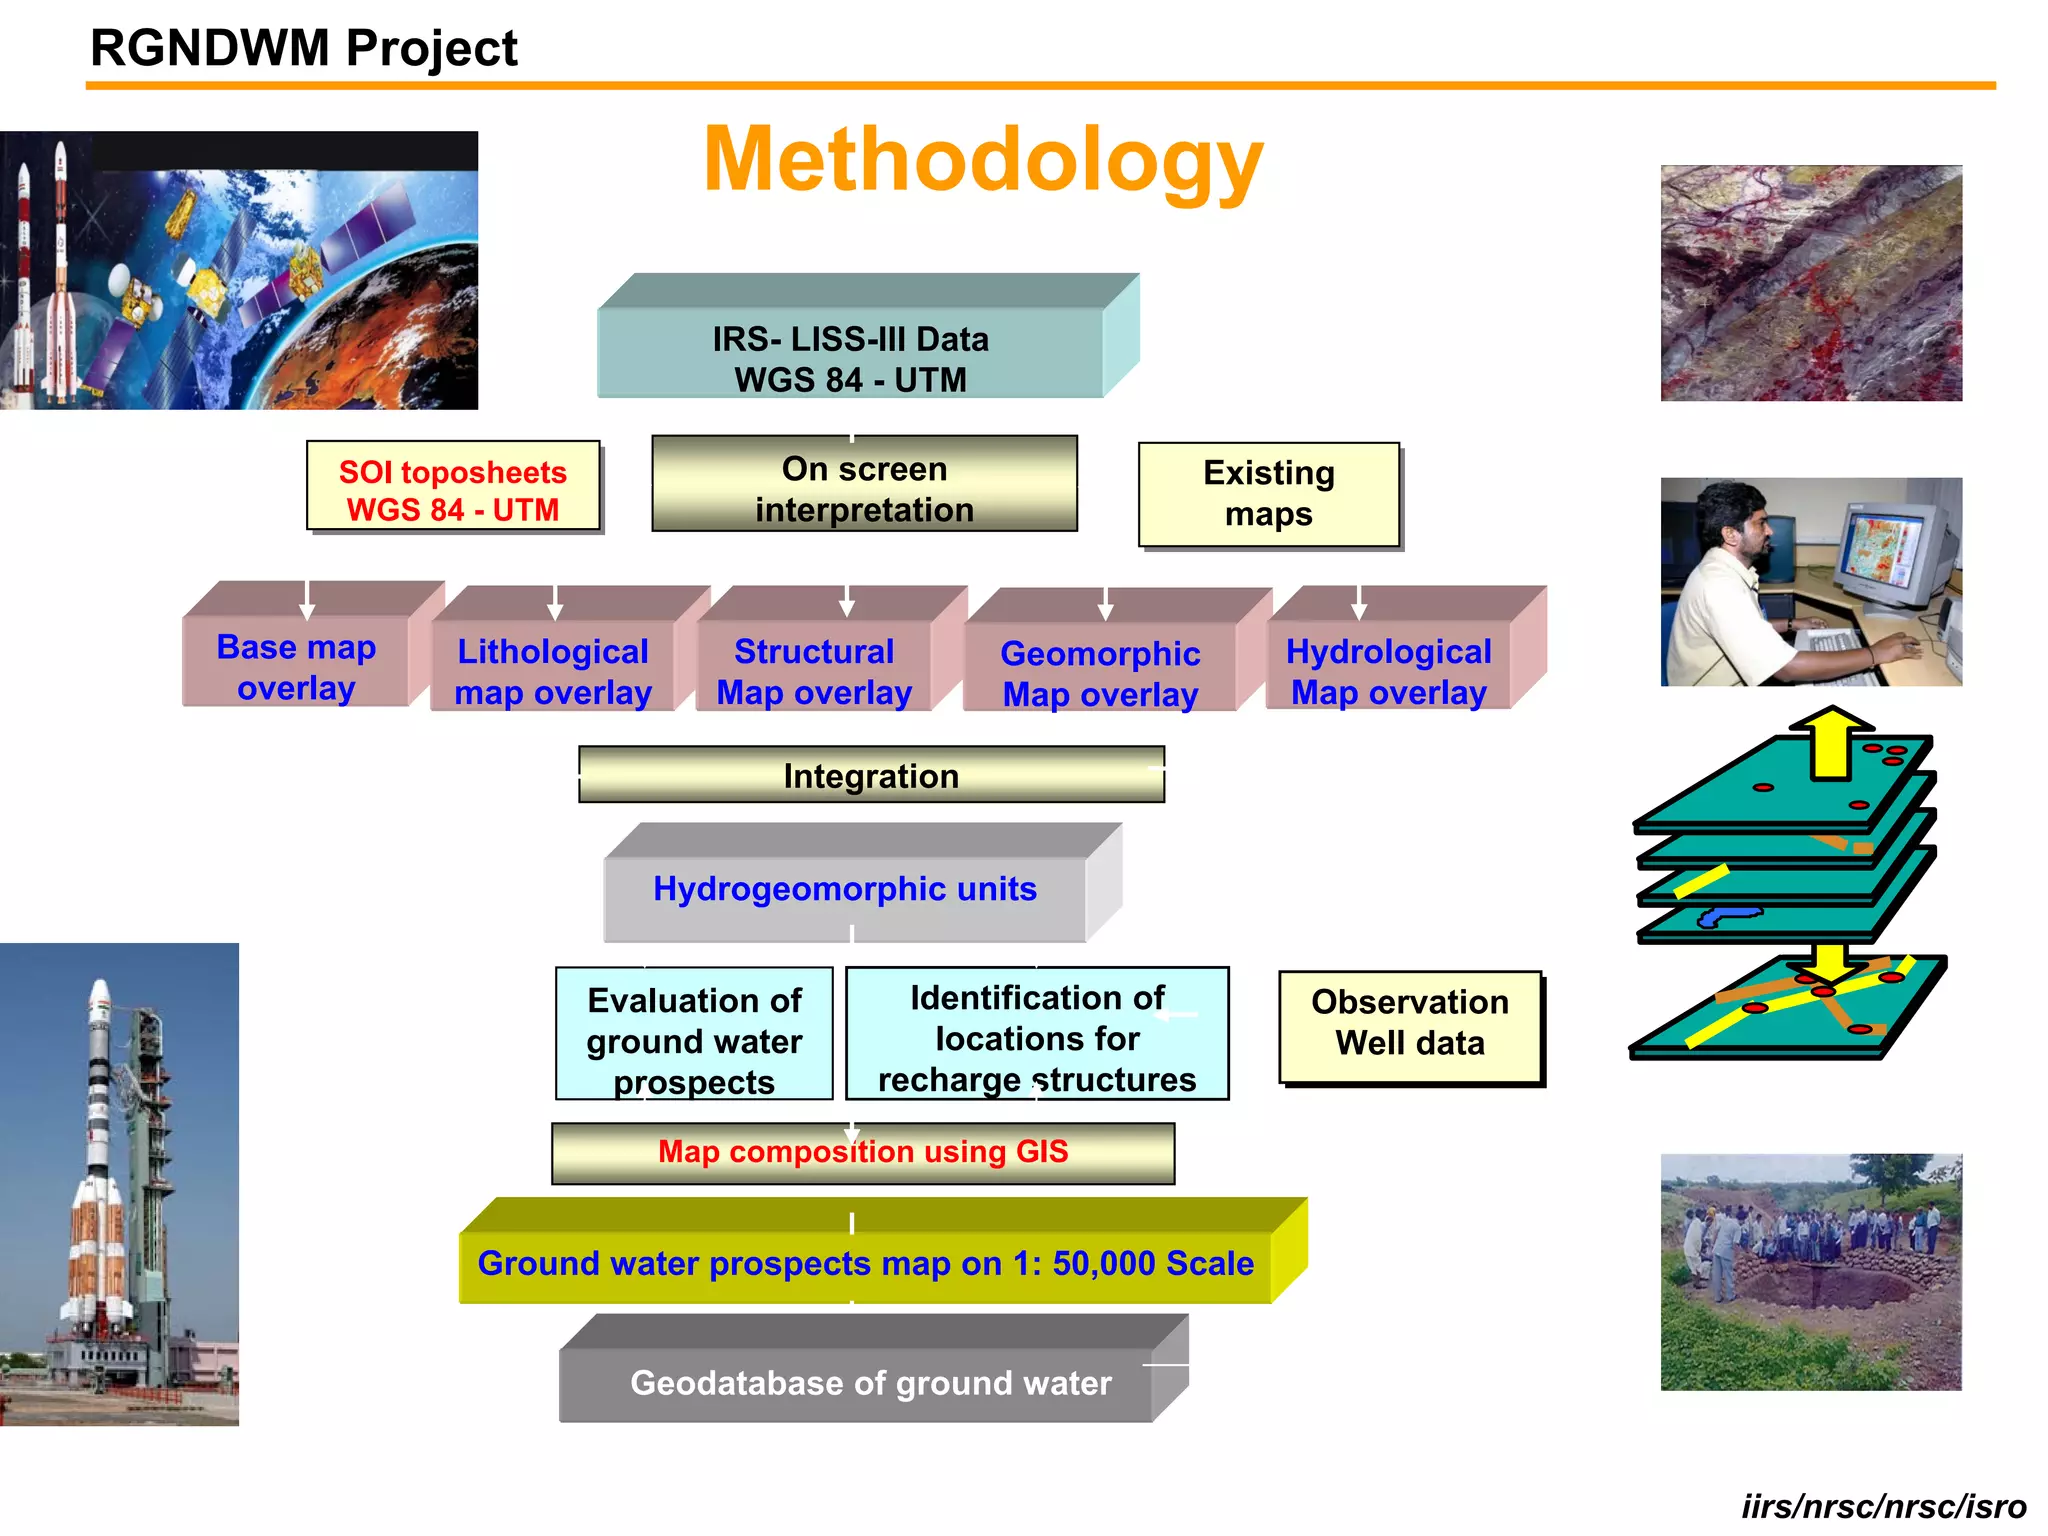
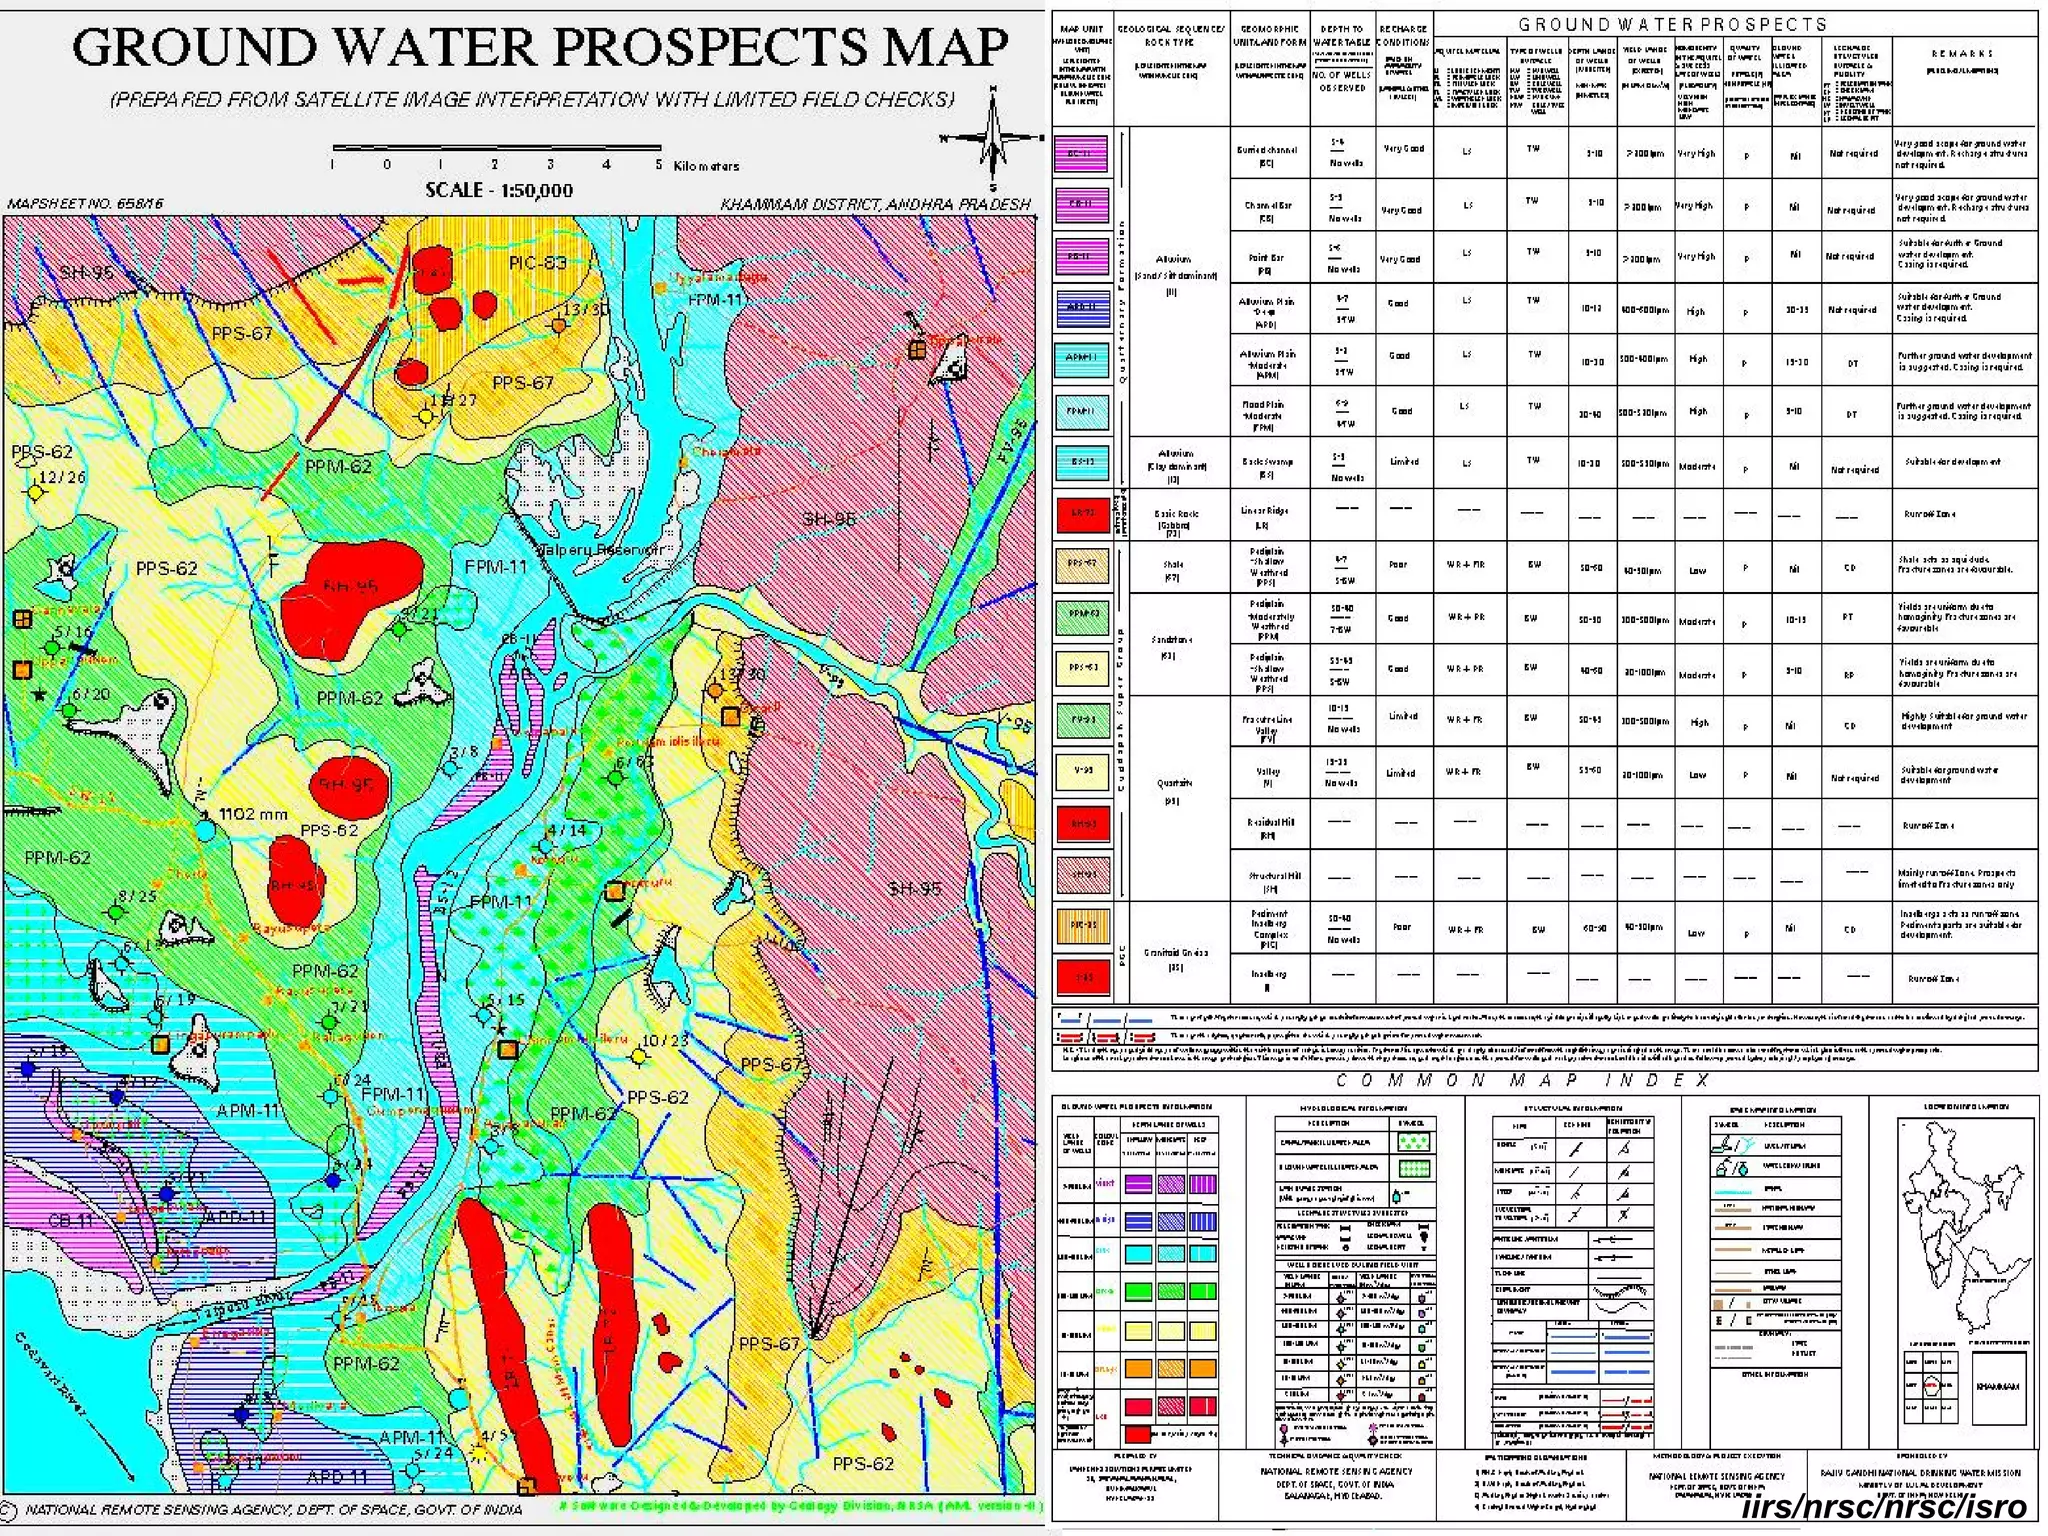
Role of Remote Sensing & GIS in
     Ground Water Studies
Potentials, Constraints and Case Studies


                Dr. S.K. Srivastav

     Indian Institute of Remote Sensing
        (National Remote Sensing Centre)
       ISRO, Dept. of Space, Govt. of India
                   Dehra Dun

          e-mail: sksrivastav@iirs.gov.in
Background


 RS data provide only the surface or near-surface information; therefore, a link must
 be established between the surface observation and the subsurface (groundwater)
 phenomena (Jackson, 2002).


 Of all the hydrological applications of remote sensing, the hydrogeological analysis is
 one of the most difficult tasks (Farnsworth et al., 1984).


 However, the spatially complete and temporal nature of the RS data provide excellent
 opportunities to hydrogeologists for improving the understanding of the hydro-
 geological system, especially in remote and unexplored areas (Hoffmann and Sander,
 2007).


 Since RS data have limitations with regard to depth penetration, the best approach is
 to integrate the airborne, space-borne and ground-based remote sensing techniques
 with field measurements (Meijerink et al., 2007).


 The RS data are most useful when they are combined with GIS and numerical
 modelling (Becker, 2006).
                                                                           iirs/nrsc/nrsc/isro
Potentials and constraints

VIS-NIR-SWIR Region

    Mapping of surface features of hydrogeological relevance (or g.w. indicators)
    for understanding the controls of ground water occurrence and movement .
    These include – lithologies, structures, geomorphology, drainage patterns,
    land use / land cover and soil moisture.
       The amount of information which can be extracted from RS data depends on many
       factors – type of data including spatial and spectral resolutions, scale of image,
       date of acquisition of the image, type and knowledge of terrain, experience/ skill
       of the interpreter, etc.


    Mapping and monitoring the spatial distribution of ground water exfiltration (effluent
    streams) and infiltration (influent streams) zones.
       However, quantifying the magnitude of flux from space is still a major challenge


    Moist soils, swampy/waterlogged zones and vegetation (in dry climate) indicate
    ground water occurrence at shallow depth.
       However, quantification of soil moisture not possible. Further, in humid areas,
       the relation between g.w. and vegetation is complex and does not readily indicate
       g.w. occurrence.
                                                                                iirs/nrsc/nrsc/isro
DEMs generated using stereo images can be used to map the topographic attributes
of the terrain.


Spatial distribution and quantification of the magnitude of actual evapotranspiration rates
(i.e. g.w. discharge by natural process and net draft for irrigation in g.w. irrigated areas)
along with TIR and meteorological data.

     Absolute values estimated using SEBAL technique are often overestimated,
     however, the strength of RS data lies in providing the spatial patterns of g.w. use.


Salt crusts provide an indication of high water table and also throw light on
g.w. quality.


                                                                              iirs/nrsc/nrsc/isro
Thermal Region

   Mapping moist soils and shallow water table areas.
     However, quantitative and temporal measurements of soil moisture are difficult.


   Mapping discharge of ground water into rivers, lakes and sea.
     Possibility of detection of such ground water discharges depends on temperature
     contrast and quantum of g.w. discharge. Quantification of g.w. discharge also
     not possible.


   Quantifying the spatial distribution of actual evapotranspiration rates in
   conjunction with VIS-NIR-SWIR and meteorological data.


   High resolution thermal images useful for mapping geothermal vents,
   hot springs, finding relation between distribution of hot springs and
   lineaments.

                                                                        iirs/nrsc/nrsc/isro
Microwave Region


   Most suitable for mapping spatial distribution and temporal dynamics of soil moisture.
       Present configuration of microwave sensors provides soil moisture information
       restricted to 0–2 cm, and to areas free of dense vegetation cover. Coarse spatial
       resolution of the order of few kilometers is another major constraint.


   Detection of buried channels and palaeo-drainage up to certain depth (~ 2 m).
       Limited to only in hyper-arid conditions and in absence of surface cover.


   Generation of high-resolution digital elevation models (DEMs) using SAR
   data with a technique called radar or SAR interferometry (InSAR).
       Provides digital surface model (DSM) rather than digital terrain model (DTM).
       Height accuracy is of the order of few meters, therefore, elevations can not be
       directly used in quantitative g.w. flow modelling studies.


                                                                            iirs/nrsc/nrsc/isro
Subtle changes in land surface elevation due to ground water withdrawal
or recharge from/to the aquifers in unconsolidated sediments can be
detected using a technique called differential radar interferometry (D-InSAR).
    The limitations include – (1) low availability of suitable InSAR images;
    and (2) Temporal decorrelation of radar signal due to change in
    land cover and atmospheric conditions.


Measuring surface water elevation using Radar altimetry at sub-meter
accuracy.
    However, the coarse spatial resolution limits its applicability only to large lakes
    and wetland systems.


                                                                            iirs/nrsc/nrsc/isro
GRACE – A special satellite mission for quantifying seasonal and
inter-annual variations in terrestrial water storage

   GRACE – Gravity Recovery and Climate Experiment (launched by NASA & DLR
   in 2002)

   Principle - Spatio-temporal changes in mass distribution causes perturbations in the
   orbits of twin satellites, separated by about 220 km, inducing change in the relative
   distance between two satellites, which is used to map the gravity field.


    Accuracy estimates for interannual and seasonal water storage variations are of the
    order of 9 mm (at 1300 km resolution) and 10–15 mm (for area >2 million km2)
    water equivalent, respectively (Guntner et al., 2007).

         For estimating ground water recharge, storage changes due to other components
         of terrestrial water storage such as snow, surface water (rivers, lakes and wetlands),
         soil moisture, and biomass are separated using auxiliary observations and
         numerical models .

         Coarse resolution limits its applicability to study ground water dynamics at basin/
         continental/ global scale (>900,000 km2 )


                                                                                 iirs/nrsc/nrsc/isro
RS & GIS applications in ground water


    Mapping of prospective ground water zones,


    Ground water quality zonation including finding zones vulnerable to
    pollution,


    Site selection for artificial ground water recharge structures,


    Inputs in ground water budgeting,


    Upscaling of aquifer related parameters/ recharge rate,


    Ground water information management, etc.

                                                                      iirs/nrsc/nrsc/isro
Infiltration Vs. Exfiltration Zones
(Examples: Doon Valley & Indo-Gangetic Plain


                                               iirs/nrsc/nrsc/isro
A few conspicuous landforms
(Example: part of Spiti Valley)
                                    Ground photo


                 IRS LISS-3 Image


                                    Ground photo


iirs/nrsc/nrsc/isro
G.W. carriers and barriers
(Examples: S. India)


                             iirs/nrsc/nrsc/isro
Surface manifestation of faults on satellite imagery
vis- a-vis hydrogeological section
(Example: Doon Valley)
                                                                                                      R.
                                                                                            na


                                                                                                              45 0
                                                                                          mu
                                                                                                                                                                                                          ±


                                                                                                                     47 5
                                                                                        Ya
  F


                                                                                                                      500
                                                                                              42 5


                                                                                                                                  55
                                                                                                                                                                  77 5


                                                                                                                                     0
                                                                                                      500
                                                                                                                                                    60 0
                                                                                                                            550
                                                                                                                                                    57 5
                                                                                                                                         60 0
                                                                                      Legend


                                                                                                                                                                      5
                                                                                                                                                                   57
                                                                                                                                                       Nagsidh                55
                                            F                                            Piezometric Head (m amsl)
                                                                                                                                                        Hill
                                                                                                                                                                   475    50
                                                                                                                                                                                 0
                                                                                                                                                                             0


                                                                                                                                                      500
                                                                                         (contour interval = 25 m)
                                                                                         Surface/Ground Water Divide


                                                                                                                                                            475
                                                                                                                                                                                   450


                                                                                                                                                                  450
                                                                                         Direction of Ground Water                                                                 400


                                                                                                                                                                                                       .
                                                                                         Movement


                                                                                                                                                                                                    aR
                                                                                         Hills                                                                                              0


                                                                                                                                                                                                   ng
                                                                                                                 0          5       10              20                                   35


                                                                                                                                                                                                Ga
                                                                                         River / Stream
                                                                                                                            Kilometers

                                                                                          1

                          F                                                                                  2
                                                                                                                                                                   50 m                  Dehradun        Southern
                                                        F                                                                   3
                                                                                                                                                4
                                                                                                                                                                                           Fan           Piedmont

                                                                                                                                                                          5                                    7
                                                                                                                                                                                                6

      1

                  2
                                                                Dehradun   Southern
                      3
                                                                  Fan      Piedmont
                                      4
                                                            5                   7
                                                                      6
                                                                                               25 m

                                            Tube Well                                              2 km
          100 m
                      Topographic Surface
           2 km
                      Piezometric Surface                                                        High-permeability facies
                                                                                                 Low-permeability facies
                                                                                                 Intermediate-permeability facies         Tube Well               Aquifer Tapped         Piezometric Surface/SWL

 (Source: Srivastav, 2008)                                                                                                                                                 iirs/nrsc/nrsc/isro
Case Studies
Ground Water Potential Zoning


        Segmentation or Hydrogeomorphic Approach
        using Satellite Imagery
        (Example – RGNDWM Project)


        GIS-based Integration of relevant data layers
        (Example – Doon Valley)


                                                        iirs/nrsc/nrsc/isro
RGNDWM Project

                                 Methodology
                                  IRS- LISS-III Data
                                    WGS 84 - UTM

          SOI toposheets
          SOI toposheets               On screen                     Existing
                                                                     Existing
          WGS 84 -- UTM
           WGS 84 UTM                interpretation                   maps
                                                                      maps


    Base map    Lithological       Structural          Geomorphic        Hydrological
     overlay    map overlay       Map overlay          Map overlay       Map overlay

                                      Integration


                               Hydrogeomorphic units


                           Evaluation of      Identification of            Observation
                                                                           Observation
                           ground water         locations for               Well data
                                                                            Well data
                            prospects       recharge structures

                               Map composition using GIS


                  Ground water prospects map on 1: 50,000 Scale


                             Geodatabase of ground water


                                                                          National Remote Sensing Agency
                                                                                             iirs/nrsc/nrsc/isro
iirs/nrsc/nrsc/isro
RGNDWM Project


  Details of Map Legend:
  Lithological, Geomorphological, structural, Hydrological &
  base information along with ..
           1.    DEPTH TO WATER TABLE
           2.    RECHARGE CONDITIONS
           3.    NATURE OF AQUIFER MATERIAL
           4.    TYPE OF WELLS SUITABLE
           5.    DEPTH RANGE OF WELLS
           6.    YIELD RANGE OF WELLS
           7.    SUCCESS RATE OF WELLS
           8.    QUALITY OF WATER
           9.    STATUS OF GROUND WATER EXPLOITATION
           10. TYPE OF RECHARGE STRUCTURES SUITABLE
           11. PRIORITIZATION OF AREAS FOR RECHARGE
               STRUCTURES
           12. REMARKS / PROBLEMS / LIMITATIONS
                                                       iirs/nrsc/nrsc/isro
RGNDWM Project
                         States covered

                                 Phase-I
                                   Andhra Pradesh (part)   247
                                   Karnataka               267
                                   Kerala                  67
                                   Madhya Pradesh          458
                                   Chhattisgarh            202
                                   Rajasthan               413


                 Phase-II
                   Jharkhand          129
                   Himachal Pradesh   91
                   Gujarat            210
                   Orissa             220


Total Sheets Covered = 2304
                                                                 iirs/nrsc/nrsc/isro
RGNDWM Project

                             Work in progress (Phase-III)


                                           Phase        Coverage         No. of         Schedule /
                                                                         Maps             Status
                                           I            6 States         1654           Completed
                                           II           4 States          650           Completed
                                           III   A      6 States         1290           In progress
                                                                                      (Sept 07- Sept 09)

                                                 B      4 States          339         Recently Launched
                                                                                      (June 08 – June 10)


Phase-III A                                      Phase-III B
 Sl. No.   State                 No. of Maps         Sl. No.   State                        No. of Maps
   1       AP (part)                204
                                                       1       Arunachal Pradesh                  120
   2       Assam                    103
   3       Jammu & Kashmir          360                2       Haryana                             73

   4       Maharashtra              455                3       Uttar Pradesh (part)                88
   5       Punjab                    82                4       West Bengal (part)                  58
   6       Uttarakhand               86
                                                               Total                              339
           Total                    1290

                                                                                             iirs/nrsc/nrsc/isro
RGNDWM Project

   A sample map (53J/4) of Uttarakhand (Phase-III)


                                                 iirs/nrsc/nrsc/isro
RGNDWM Project


                 iirs/nrsc/nrsc/isro
RGNDWM Project


Feedback on the use of Ground Water Prospects Maps by State Govts.
                                                upto October 2008
       State             No. of    Success         No. of Recharge
                         wells       rate             Structures
                         Drilled              Planned       Constructed
       Andhra- Pradesh   43827       93%         478          478


       Chhattisgarh      33413      92.5%       1155          327

       Karnataka          47951      95%        2641          2589

       Kerala             7730      92%          65            8

       Madhya Pradesh    22006       90%        5190          3361

       Rajasthan         98994     85 – 95%     320           320

       Gujarat           12014     94.3 %       470            29
       Orissa             292       92%          Nil           Nil


       Total             266227                10319           7112
                                                                          iirs/nrsc/nrsc/isro
GIS-based Integration
(Example: Doon Valley, Uttarakhand)
                        R. 4                                                                                                                      Intermontane Valley Part
                     na
                                                                                                        ±
                Ya
                  mu
                           Vikasnagar

                           As                             2a
                                                                      Mussoorie                                                                                        ±
                             an
                                  R. Sahaspur


                                                     y
                                                  lle
                                                Va
                                                                                       2b


                                            on
                                          Do
                                                         Dehra
                                                         Dun                                                 Legend
                                    1
                                                                                                                   Sw             GW
                                                                                        MB                                        Prospects
                                                                                          T
                    MBT                                                                                            0.10 - 0.39    Poor
                    Litho/Geom boundary                                                                            0.39 - 0.58    Poor to Moderate


                                                                                   ey
                    Water Divide
                                                                   Doiwala


                                                                               all
                                                                                                                   0.58 - 0.68    Moderate to Good


                                                                              V
                    Road


                                                                           on
                    Rail                                                                                           0.68 - 0.81    Good to V. Good


                                                                         Do
                    District boundary
                                                                             So             Rishikesh              0.81 - 1.0     V. Good to Excellent
                    River/stream                                               ng


                                                                                                        R.
                    Settlement                                                    R.                               Hill/Scarp zone
                                                                                                                                                         0   5    10


                                                                                                        a
                                                                                                     ng
                                                                                                  3                Lineament (Thrust/Fault/Fracture)     Kilometers


                                                                                                   Ga
                                                             (d)                                             (b)


  Ya
    mu
      na
           R.
                                                                                                  ±                                                  Hilly/Mountainous Part


                                                                                                                                                                       ±
                                                    Dehra Dun                                                 Legend
                                                                                                                                    GW
                                                                                                                     Sw             Pros-
                                                                                                                                    pects
                                                                                                                     0.1 - 0.2       V. Low
                                                                                                                     0.2 - 0.32      Low                                      (Source: Srivastav, 2008)
                                                                                                                     0.32 - 0.45     Low to Moderate
                                                                                                                     0.45 - 0.61     Moderate to Good
                                                                                                                     0.61 - 0.95     Good to V. Good
                                                                                                        R.


                   0               10              20
                                                                                                                                    0         5      10
                                                                                                      a
                                                                                                   ng
                                                                                                 Ga


                          Kilometers                                                                                                     Kilometers
                                                                                                                                                                                    iirs/nrsc/nrsc/isro
Data Layers (hill / mountainous part)


   (a) lithology; (b) lineament density; (c) dip-direction and slope-aspect relation; (d) relief; (e) curvature; (f) plan curvature;
   (g) profile curvature; (h) slope; (i) log of specific catchment area; (j) topographic wetness index.

(Source: Srivastav, 2008)                                                                                              iirs/nrsc/nrsc/isro
Data Layers (valley part)


   (a) geomorphology; (b) lithology; (c) depth to potentiometric surface; (d) distance to aquifer boundary; (e) distance to
   perennial stream; (f) distance to valley axis; (g) slope; (h) drainage density; and (i) recharge source.
(Source: Srivastav, 2008)                                                                                        iirs/nrsc/nrsc/isro
D-InSAR technique for detecting land subsidence due to
ground water withdrawal
(Example: Kolkata city)


                                                      GW2                                                                                 GW2
                                                      3         0.0                                                                       3

                                                          1.0                                                                                    0.0
                                                                                                                                          2.5
                                         L1                                                                                         5.0
                                                    3.0         GW2                                                    L1                              GW2
                                              4.0               4                                                                                      4
                                                           L3                                                                                   L3
                                                                                                                         L2
                                        L2


                              Average subsidence                                                               Average subsidence
                               rate = ~5mm/year                                                                rate = ~6.5mm/year
                                     (Max.)                                                                           (Max.)


                        L1 : Machhua Bazar                  .
                                                            . GW23 and GW24: Piezometric pressure observation
                        L2 : Calcutta University                   1.0
                                                                points
                        L3 : Rajabazar Science College                   Subsidence contour with figures in mm/year

              Estimated rate of subsidence during 1992–98 = 5 – 6.5 mm/y
IHS colour composition of the interferograms showing subsidence fringes in Kolkata City during the
1990s due to ground water withdrawal
(Source: Chatterjee et al., 2007)                                                                                                    iirs/nrsc/nrsc/isro
1. Rat-hole type coal mines and AMD
                               Study under M.Sc. Geohazards Research
                                                      (Blahwar, 2010)

• Coal is extracted by an
  artisanal method of mining
  called as “rat-hole”
  mining.

• Carried out by individuals
  and highly unorganized.

• From literature: Water
  bodies polluted with acid
  mine drainage (AMD).
“To identify and map the rat-hole type coal mines (Visual Interpret.)”


  CARTOSAT-1 PAN and RESOURCESAT-1 LISS-4 merged FCC depicting rat-hole
  type coal mines and other landscape features.
“To determine the presence & hydro-chemical
 characteristics of AMD”

                      Sampling locations


Monsoon
14 – water samples; 4 additional – pH, EC, T; 8 – stream sediments
Non-monsoon
30 – water samples; 12 additional – pH, EC, T; 22 – stream sediments
Mines as source of AMD?


                          X-axis stream provenance

                          S = Sedimentary rock
                          M = Metamorphic rock
                          S+M = Mixed sedimentary
                               and metamorphic
Geospatial analysis of fluoride incidence in ground water
(Example: part of Raigarh Dist., Chhattisgarh)


                                                                               N

                                         Konpara                        W           E
                                   #%          %

                                   Kathrapalli      Salehapara
                                                          %
                                         %
                                         #                    Raikera
                                                                #%
                                                                               S


                                        Nundaraha
                                            %
                       #       #
                           #
                       Auraimura               kerakhol
                                                     %
                           %
                               #

                   Charbhanta
                       #   %             #
                                        Banai      Chirmura       Bajarmura
                                         # % %                         %
           Gharghoda                                       Dholnara
               %                          Bhalumuda# #%      ##
                                                             ##%
                                                                       Karuwahi
                                                                            %
                                               Kolam                         #
                      Jhankhadarha Barkaspalli #%# # % Rodopalli
                                      ##         #
                                                   #
               #            %           %                    Muragaon
         Bhendra Jhariapalli Patrapalli# Chitwahi %              #% # Saraitola
                                                                 #
           #%
    Baihamura                                                         ## %
                                                                       #
                         #
                         %       #%                              ##    #
                                                                       #
     %                                #       #Dolesara
                                              # %#
   #         #                                           # % Pata
                                                         #
                                      Mahuapalli #       # #%
                                                                           Gare
                                           %                  #
                                                              #              %
                   #
                Ukrapalli       ##
                              Devgarh           Pata Bandhap# #                 LEGEND
                   # %           %                               #
                                                                 # % Kunjhemura
                                                   Regaon         #
                                    Jerekela          %
                                                                        #       % Village location
        Bhalumara                      #% %
                                         # Murhinar %   Manjhapara #
             #
             %                                                                  # Pre-monsoon sampling   wells
     Amlidih Chhaiadoria Kachkoba
                 %
         %     #                          %                                 Paved road
       #                                  #
                                          #
                                                    Basanpalli
                                                         #%                 Unpaved road
                                        ##
                                         Tamnar
                                           %
              Parkipahri
                 # Jhindolpara Amaghat
                  %
                                  #% Gorhi
                   #           ##
                                % #                      %


(Source: Beg, 2009)


                                                                                                                 iirs/nrsc/nrsc/isro
Health Risk and Population at Risk


Pre-monsoon


Post-monsoon
                                    Pre- and post-monsoon combined

                  (Source: Beg, 2009)
                                                              iirs/nrsc/nrsc/isro
Ground water quality zonation using GIS
(Example: part of Nalgonda Dist., A.P.)


 (Source: Kumar and Anjaneyulu, 2003)     iirs/nrsc/nrsc/isro
(Source: Kumar and Anjaneyulu, 2003)   iirs/nrsc/nrsc/isro
Ground water pollution potential zoning
(Example: Solani watershed, Uttarakhand & U.P.)


Method: DRASTIC Model (Aller et al., 1987)

  DI = DwDr + RwRr + AwAr + SwSr + TwTr + IwIr + CwCr   (1)

      where DI is the Drastic Index, and w and r represent
      weights and ratings, respectively.

       D - Depth to ground water
       R - Recharge rate
       A - Aquifer media
       S - Soil Media
       T - Topography
       I - Impact of Vadose Zone
       C - Hydraulic conductivity of aquifer

   Higher the DRASTIC index, greater the relative pollution potential.
                                                               iirs/nrsc/nrsc/isro
77°45'0"E                      77°50'0"E                                77°55'0"E                                    78°0'0"E                   78°5'0"E                                       77°45'0"E         77°50'0"E        77°55'0"E                78°0'0"E                78°5'0"E


                                      DEPTH TO WATER TABLE MAP                                                                                                                                                                        Rainfall Recharge Map
                                                                                                                                                                            ±                                                                                                                                 ±


                                                                                                                                                                                                                                                                                                                               30°15'0"N
                                                                                                                                                                                            30°15'0"N


                                                                                                                                                                                                        30°15'0"N
    30°15'0"N


                                                                                                                                                                                                                                                                                                                               30°10'0"N
                                                                                                                                                                                            30°10'0"N


                                                                                                                                                                                                        30°10'0"N
    30°10'0"N


                                                                         (
                                                                         !       (
                                                                                 !


                                                                                                                                                                                                                                                                                                                               30°5'0"N
                                                                                                                                                                                            30°5'0"N
                                                                     ((
                                                                     !!              ((
                                                                                     !!


                                                                                                                                                                                                        30°5'0"N
    30°5'0"N


                                           ((
                                           !!!
                                             (
                                                                                                         ((
                                                                                                         !!
                                                 (
                                                 !           (
                                                             !
                                       (
                                       !                 (
                                                         !                                                                    !!
                                                                                                                              ((
                                                                                                              (
                                                                                                              !
                             (
                             !                                                                       (
                                                                                                     !


                                                                                                                                                                                                                                                                                                                               30°0'0"N
                                  (
                                  !


                                                                                                                                                                                            30°0'0"N


                                                                                                                                                                                                        30°0'0"N
    30°0'0"N


                                                                                                     (
                                                                                                     !
                                  (
                                  !


                                                                                                                          (
                                                                                                                          !
                                                                                                !
                                                                                                (

                LEGEND                               (
                                                     !                                                                    (
                                                                                                                          !
                                                                 (
                                                                 !


                                                                                                                                                                                                                                                                                                                               29°55'0"N
                                                                             (
                                                                             !       (
                                                                                     !
                                                                                                                                                                                            29°55'0"N


                  (
                  !       Dug well
                                                                                                                                                                                                        29°55'0"N
                                                                                                                                                                  (
                                                                                                                                                                  !
    29°55'0"N


                                                                                                                                                              (
                                                                                                                                                              !
                                                                     (
                                                                     !                                                                         (
                                                                                                                                               !
                  (
                  !       Tube Well                                                                                   (
                                                                                                                      !            !
                                                                                                                                   (
                                                                                                                                                                                                                    LEGEND
                                                                                 (
                                                                                 !
                Depth to water table                                                                              (
                                                                                                                  !                                                                                                        <107 mm/yr
                          <5 m                                                           (
                                                                                         !                                                                                                                                 107 - 161mm/yr
                                                                                         ((
                                                                                         !!
                                                                                                                                       (
                                                                                                                                       !
                          5-10 m                                                                                                                                                                                           161 - 202 mm/yr


                                                                                                                                                                                                                                                                                                                               29°50'0"N
                                                                                                                                                                                            29°50'0"N


                                                                                                 (
                                                                                                 !
                                                                                                                                                                                                        29°50'0"N


                          10-15 m                                                              !
                                                                                               (                                                                                                                           202 - 239 mm/yr
    29°50'0"N


                                                                                                                                           (
                                                                                                                                           !
                          15-20 m                                                                                                                                                                                          239 - 361 mm/yr
                                                                                                                                                                                                                           Hilly Area                                                       Kilometers
                          >20 m                                                                                                                       Kilometers                                                                                                         0   2    4              8       12               16
                          Hilly Area                                                                              0           2            4               8          12               16

                                                                                                                                                                                                                          77°45'0"E         77°50'0"E        77°55'0"E                 78°0'0"E                78°5'0"E
                           77°45'0"E                         77°50'0"E                               77°55'0"E                                     78°0'0"E                 78°5'0"E


(Source: Than Zaw, 2008)                                                                                                                                                                                                                                                                      iirs/nrsc/nrsc/isro
77°45'0"E           77°50'0"E           77°55'0"E                78°0'0"E                78°5'0"E
                77°45'0"E            77°50'0"E        77°55'0"E                78°0'0"E                78°5'0"E                                      77°45'0"E                77°50'0"E         77°55'0"E                78°0'0"E                78°5'0"E


                                      Aquifer Media Map                                                                                                                                   Soil Media Map                                                                                                                              Slope Map

                                                                                                                                                                                                                                                       ±                                                                                                                                        ±


                                                                                                                                                                                                                                                                                                                                                                                                            30°15'0"N
                                                                                                            ±
                                                                                                                             30°15'0"N


                                                                                                                                                                                                                                                                       30°15'0"N


                                                                                                                                                                                                                                                                                   30°15'0"N
   30°15'0"N


                                                                                                                                         30°15'0"N


                                                                                                                                                                                                                                                                                                                                                                                                            30°10'0"N
                                                                                                                             30°10'0"N


                                                                                                                                                                                                                                                                       30°10'0"N


                                                                                                                                                                                                                                                                                   30°10'0"N
   30°10'0"N


                                                                                                                                         30°10'0"N


                                                                                                                                                                                                                                                                                                                                                                                                            30°5'0"N
                                                                                                                             30°5'0"N


                                                                                                                                                                                                                                                                       30°5'0"N


                                                                                                                                                                                                                                                                                   30°5'0"N
   30°5'0"N


                                                                                                                                         30°5'0"N


                                                                                                                                                                                                                                                                                                                                                                                                            30°0'0"N
                                                                                                                             30°0'0"N


                                                                                                                                                                                                                                                                       30°0'0"N


                                                                                                                                                                                                                                                                                   30°0'0"N
   30°0'0"N


                                                                                                                                         30°0'0"N


                                                                                                                                                                                                                                                                                                                                                                                                            29°55'0"N
                                                                                                                             29°55'0"N


                                                                                                                                                                                                                                                                       29°55'0"N


                                                                                                                                                                                                                                                                                   29°55'0"N
   29°55'0"N


                                                                                                                                         29°55'0"N


                                                                                                                                                                                                                                                                                               percent slope
                                                                                                                                                                                                                                                                                                        0-2
                                                                                                                                                                                                                                                                                                       2-6
                                                                                                                                                     Legend (rating value)
                                                                                                                                                                                                                                                                                                        6-12
                                                                                                                             29°50'0"N


                                                                                                                                                                                                                                                                       29°50'0"N


                                                                                                                                                                                                                                                                                                                                                                                                            29°50'0"N
                                                                                                                                                                 4
               Legend
   29°50'0"N


                                                                                                                                         29°50'0"N


                                                                                                                                                                                                                                                                                   29°50'0"N
                                                                                                                                                                                                                                                                                                        12-18
                                                                                                                                                                 6
                        sand and gravel                                                                                                                                                                                                                                                                 >18
                                                                                                                                                                 9
                        Hilly Area                                                        Kilometers                                                                                                                                                                                                                                                                         Kilometers
                                                                                                                                                                                                                                    Kilometers                                                          Hilly area
                                                                       0   2    4              8       12               16                                       Hilly Area                                      0   2   4              8        12               16                                                                                      0   2   4               8       12           16


                     77°45'0"E            77°50'0"E        77°55'0"E                 78°0'0"E                78°5'0"E                                     77°45'0"E                77°50'0"E         77°55'0"E                 78°0'0"E                78°5'0"E                                       77°45'0"E           77°50'0"E           77°55'0"E                 78°0'0"E                78°5'0"E


(Source: Than Zaw, 2008)                                                                                                                                                                                                                                                                                                                                      iirs/nrsc/nrsc/isro
77°45'0"E           77°50'0"E            77°55'0"E                78°0'0"E                78°5'0"E                                        77°45'0"E           77°50'0"E        77°55'0"E                78°0'0"E                78°5'0"E


                                           Vadose Zone Media Map                                                                                                                     Hydraulic Conductivity Map


                                                                                                                         ±                                                                                                                                      ±


                                                                                                                                          30°15'0"N


                                                                                                                                                                                                                                                                                30°15'0"N
           30°15'0"N


                                                                                                                                                      30°15'0"N
                                                                                                                                          30°10'0"N


                                                                                                                                                                                                                                                                                30°10'0"N
           30°10'0"N


                                                                                                                                                      30°10'0"N
                                                                                                                                          30°5'0"N


                                                                                                                                                                                                                                                                                30°5'0"N
           30°5'0"N


                                                                                                                                                      30°5'0"N
                                                                                                                                          30°0'0"N


                                                                                                                                                                                                                                                                                30°0'0"N
           30°0'0"N


                                                                                                                                                      30°0'0"N
                                                                                                                                          29°55'0"N


                                                                                                                                                                                                                                                                                29°55'0"N
           29°55'0"N


                                                                                                                                                      29°55'0"N
                       Legend
                                                                                                                                                                  Legend in rating value
                                                                                                                                          29°50'0"N


                                                                                                                                                                                                                                                                                29°50'0"N
                            sand and gravel with                                                                                                                           2
           29°50'0"N


                                                                                                                                                      29°50'0"N
                            significant amount of silts and clay
                                                                                                                                                                           4
                            sand and gravel                                                                                                                                6
                                                                                                       Kilometers                                                                                                                            Kilometers
                            Hilly Area                                              0   2    4             8        12               16                                    Hilly Area
                                                                                                                                                                                                                          0   2   4              8        12               16

                               77°45'0"E           77°50'0"E            77°55'0"E                 78°0'0"E                78°5'0"E                                       77°45'0"E           77°50'0"E        77°55'0"E                 78°0'0"E                78°5'0"E


(Source: Than Zaw, 2008)                                                                                                                                                                                                                                        iirs/nrsc/nrsc/isro
77°45'0"E           77°50'0"E        77°55'0"E                78°0'0"E                78°5'0"E


                                                            DRASTIC INDEX MAP
                                                                                                                                    ±


                                                                                                                                                    30°15'0"N
                           30°15'0"N


                                                                                                                                                    30°10'0"N
                           30°10'0"N


                                                                                                                                                    30°5'0"N
                           30°5'0"N


                                                                                                                                                    30°0'0"N
                           30°0'0"N


                                                                                                                                                    29°55'0"N
                           29°55'0"N


                                       DRASTIC INDEX
                                               115 - 132
                                               132 - 142
                                               142. - 152


                                                                                                                                                    29°50'0"N
                           29°50'0"N


                                               152 - 163
                                               163 - 181
                                                                                                                 Kilometers
                                               Hilly Area                                     0   2   4               8       12               16

                                             77°45'0"E           77°50'0"E        77°55'0"E                 78°0'0"E                78°5'0"E


(Source: Than Zaw, 2008)                                                                                                                                        iirs/nrsc/nrsc/isro
Iirs Role of Remote sensing and GIS in Ground water studies

Iirs Role of Remote sensing and GIS in Ground water studies

  • 1.
    Role of RemoteSensing & GIS in Ground Water Studies Potentials, Constraints and Case Studies Dr. S.K. Srivastav Indian Institute of Remote Sensing (National Remote Sensing Centre) ISRO, Dept. of Space, Govt. of India Dehra Dun e-mail: sksrivastav@iirs.gov.in
  • 2.
    Background RS dataprovide only the surface or near-surface information; therefore, a link must be established between the surface observation and the subsurface (groundwater) phenomena (Jackson, 2002). Of all the hydrological applications of remote sensing, the hydrogeological analysis is one of the most difficult tasks (Farnsworth et al., 1984). However, the spatially complete and temporal nature of the RS data provide excellent opportunities to hydrogeologists for improving the understanding of the hydro- geological system, especially in remote and unexplored areas (Hoffmann and Sander, 2007). Since RS data have limitations with regard to depth penetration, the best approach is to integrate the airborne, space-borne and ground-based remote sensing techniques with field measurements (Meijerink et al., 2007). The RS data are most useful when they are combined with GIS and numerical modelling (Becker, 2006). iirs/nrsc/nrsc/isro
  • 3.
    Potentials and constraints VIS-NIR-SWIRRegion Mapping of surface features of hydrogeological relevance (or g.w. indicators) for understanding the controls of ground water occurrence and movement . These include – lithologies, structures, geomorphology, drainage patterns, land use / land cover and soil moisture. The amount of information which can be extracted from RS data depends on many factors – type of data including spatial and spectral resolutions, scale of image, date of acquisition of the image, type and knowledge of terrain, experience/ skill of the interpreter, etc. Mapping and monitoring the spatial distribution of ground water exfiltration (effluent streams) and infiltration (influent streams) zones. However, quantifying the magnitude of flux from space is still a major challenge Moist soils, swampy/waterlogged zones and vegetation (in dry climate) indicate ground water occurrence at shallow depth. However, quantification of soil moisture not possible. Further, in humid areas, the relation between g.w. and vegetation is complex and does not readily indicate g.w. occurrence. iirs/nrsc/nrsc/isro
  • 4.
    DEMs generated usingstereo images can be used to map the topographic attributes of the terrain. Spatial distribution and quantification of the magnitude of actual evapotranspiration rates (i.e. g.w. discharge by natural process and net draft for irrigation in g.w. irrigated areas) along with TIR and meteorological data. Absolute values estimated using SEBAL technique are often overestimated, however, the strength of RS data lies in providing the spatial patterns of g.w. use. Salt crusts provide an indication of high water table and also throw light on g.w. quality. iirs/nrsc/nrsc/isro
  • 5.
    Thermal Region Mapping moist soils and shallow water table areas. However, quantitative and temporal measurements of soil moisture are difficult. Mapping discharge of ground water into rivers, lakes and sea. Possibility of detection of such ground water discharges depends on temperature contrast and quantum of g.w. discharge. Quantification of g.w. discharge also not possible. Quantifying the spatial distribution of actual evapotranspiration rates in conjunction with VIS-NIR-SWIR and meteorological data. High resolution thermal images useful for mapping geothermal vents, hot springs, finding relation between distribution of hot springs and lineaments. iirs/nrsc/nrsc/isro
  • 6.
    Microwave Region Most suitable for mapping spatial distribution and temporal dynamics of soil moisture. Present configuration of microwave sensors provides soil moisture information restricted to 0–2 cm, and to areas free of dense vegetation cover. Coarse spatial resolution of the order of few kilometers is another major constraint. Detection of buried channels and palaeo-drainage up to certain depth (~ 2 m). Limited to only in hyper-arid conditions and in absence of surface cover. Generation of high-resolution digital elevation models (DEMs) using SAR data with a technique called radar or SAR interferometry (InSAR). Provides digital surface model (DSM) rather than digital terrain model (DTM). Height accuracy is of the order of few meters, therefore, elevations can not be directly used in quantitative g.w. flow modelling studies. iirs/nrsc/nrsc/isro
  • 7.
    Subtle changes inland surface elevation due to ground water withdrawal or recharge from/to the aquifers in unconsolidated sediments can be detected using a technique called differential radar interferometry (D-InSAR). The limitations include – (1) low availability of suitable InSAR images; and (2) Temporal decorrelation of radar signal due to change in land cover and atmospheric conditions. Measuring surface water elevation using Radar altimetry at sub-meter accuracy. However, the coarse spatial resolution limits its applicability only to large lakes and wetland systems. iirs/nrsc/nrsc/isro
  • 8.
    GRACE – Aspecial satellite mission for quantifying seasonal and inter-annual variations in terrestrial water storage GRACE – Gravity Recovery and Climate Experiment (launched by NASA & DLR in 2002) Principle - Spatio-temporal changes in mass distribution causes perturbations in the orbits of twin satellites, separated by about 220 km, inducing change in the relative distance between two satellites, which is used to map the gravity field. Accuracy estimates for interannual and seasonal water storage variations are of the order of 9 mm (at 1300 km resolution) and 10–15 mm (for area >2 million km2) water equivalent, respectively (Guntner et al., 2007). For estimating ground water recharge, storage changes due to other components of terrestrial water storage such as snow, surface water (rivers, lakes and wetlands), soil moisture, and biomass are separated using auxiliary observations and numerical models . Coarse resolution limits its applicability to study ground water dynamics at basin/ continental/ global scale (>900,000 km2 ) iirs/nrsc/nrsc/isro
  • 9.
    RS & GISapplications in ground water Mapping of prospective ground water zones, Ground water quality zonation including finding zones vulnerable to pollution, Site selection for artificial ground water recharge structures, Inputs in ground water budgeting, Upscaling of aquifer related parameters/ recharge rate, Ground water information management, etc. iirs/nrsc/nrsc/isro
  • 10.
    Infiltration Vs. ExfiltrationZones (Examples: Doon Valley & Indo-Gangetic Plain iirs/nrsc/nrsc/isro
  • 11.
    A few conspicuouslandforms (Example: part of Spiti Valley) Ground photo IRS LISS-3 Image Ground photo iirs/nrsc/nrsc/isro
  • 12.
    G.W. carriers andbarriers (Examples: S. India) iirs/nrsc/nrsc/isro
  • 13.
    Surface manifestation offaults on satellite imagery vis- a-vis hydrogeological section (Example: Doon Valley) R. na 45 0 mu ± 47 5 Ya F 500 42 5 55 77 5 0 500 60 0 550 57 5 60 0 Legend 5 57 Nagsidh 55 F Piezometric Head (m amsl) Hill 475 50 0 0 500 (contour interval = 25 m) Surface/Ground Water Divide 475 450 450 Direction of Ground Water 400 . Movement aR Hills 0 ng 0 5 10 20 35 Ga River / Stream Kilometers 1 F 2 50 m Dehradun Southern F 3 4 Fan Piedmont 5 7 6 1 2 Dehradun Southern 3 Fan Piedmont 4 5 7 6 25 m Tube Well 2 km 100 m Topographic Surface 2 km Piezometric Surface High-permeability facies Low-permeability facies Intermediate-permeability facies Tube Well Aquifer Tapped Piezometric Surface/SWL (Source: Srivastav, 2008) iirs/nrsc/nrsc/isro
  • 14.
  • 15.
    Ground Water PotentialZoning Segmentation or Hydrogeomorphic Approach using Satellite Imagery (Example – RGNDWM Project) GIS-based Integration of relevant data layers (Example – Doon Valley) iirs/nrsc/nrsc/isro
  • 16.
    RGNDWM Project Methodology IRS- LISS-III Data WGS 84 - UTM SOI toposheets SOI toposheets On screen Existing Existing WGS 84 -- UTM WGS 84 UTM interpretation maps maps Base map Lithological Structural Geomorphic Hydrological overlay map overlay Map overlay Map overlay Map overlay Integration Hydrogeomorphic units Evaluation of Identification of Observation Observation ground water locations for Well data Well data prospects recharge structures Map composition using GIS Ground water prospects map on 1: 50,000 Scale Geodatabase of ground water National Remote Sensing Agency iirs/nrsc/nrsc/isro
  • 17.
  • 18.
    RGNDWM Project Details of Map Legend: Lithological, Geomorphological, structural, Hydrological & base information along with .. 1. DEPTH TO WATER TABLE 2. RECHARGE CONDITIONS 3. NATURE OF AQUIFER MATERIAL 4. TYPE OF WELLS SUITABLE 5. DEPTH RANGE OF WELLS 6. YIELD RANGE OF WELLS 7. SUCCESS RATE OF WELLS 8. QUALITY OF WATER 9. STATUS OF GROUND WATER EXPLOITATION 10. TYPE OF RECHARGE STRUCTURES SUITABLE 11. PRIORITIZATION OF AREAS FOR RECHARGE STRUCTURES 12. REMARKS / PROBLEMS / LIMITATIONS iirs/nrsc/nrsc/isro
  • 19.
    RGNDWM Project States covered Phase-I Andhra Pradesh (part) 247 Karnataka 267 Kerala 67 Madhya Pradesh 458 Chhattisgarh 202 Rajasthan 413 Phase-II Jharkhand 129 Himachal Pradesh 91 Gujarat 210 Orissa 220 Total Sheets Covered = 2304 iirs/nrsc/nrsc/isro
  • 20.
    RGNDWM Project Work in progress (Phase-III) Phase Coverage No. of Schedule / Maps Status I 6 States 1654 Completed II 4 States 650 Completed III A 6 States 1290 In progress (Sept 07- Sept 09) B 4 States 339 Recently Launched (June 08 – June 10) Phase-III A Phase-III B Sl. No. State No. of Maps Sl. No. State No. of Maps 1 AP (part) 204 1 Arunachal Pradesh 120 2 Assam 103 3 Jammu & Kashmir 360 2 Haryana 73 4 Maharashtra 455 3 Uttar Pradesh (part) 88 5 Punjab 82 4 West Bengal (part) 58 6 Uttarakhand 86 Total 339 Total 1290 iirs/nrsc/nrsc/isro
  • 21.
    RGNDWM Project A sample map (53J/4) of Uttarakhand (Phase-III) iirs/nrsc/nrsc/isro
  • 22.
    RGNDWM Project iirs/nrsc/nrsc/isro
  • 23.
    RGNDWM Project Feedback onthe use of Ground Water Prospects Maps by State Govts. upto October 2008 State No. of Success No. of Recharge wells rate Structures Drilled Planned Constructed Andhra- Pradesh 43827 93% 478 478 Chhattisgarh 33413 92.5% 1155 327 Karnataka 47951 95% 2641 2589 Kerala 7730 92% 65 8 Madhya Pradesh 22006 90% 5190 3361 Rajasthan 98994 85 – 95% 320 320 Gujarat 12014 94.3 % 470 29 Orissa 292 92% Nil Nil Total 266227 10319 7112 iirs/nrsc/nrsc/isro
  • 24.
    GIS-based Integration (Example: DoonValley, Uttarakhand) R. 4 Intermontane Valley Part na ± Ya mu Vikasnagar As 2a Mussoorie ± an R. Sahaspur y lle Va 2b on Do Dehra Dun Legend 1 Sw GW MB Prospects T MBT 0.10 - 0.39 Poor Litho/Geom boundary 0.39 - 0.58 Poor to Moderate ey Water Divide Doiwala all 0.58 - 0.68 Moderate to Good V Road on Rail 0.68 - 0.81 Good to V. Good Do District boundary So Rishikesh 0.81 - 1.0 V. Good to Excellent River/stream ng R. Settlement R. Hill/Scarp zone 0 5 10 a ng 3 Lineament (Thrust/Fault/Fracture) Kilometers Ga (d) (b) Ya mu na R. ± Hilly/Mountainous Part ± Dehra Dun Legend GW Sw Pros- pects 0.1 - 0.2 V. Low 0.2 - 0.32 Low (Source: Srivastav, 2008) 0.32 - 0.45 Low to Moderate 0.45 - 0.61 Moderate to Good 0.61 - 0.95 Good to V. Good R. 0 10 20 0 5 10 a ng Ga Kilometers Kilometers iirs/nrsc/nrsc/isro
  • 25.
    Data Layers (hill/ mountainous part) (a) lithology; (b) lineament density; (c) dip-direction and slope-aspect relation; (d) relief; (e) curvature; (f) plan curvature; (g) profile curvature; (h) slope; (i) log of specific catchment area; (j) topographic wetness index. (Source: Srivastav, 2008) iirs/nrsc/nrsc/isro
  • 26.
    Data Layers (valleypart) (a) geomorphology; (b) lithology; (c) depth to potentiometric surface; (d) distance to aquifer boundary; (e) distance to perennial stream; (f) distance to valley axis; (g) slope; (h) drainage density; and (i) recharge source. (Source: Srivastav, 2008) iirs/nrsc/nrsc/isro
  • 27.
    D-InSAR technique fordetecting land subsidence due to ground water withdrawal (Example: Kolkata city) GW2 GW2 3 0.0 3 1.0 0.0 2.5 L1 5.0 3.0 GW2 L1 GW2 4.0 4 4 L3 L3 L2 L2 Average subsidence Average subsidence rate = ~5mm/year rate = ~6.5mm/year (Max.) (Max.) L1 : Machhua Bazar . . GW23 and GW24: Piezometric pressure observation L2 : Calcutta University 1.0 points L3 : Rajabazar Science College Subsidence contour with figures in mm/year Estimated rate of subsidence during 1992–98 = 5 – 6.5 mm/y IHS colour composition of the interferograms showing subsidence fringes in Kolkata City during the 1990s due to ground water withdrawal (Source: Chatterjee et al., 2007) iirs/nrsc/nrsc/isro
  • 28.
    1. Rat-hole typecoal mines and AMD Study under M.Sc. Geohazards Research (Blahwar, 2010) • Coal is extracted by an artisanal method of mining called as “rat-hole” mining. • Carried out by individuals and highly unorganized. • From literature: Water bodies polluted with acid mine drainage (AMD).
  • 29.
    “To identify andmap the rat-hole type coal mines (Visual Interpret.)” CARTOSAT-1 PAN and RESOURCESAT-1 LISS-4 merged FCC depicting rat-hole type coal mines and other landscape features.
  • 30.
    “To determine thepresence & hydro-chemical characteristics of AMD” Sampling locations Monsoon 14 – water samples; 4 additional – pH, EC, T; 8 – stream sediments Non-monsoon 30 – water samples; 12 additional – pH, EC, T; 22 – stream sediments
  • 31.
    Mines as sourceof AMD? X-axis stream provenance S = Sedimentary rock M = Metamorphic rock S+M = Mixed sedimentary and metamorphic
  • 32.
    Geospatial analysis offluoride incidence in ground water (Example: part of Raigarh Dist., Chhattisgarh) N Konpara W E #% % Kathrapalli Salehapara % % # Raikera #% S Nundaraha % # # # Auraimura kerakhol % % # Charbhanta # % # Banai Chirmura Bajarmura # % % % Gharghoda Dholnara % Bhalumuda# #% ## ##% Karuwahi % Kolam # Jhankhadarha Barkaspalli #%# # % Rodopalli ## # # # % % Muragaon Bhendra Jhariapalli Patrapalli# Chitwahi % #% # Saraitola # #% Baihamura ## % # # % #% ## # # % # #Dolesara # %# # # # % Pata # Mahuapalli # # #% Gare % # # % # Ukrapalli ## Devgarh Pata Bandhap# # LEGEND # % % # # % Kunjhemura Regaon # Jerekela % # % Village location Bhalumara #% % # Murhinar % Manjhapara # # % # Pre-monsoon sampling wells Amlidih Chhaiadoria Kachkoba % % # % Paved road # # # Basanpalli #% Unpaved road ## Tamnar % Parkipahri # Jhindolpara Amaghat % #% Gorhi # ## % # % (Source: Beg, 2009) iirs/nrsc/nrsc/isro
  • 33.
    Health Risk andPopulation at Risk Pre-monsoon Post-monsoon Pre- and post-monsoon combined (Source: Beg, 2009) iirs/nrsc/nrsc/isro
  • 34.
    Ground water qualityzonation using GIS (Example: part of Nalgonda Dist., A.P.) (Source: Kumar and Anjaneyulu, 2003) iirs/nrsc/nrsc/isro
  • 35.
    (Source: Kumar andAnjaneyulu, 2003) iirs/nrsc/nrsc/isro
  • 36.
    Ground water pollutionpotential zoning (Example: Solani watershed, Uttarakhand & U.P.) Method: DRASTIC Model (Aller et al., 1987) DI = DwDr + RwRr + AwAr + SwSr + TwTr + IwIr + CwCr (1) where DI is the Drastic Index, and w and r represent weights and ratings, respectively. D - Depth to ground water R - Recharge rate A - Aquifer media S - Soil Media T - Topography I - Impact of Vadose Zone C - Hydraulic conductivity of aquifer Higher the DRASTIC index, greater the relative pollution potential. iirs/nrsc/nrsc/isro
  • 37.
    77°45'0"E 77°50'0"E 77°55'0"E 78°0'0"E 78°5'0"E 77°45'0"E 77°50'0"E 77°55'0"E 78°0'0"E 78°5'0"E DEPTH TO WATER TABLE MAP Rainfall Recharge Map ± ± 30°15'0"N 30°15'0"N 30°15'0"N 30°15'0"N 30°10'0"N 30°10'0"N 30°10'0"N 30°10'0"N ( ! ( ! 30°5'0"N 30°5'0"N (( !! (( !! 30°5'0"N 30°5'0"N (( !!! ( (( !! ( ! ( ! ( ! ( ! !! (( ( ! ( ! ( ! 30°0'0"N ( ! 30°0'0"N 30°0'0"N 30°0'0"N ( ! ( ! ( ! ! ( LEGEND ( ! ( ! ( ! 29°55'0"N ( ! ( ! 29°55'0"N ( ! Dug well 29°55'0"N ( ! 29°55'0"N ( ! ( ! ( ! ( ! Tube Well ( ! ! ( LEGEND ( ! Depth to water table ( ! <107 mm/yr <5 m ( ! 107 - 161mm/yr (( !! ( ! 5-10 m 161 - 202 mm/yr 29°50'0"N 29°50'0"N ( ! 29°50'0"N 10-15 m ! ( 202 - 239 mm/yr 29°50'0"N ( ! 15-20 m 239 - 361 mm/yr Hilly Area Kilometers >20 m Kilometers 0 2 4 8 12 16 Hilly Area 0 2 4 8 12 16 77°45'0"E 77°50'0"E 77°55'0"E 78°0'0"E 78°5'0"E 77°45'0"E 77°50'0"E 77°55'0"E 78°0'0"E 78°5'0"E (Source: Than Zaw, 2008) iirs/nrsc/nrsc/isro
  • 38.
    77°45'0"E 77°50'0"E 77°55'0"E 78°0'0"E 78°5'0"E 77°45'0"E 77°50'0"E 77°55'0"E 78°0'0"E 78°5'0"E 77°45'0"E 77°50'0"E 77°55'0"E 78°0'0"E 78°5'0"E Aquifer Media Map Soil Media Map Slope Map ± ± 30°15'0"N ± 30°15'0"N 30°15'0"N 30°15'0"N 30°15'0"N 30°15'0"N 30°10'0"N 30°10'0"N 30°10'0"N 30°10'0"N 30°10'0"N 30°10'0"N 30°5'0"N 30°5'0"N 30°5'0"N 30°5'0"N 30°5'0"N 30°5'0"N 30°0'0"N 30°0'0"N 30°0'0"N 30°0'0"N 30°0'0"N 30°0'0"N 29°55'0"N 29°55'0"N 29°55'0"N 29°55'0"N 29°55'0"N 29°55'0"N percent slope 0-2 2-6 Legend (rating value) 6-12 29°50'0"N 29°50'0"N 29°50'0"N 4 Legend 29°50'0"N 29°50'0"N 29°50'0"N 12-18 6 sand and gravel >18 9 Hilly Area Kilometers Kilometers Kilometers Hilly area 0 2 4 8 12 16 Hilly Area 0 2 4 8 12 16 0 2 4 8 12 16 77°45'0"E 77°50'0"E 77°55'0"E 78°0'0"E 78°5'0"E 77°45'0"E 77°50'0"E 77°55'0"E 78°0'0"E 78°5'0"E 77°45'0"E 77°50'0"E 77°55'0"E 78°0'0"E 78°5'0"E (Source: Than Zaw, 2008) iirs/nrsc/nrsc/isro
  • 39.
    77°45'0"E 77°50'0"E 77°55'0"E 78°0'0"E 78°5'0"E 77°45'0"E 77°50'0"E 77°55'0"E 78°0'0"E 78°5'0"E Vadose Zone Media Map Hydraulic Conductivity Map ± ± 30°15'0"N 30°15'0"N 30°15'0"N 30°15'0"N 30°10'0"N 30°10'0"N 30°10'0"N 30°10'0"N 30°5'0"N 30°5'0"N 30°5'0"N 30°5'0"N 30°0'0"N 30°0'0"N 30°0'0"N 30°0'0"N 29°55'0"N 29°55'0"N 29°55'0"N 29°55'0"N Legend Legend in rating value 29°50'0"N 29°50'0"N sand and gravel with 2 29°50'0"N 29°50'0"N significant amount of silts and clay 4 sand and gravel 6 Kilometers Kilometers Hilly Area 0 2 4 8 12 16 Hilly Area 0 2 4 8 12 16 77°45'0"E 77°50'0"E 77°55'0"E 78°0'0"E 78°5'0"E 77°45'0"E 77°50'0"E 77°55'0"E 78°0'0"E 78°5'0"E (Source: Than Zaw, 2008) iirs/nrsc/nrsc/isro
  • 40.
    77°45'0"E 77°50'0"E 77°55'0"E 78°0'0"E 78°5'0"E DRASTIC INDEX MAP ± 30°15'0"N 30°15'0"N 30°10'0"N 30°10'0"N 30°5'0"N 30°5'0"N 30°0'0"N 30°0'0"N 29°55'0"N 29°55'0"N DRASTIC INDEX 115 - 132 132 - 142 142. - 152 29°50'0"N 29°50'0"N 152 - 163 163 - 181 Kilometers Hilly Area 0 2 4 8 12 16 77°45'0"E 77°50'0"E 77°55'0"E 78°0'0"E 78°5'0"E (Source: Than Zaw, 2008) iirs/nrsc/nrsc/isro