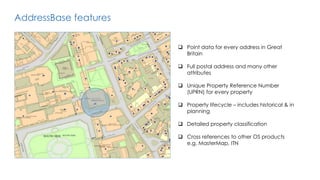
Download to read offline


![Halcrow analysis
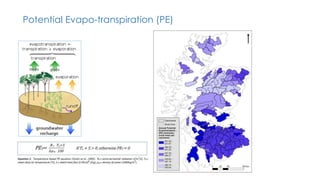
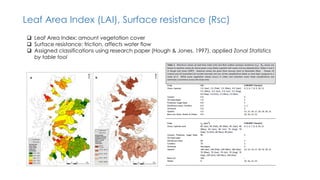
Initial regression-based equation proposed based on 43 catchments (Halcrow, 2012)
PROPWET = 0.5365Log10[SAAR – (PE x LAI4.70 x r 0.79 x 2.003E - 5)] - 0.998](https://image.slidesharecdn.com/geoforumdb-140620083123-phpapp01/85/Using-EDINA-Datasets-in-a-Hydrology-Project-Darius-Bazazi-13-320.jpg)
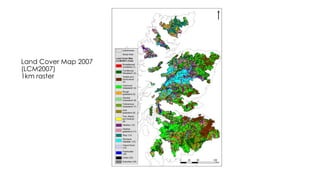


The document outlines a hydrology project utilizing EDINA datasets to improve flood management through accurate property data analysis and regression-based equations for soil moisture values (propwet). It describes the project workflow, including data acquisition and modeling steps, while emphasizing the importance of land cover data and the collaboration of local authorities. Additionally, the project aims to enhance natural flood management practices by simulating various ground conditions and refining approaches based on observed flooding incidents.