Download to read offline


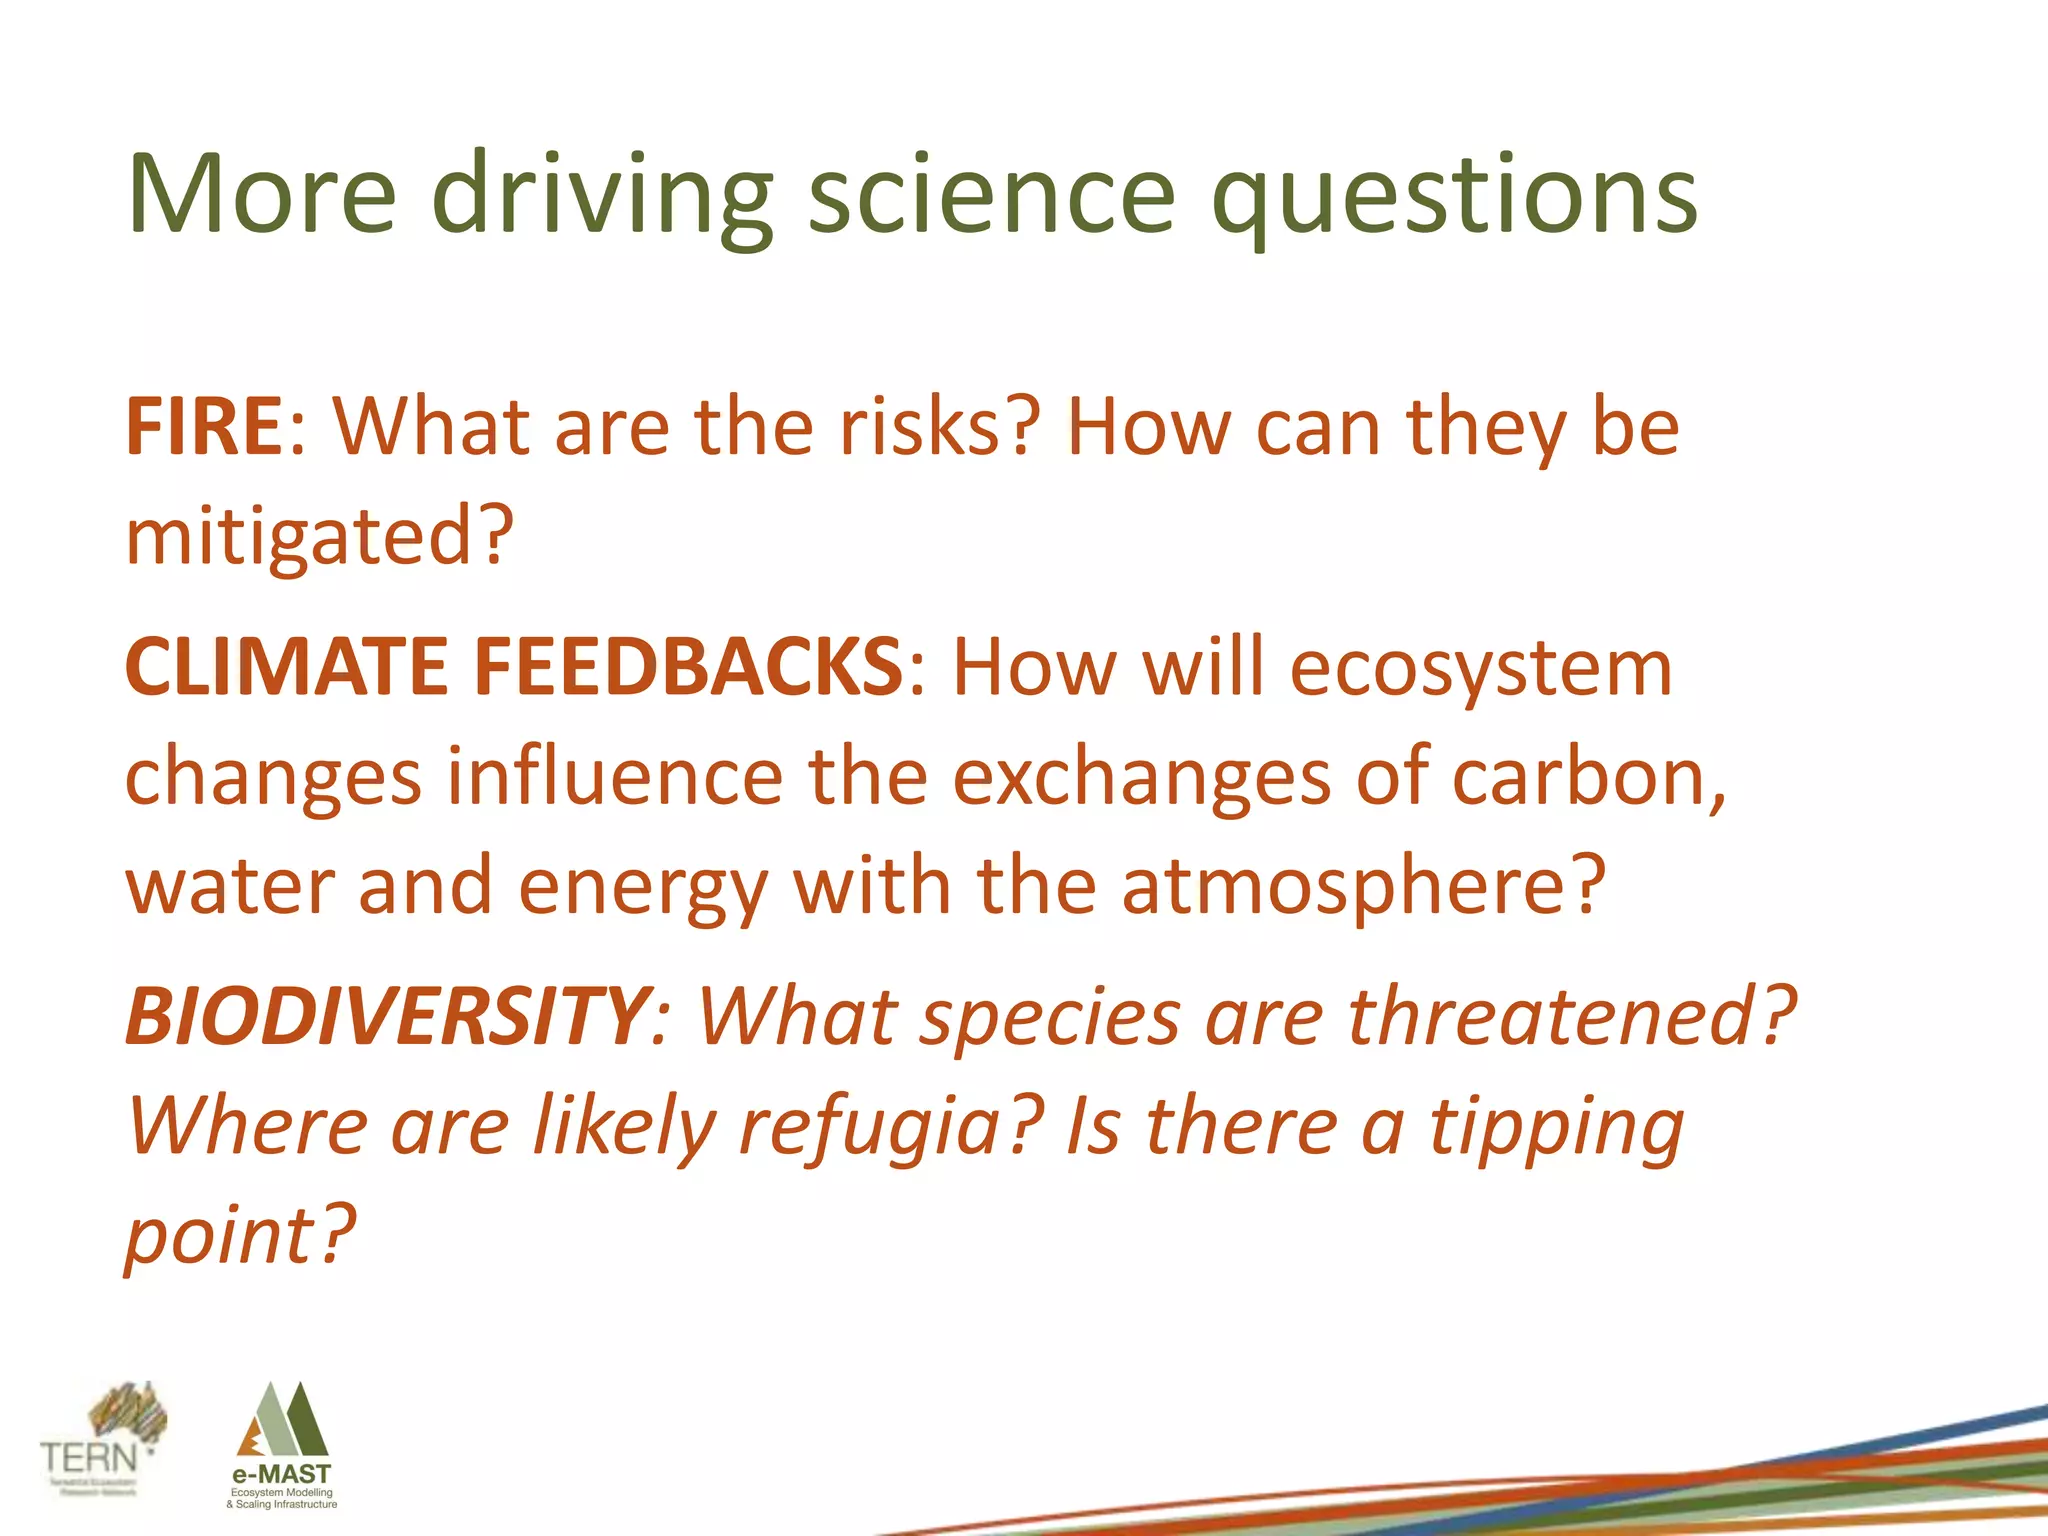
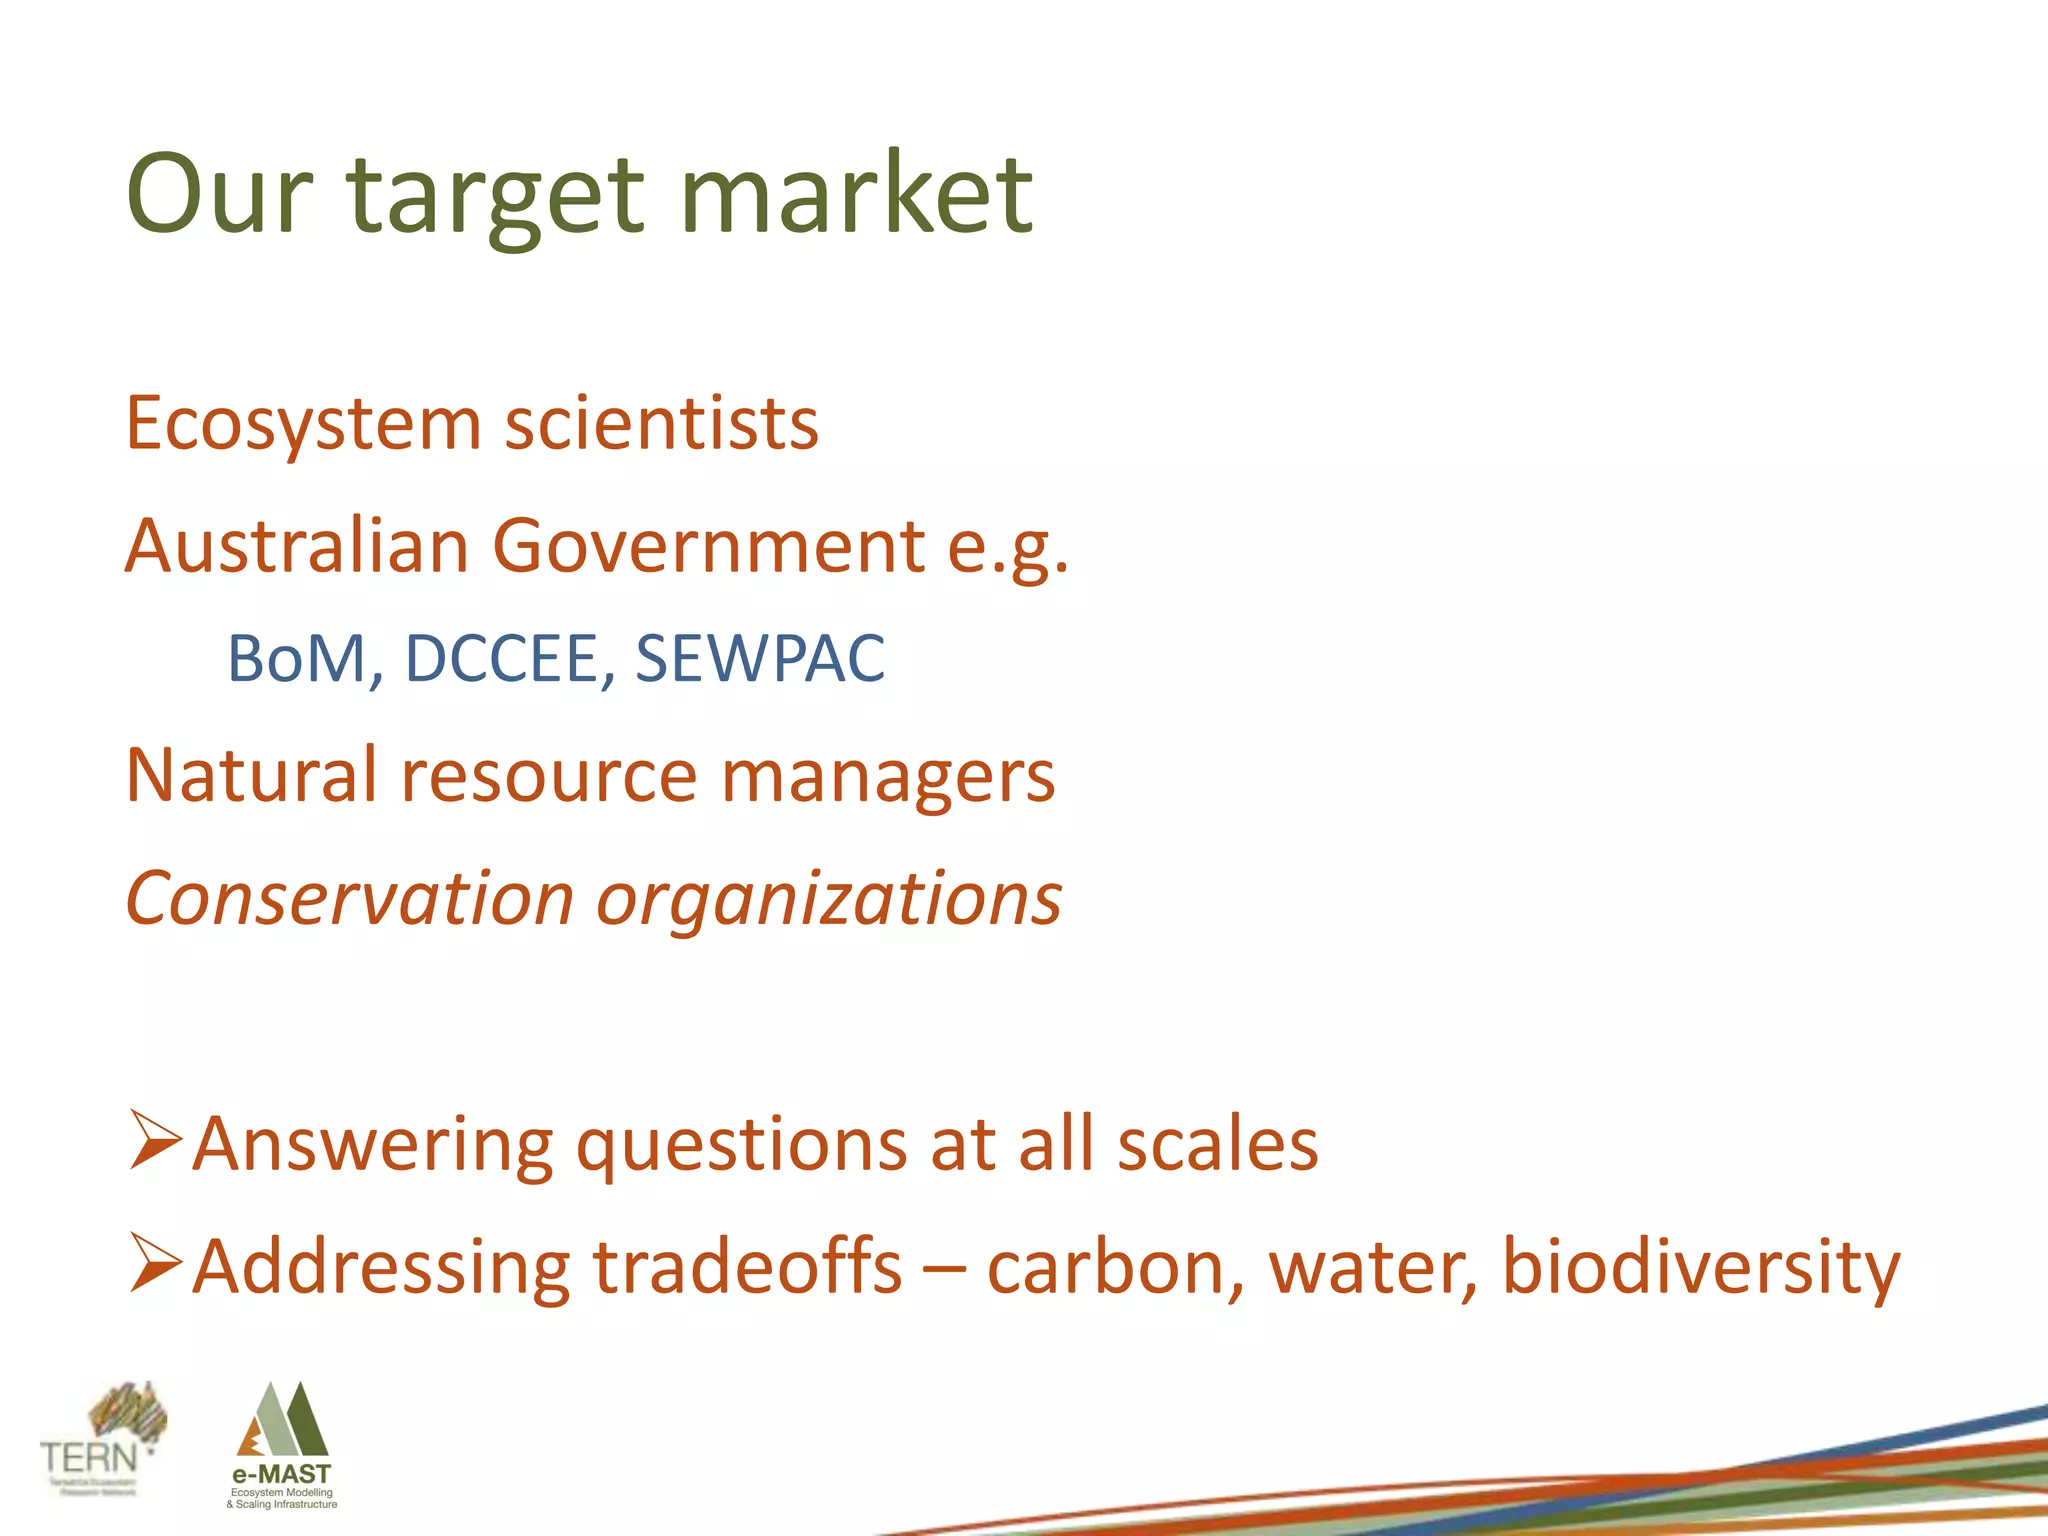
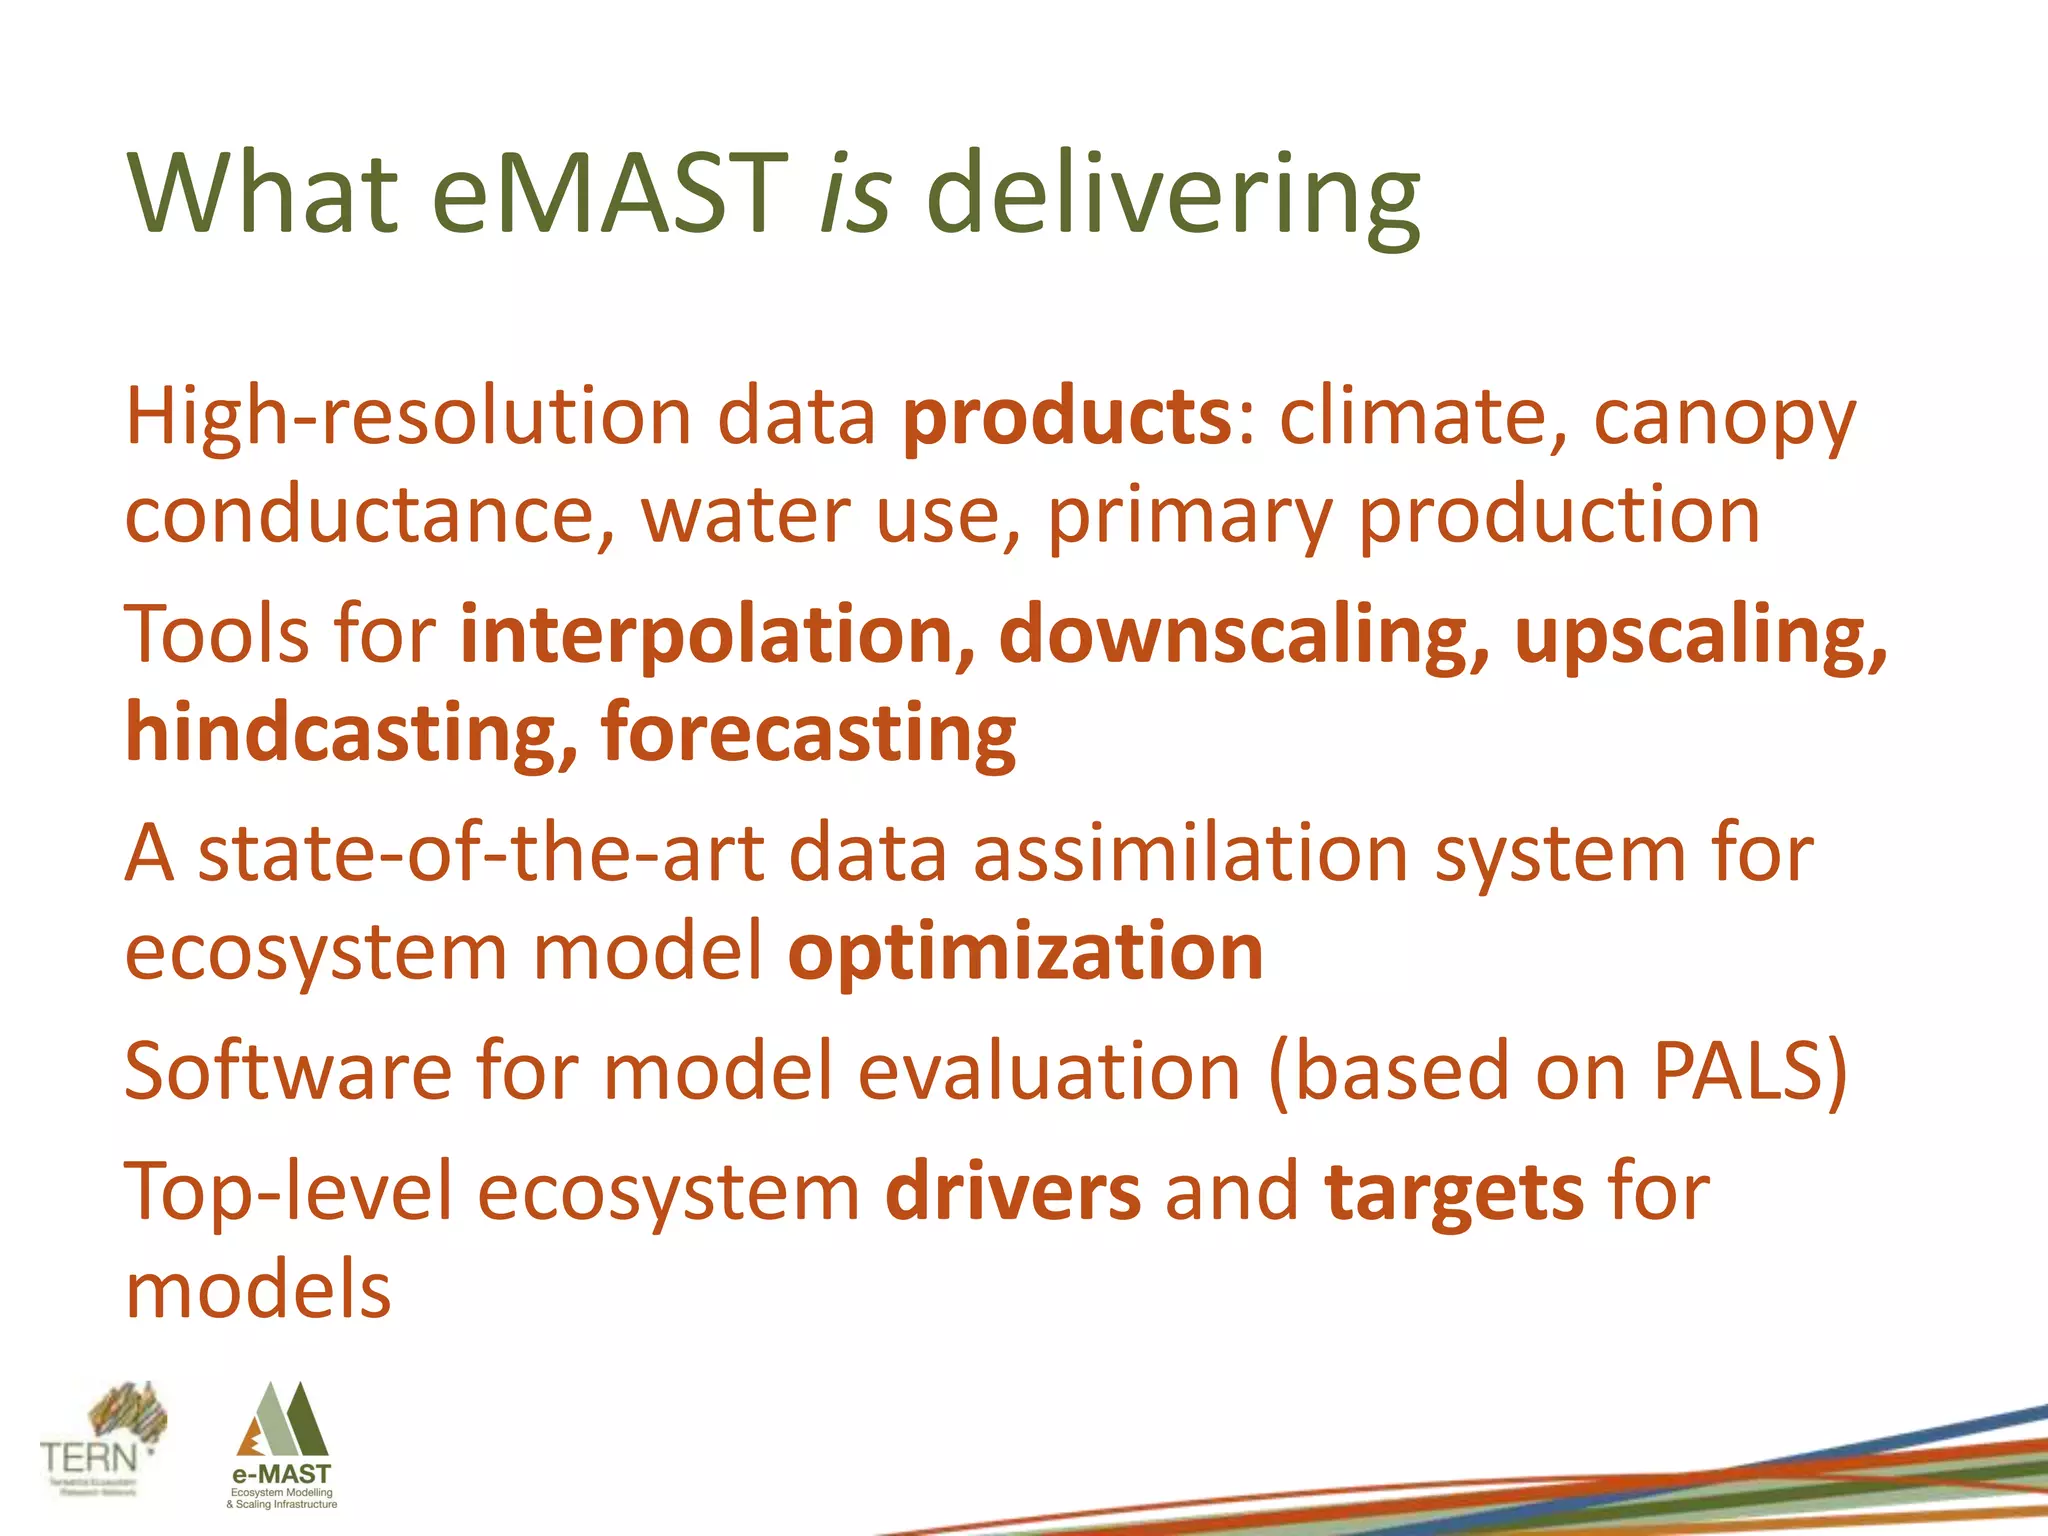
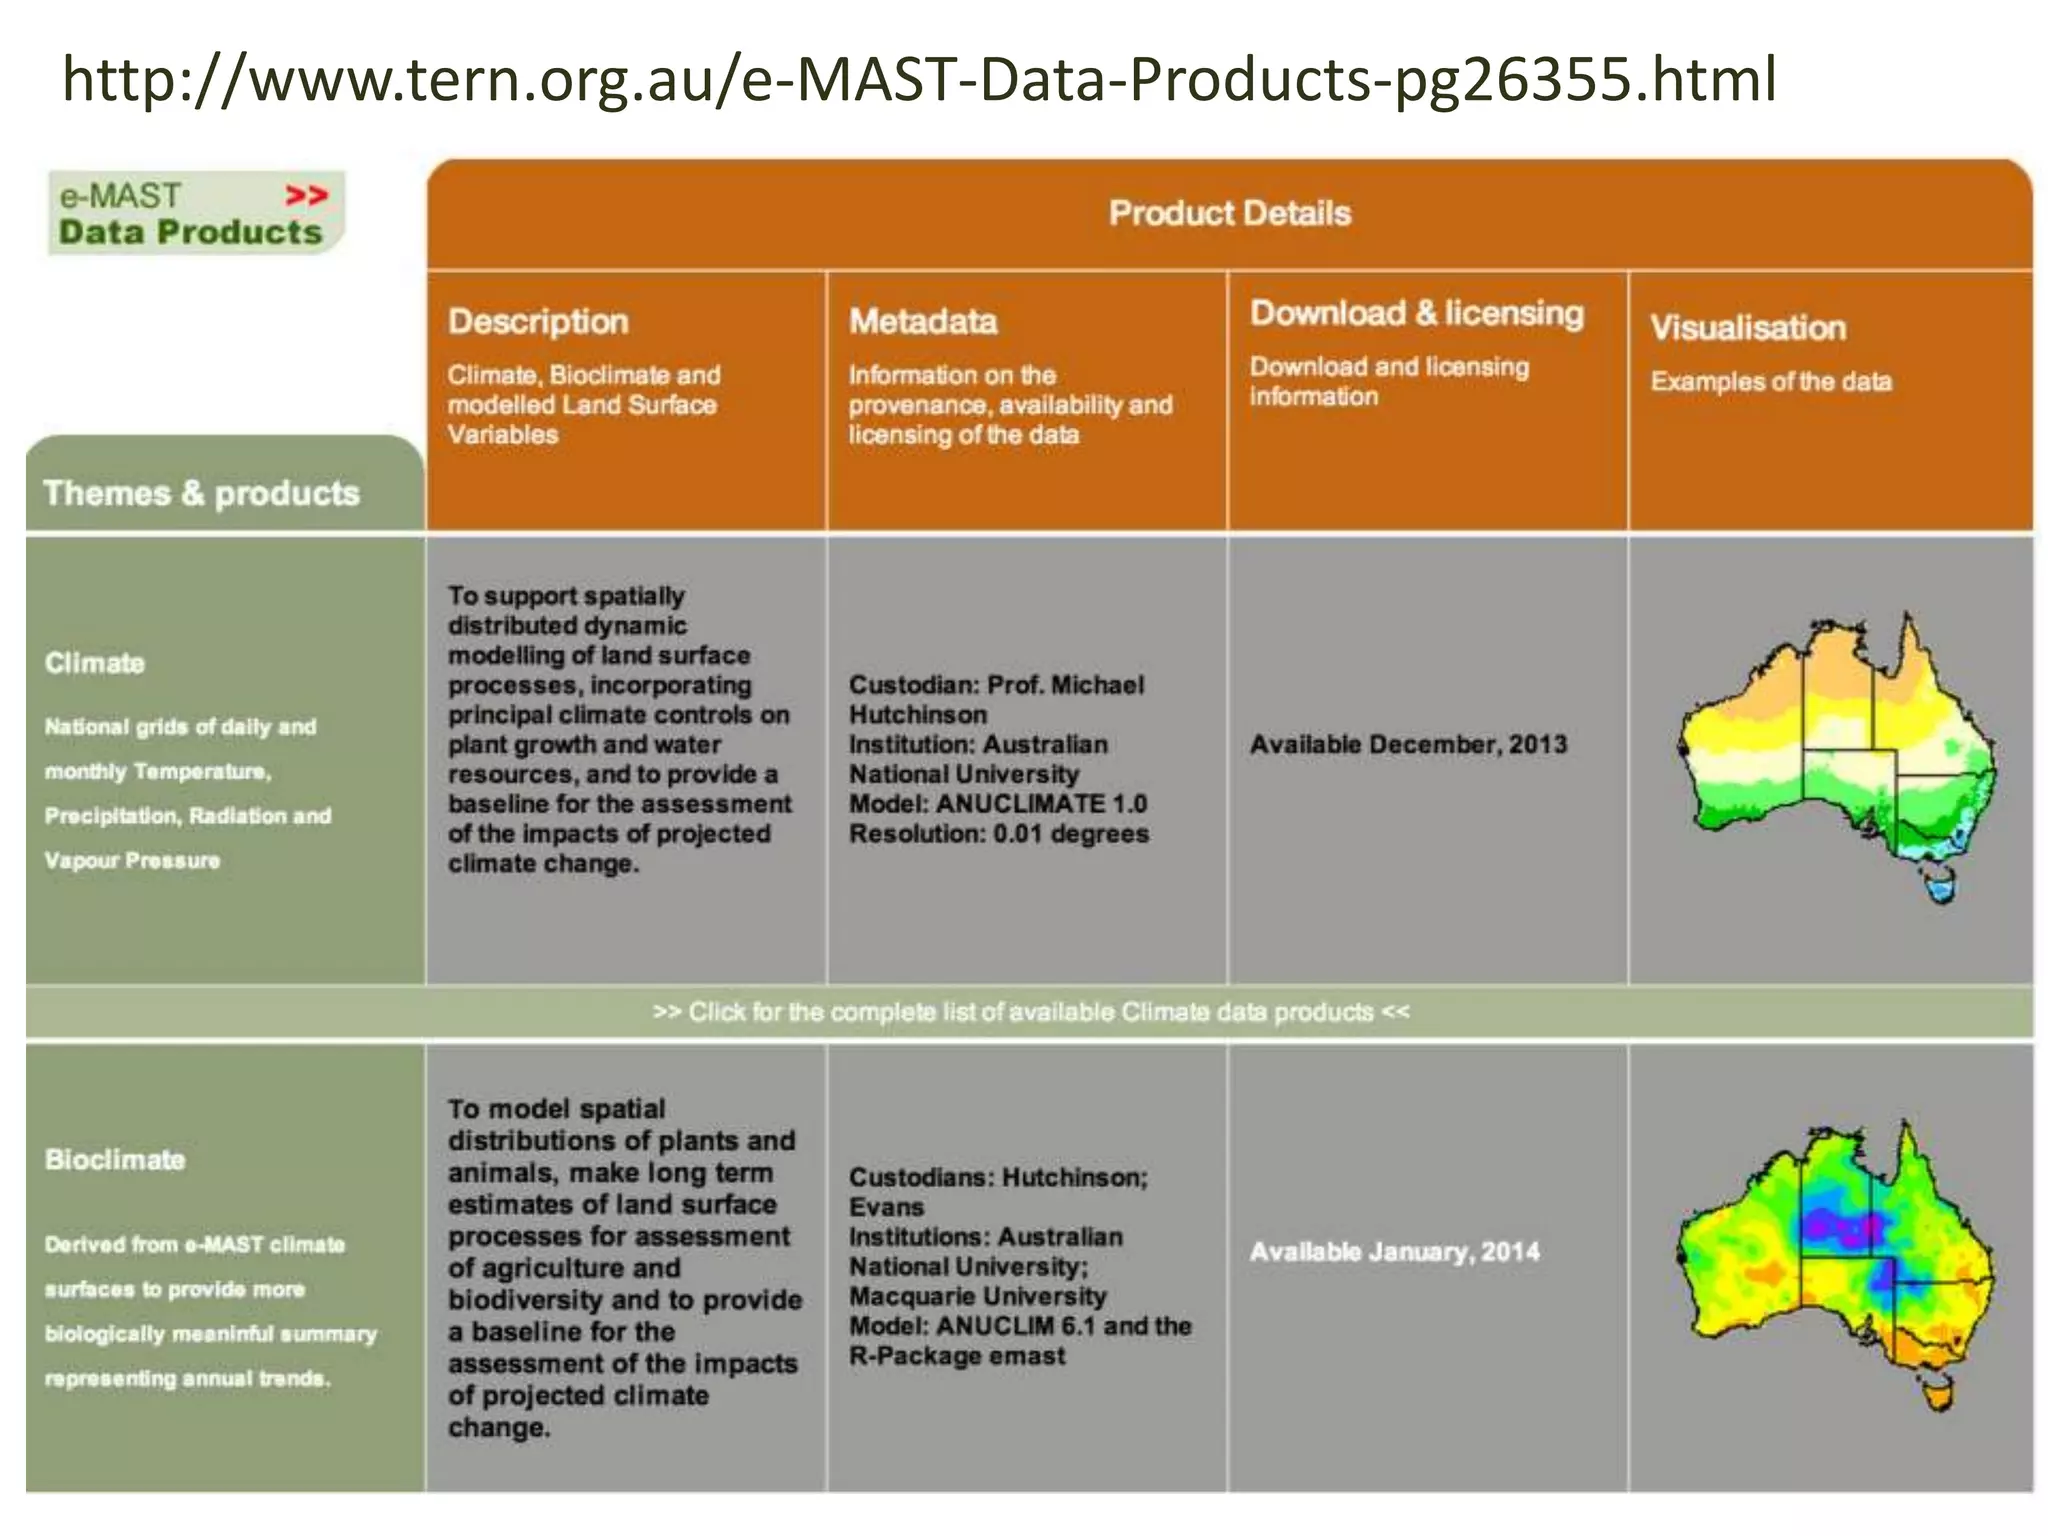

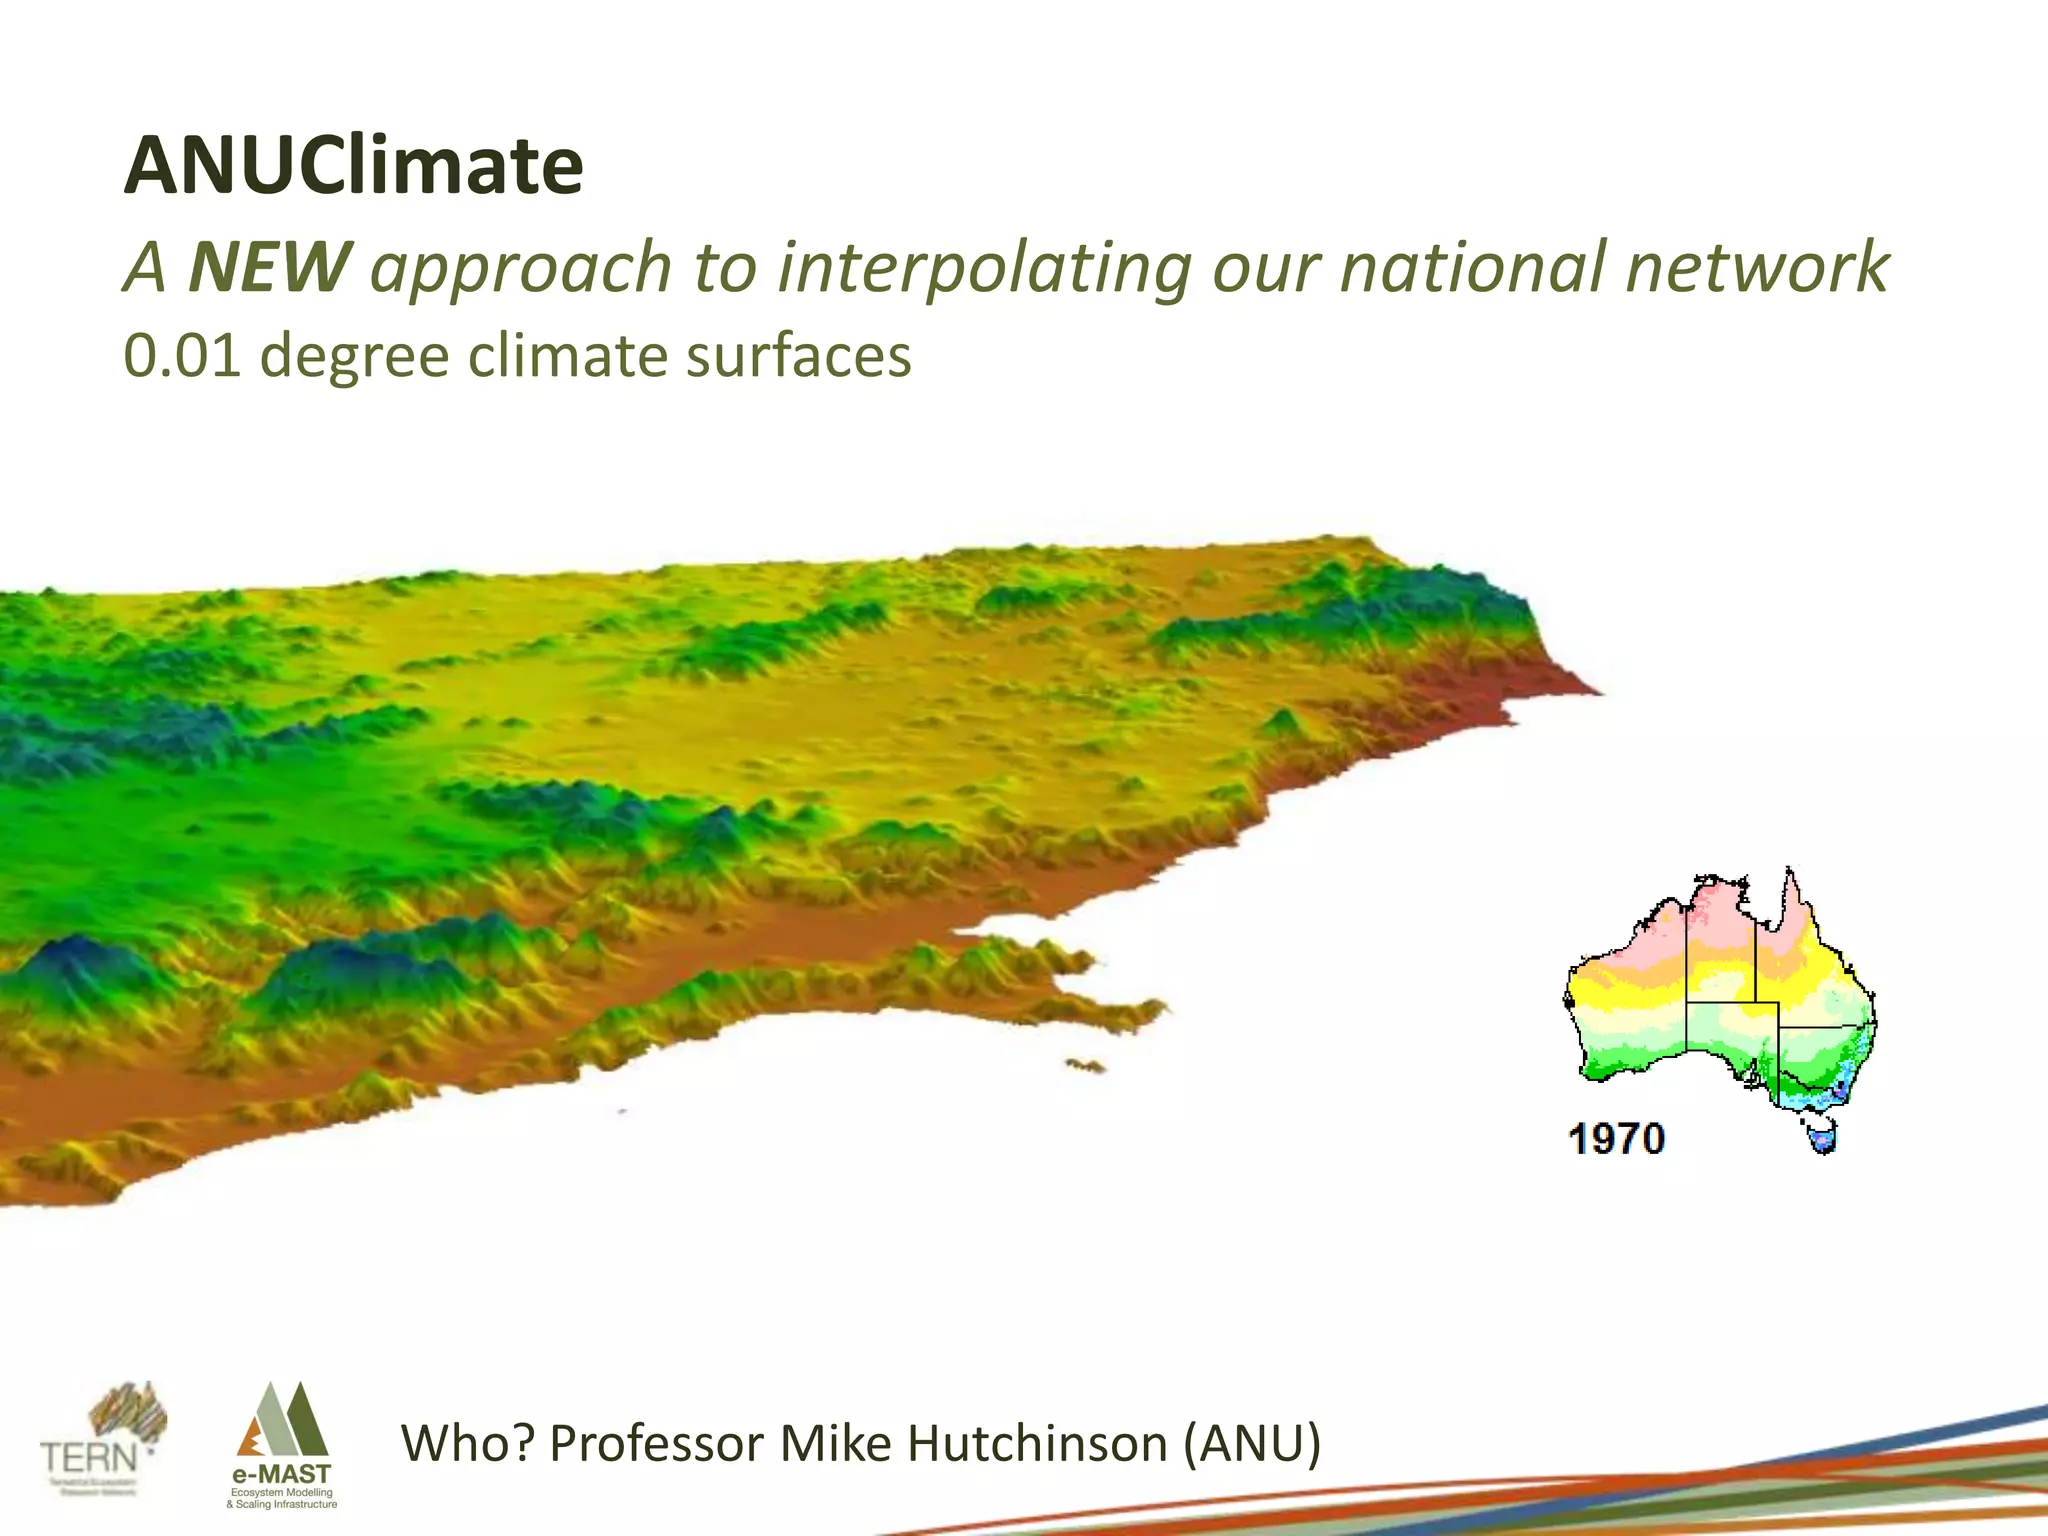


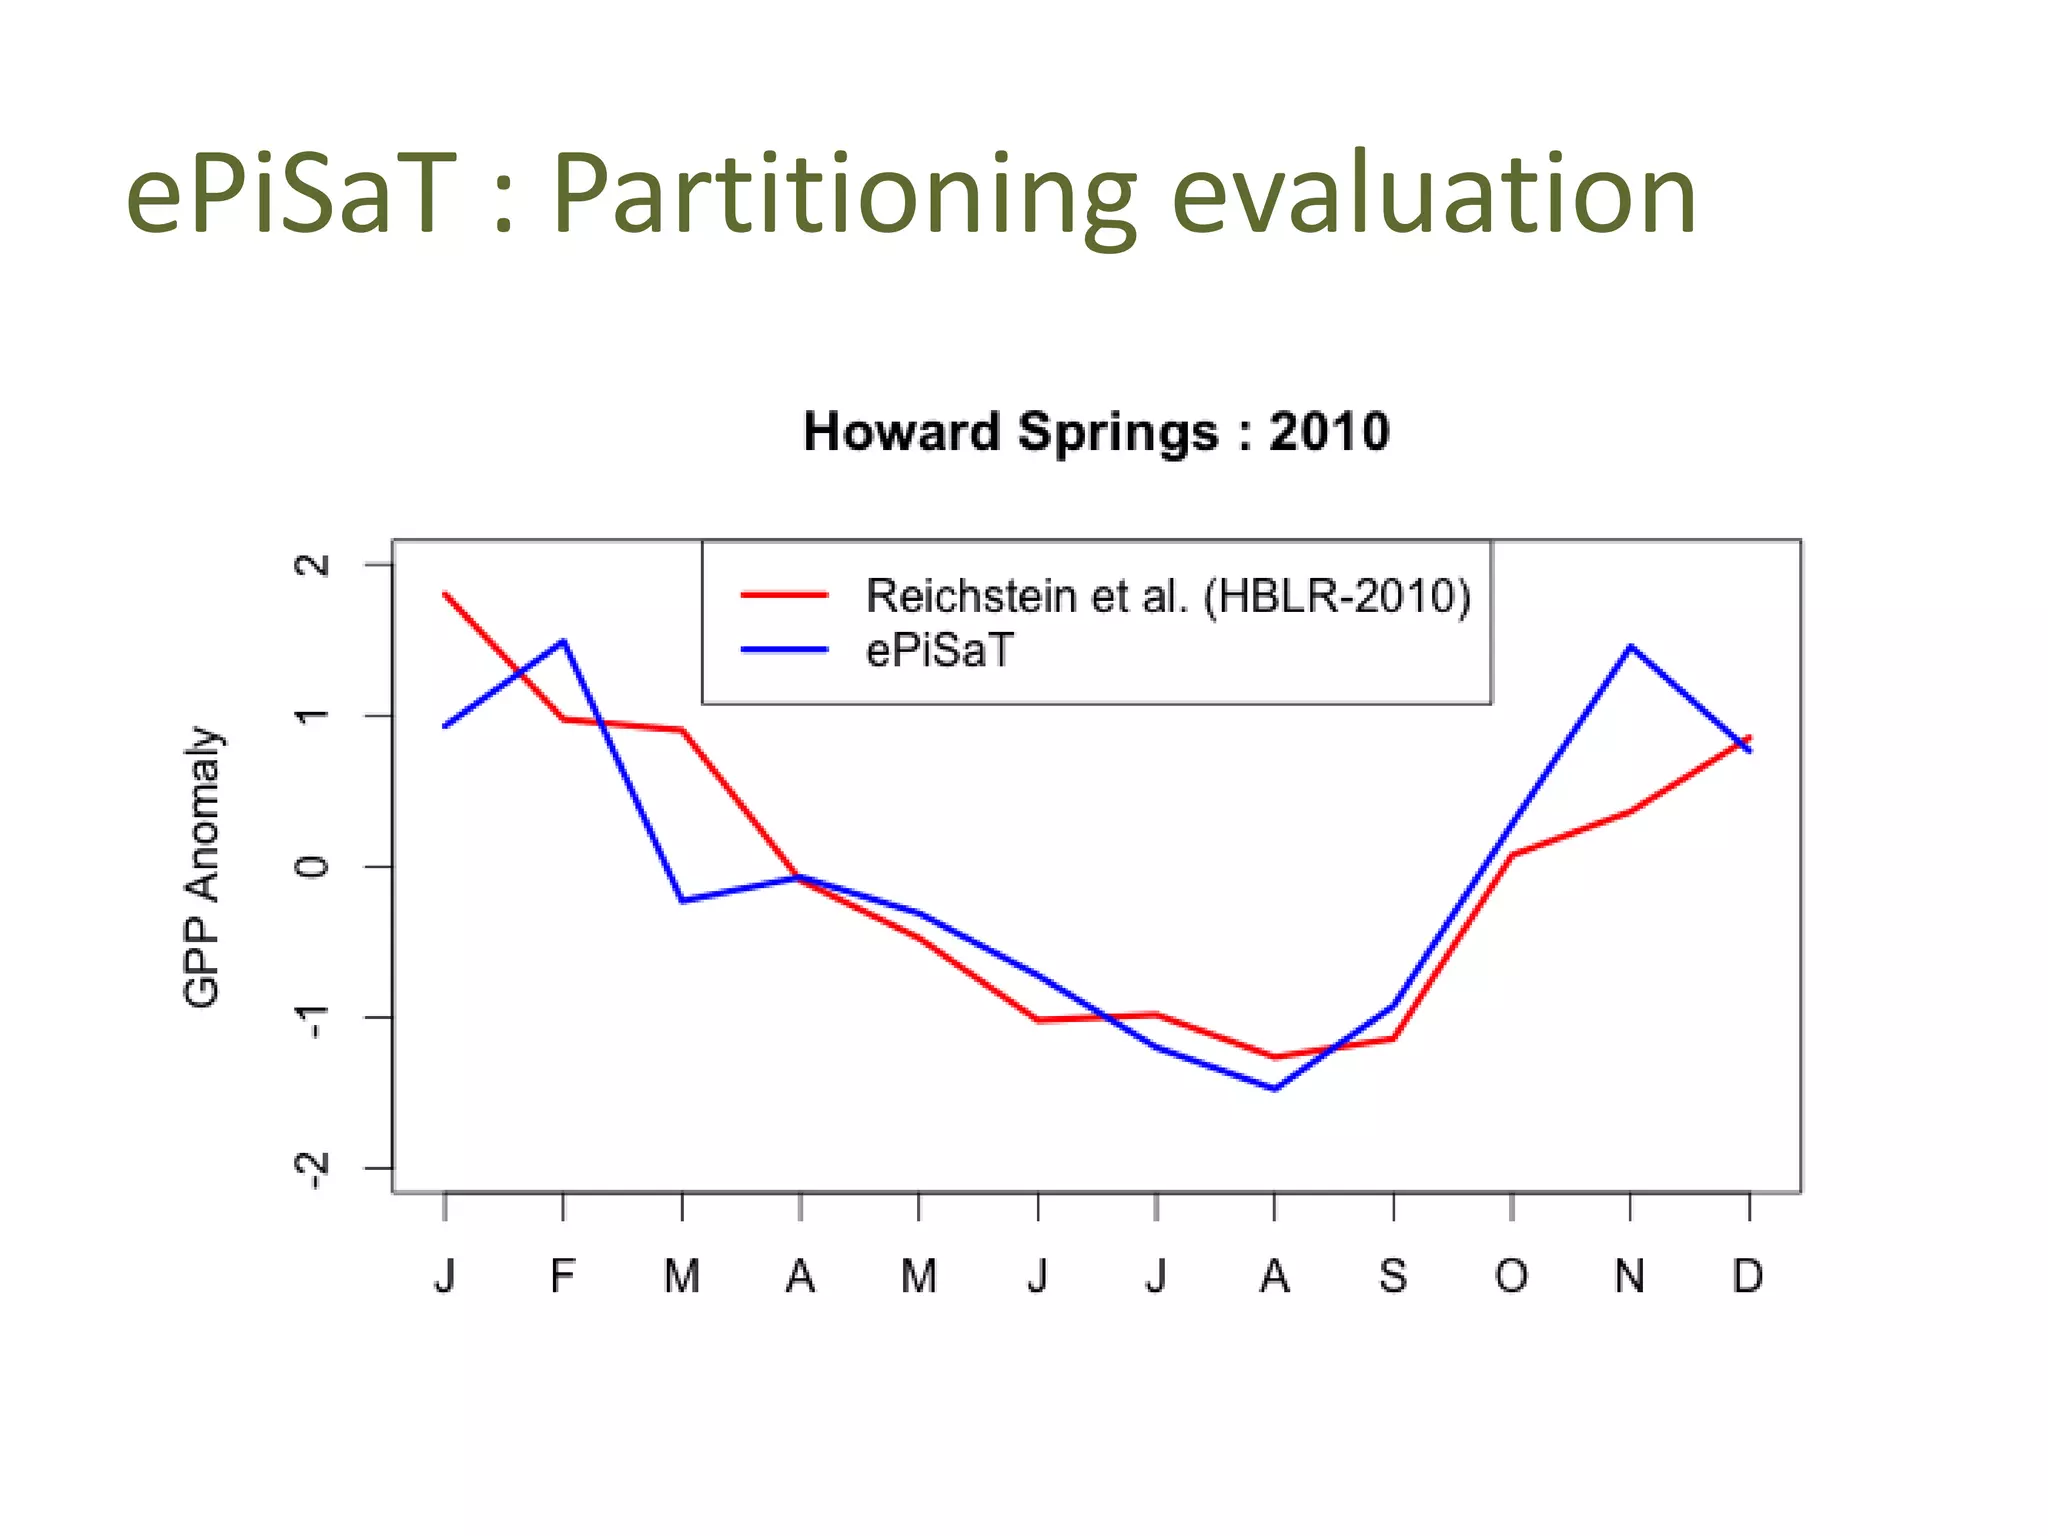
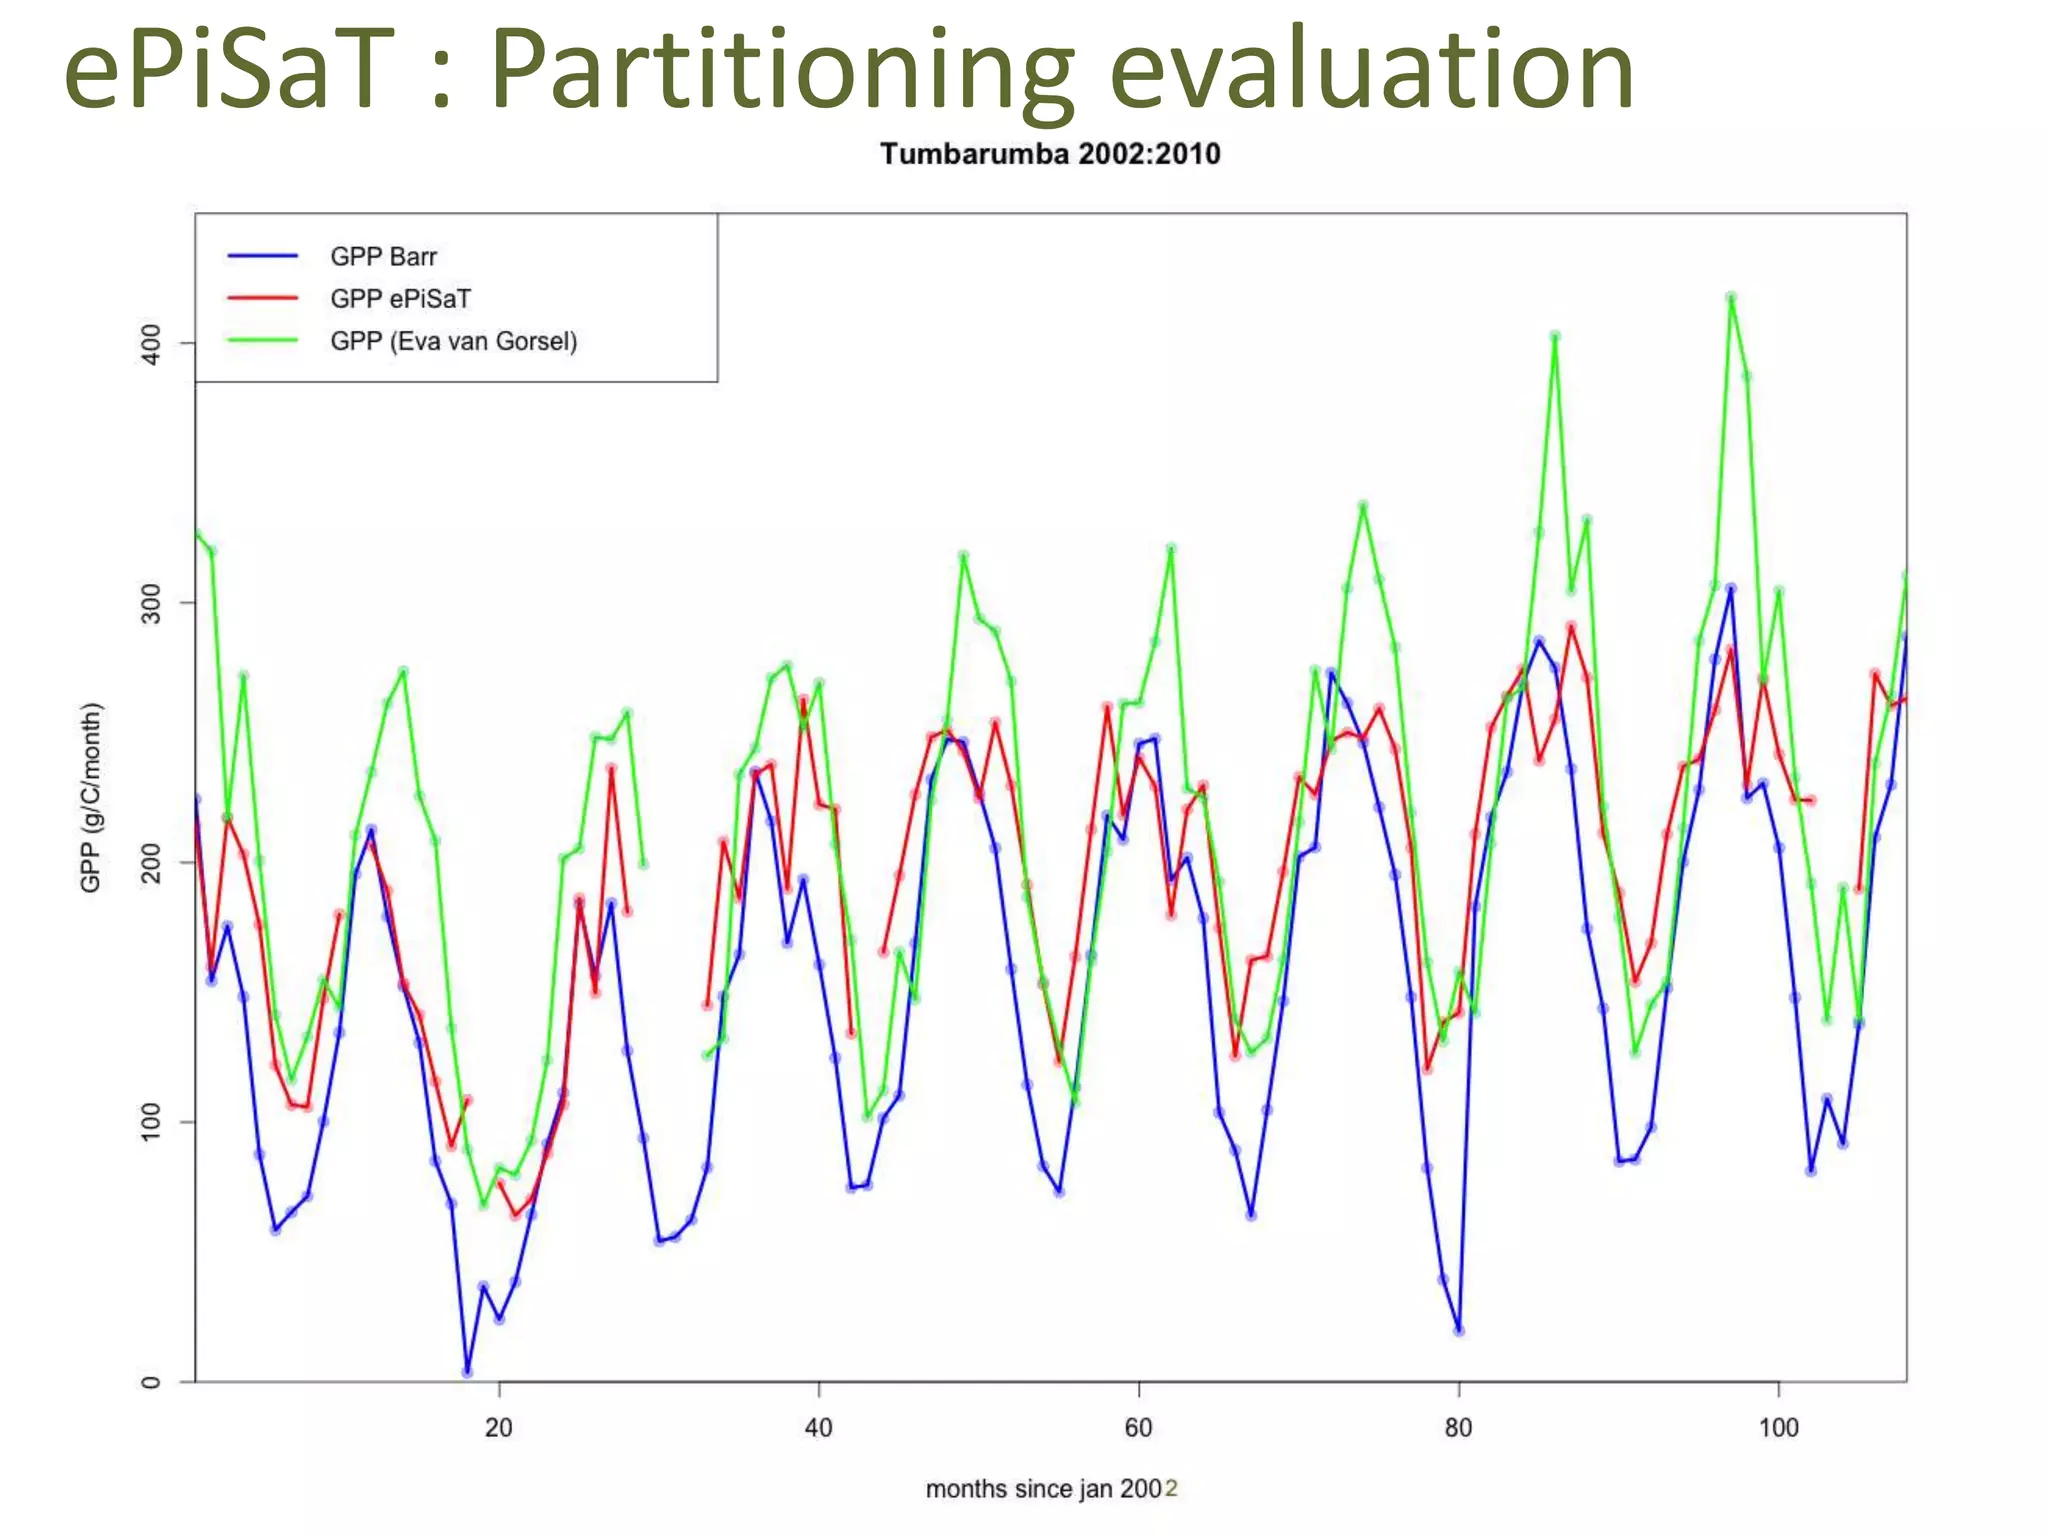

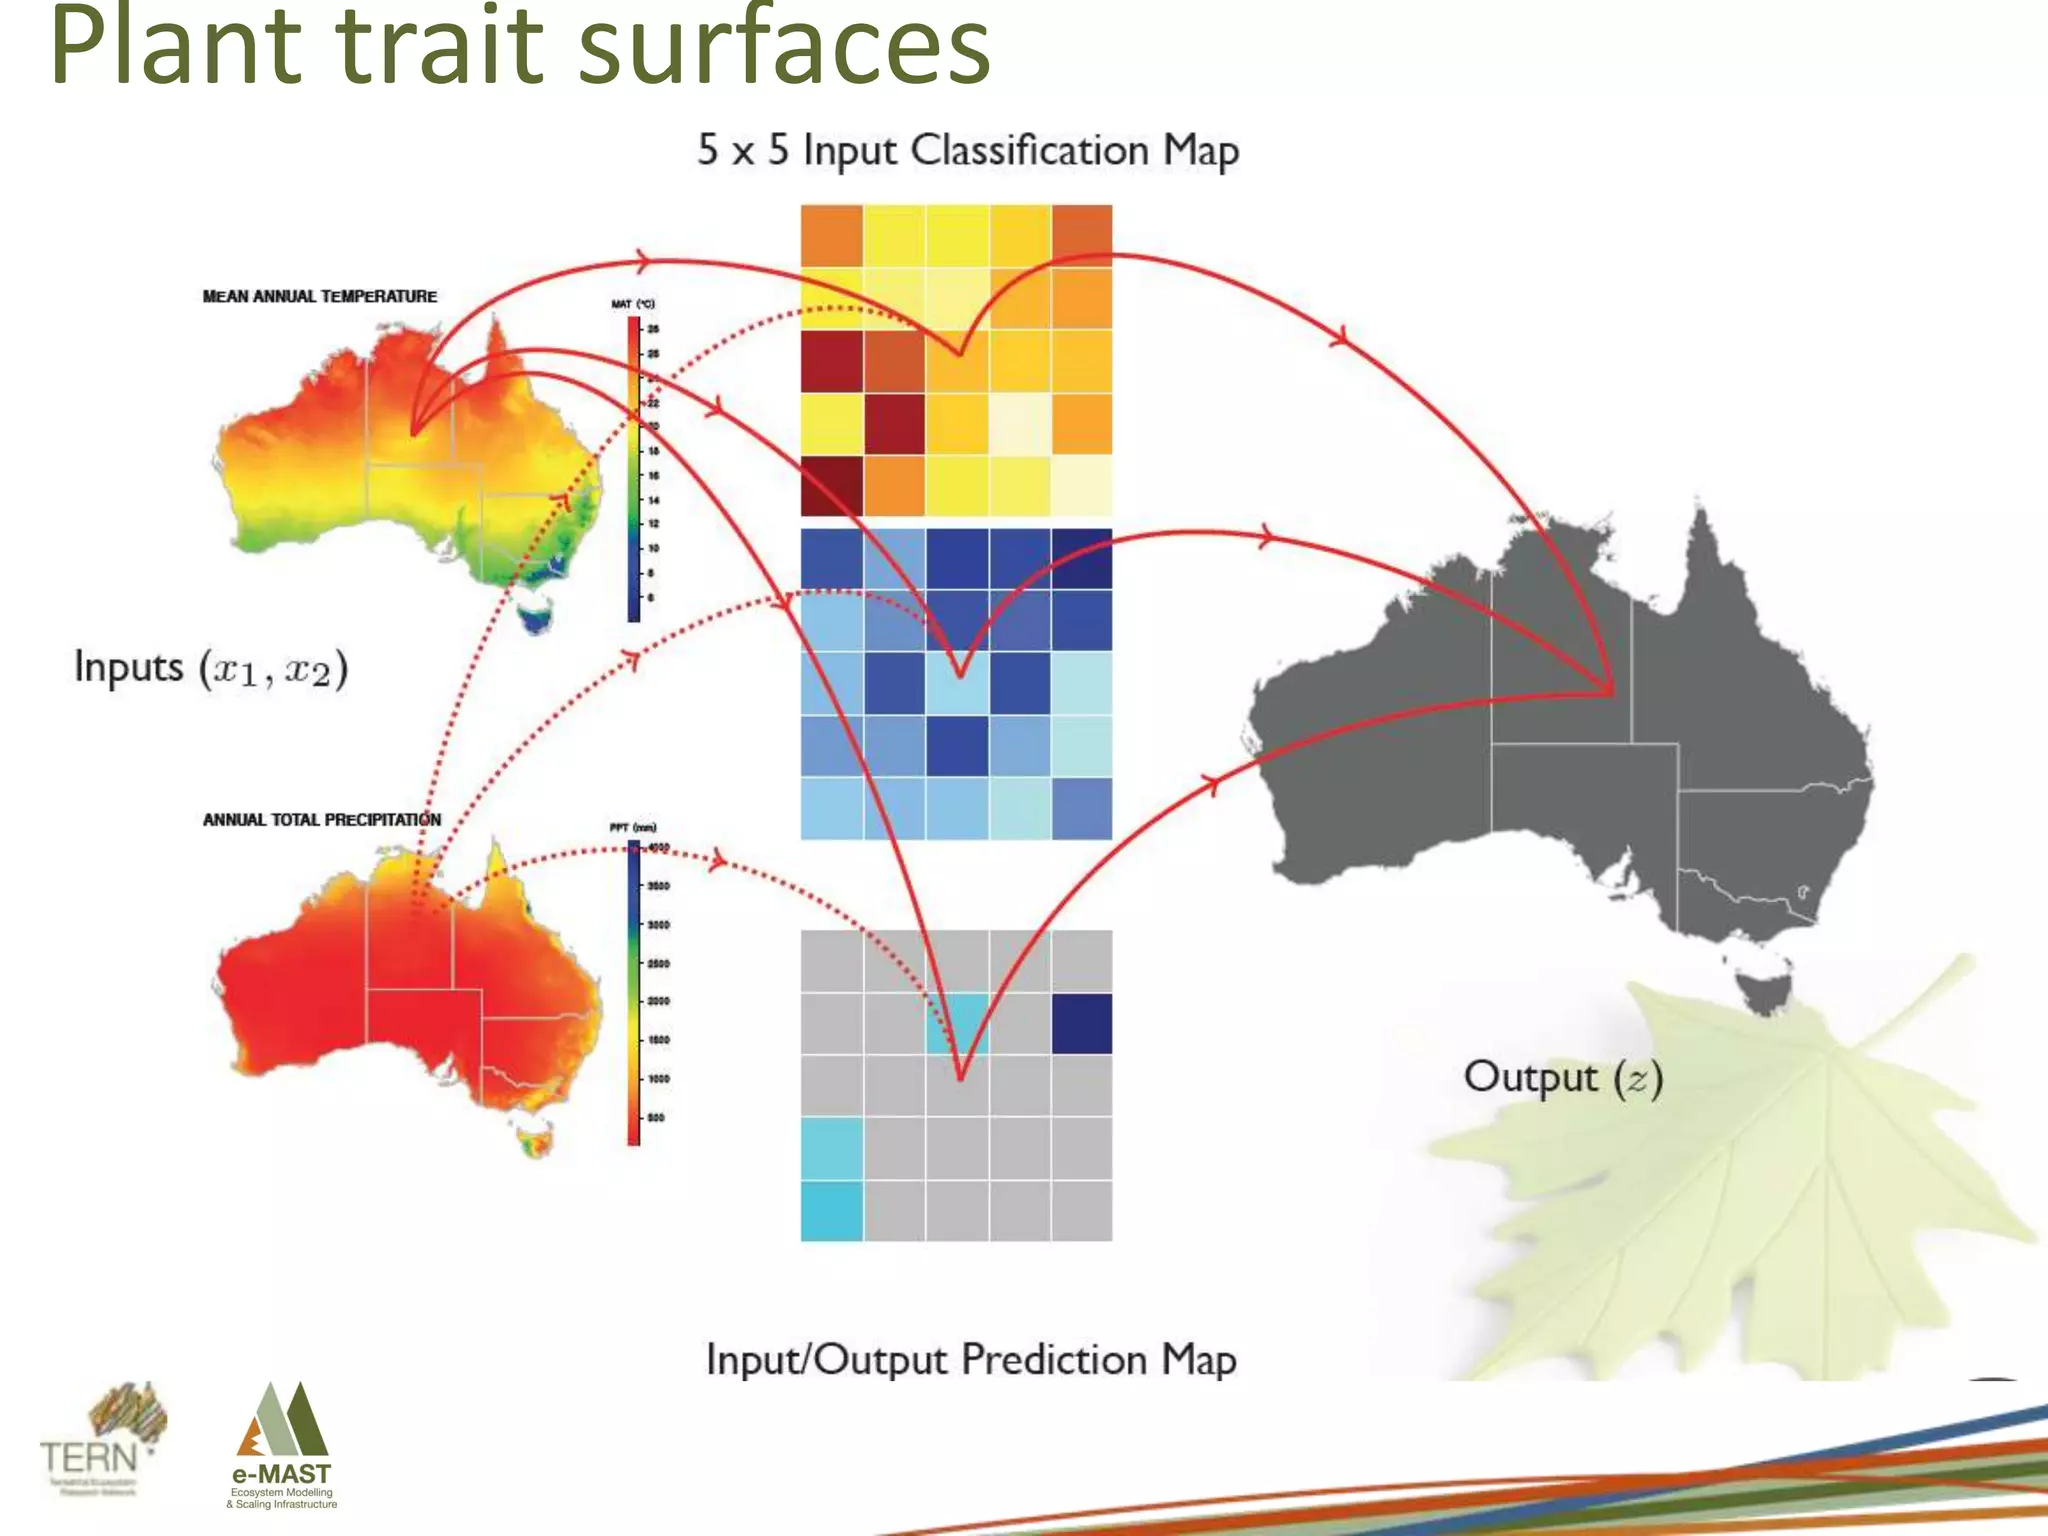

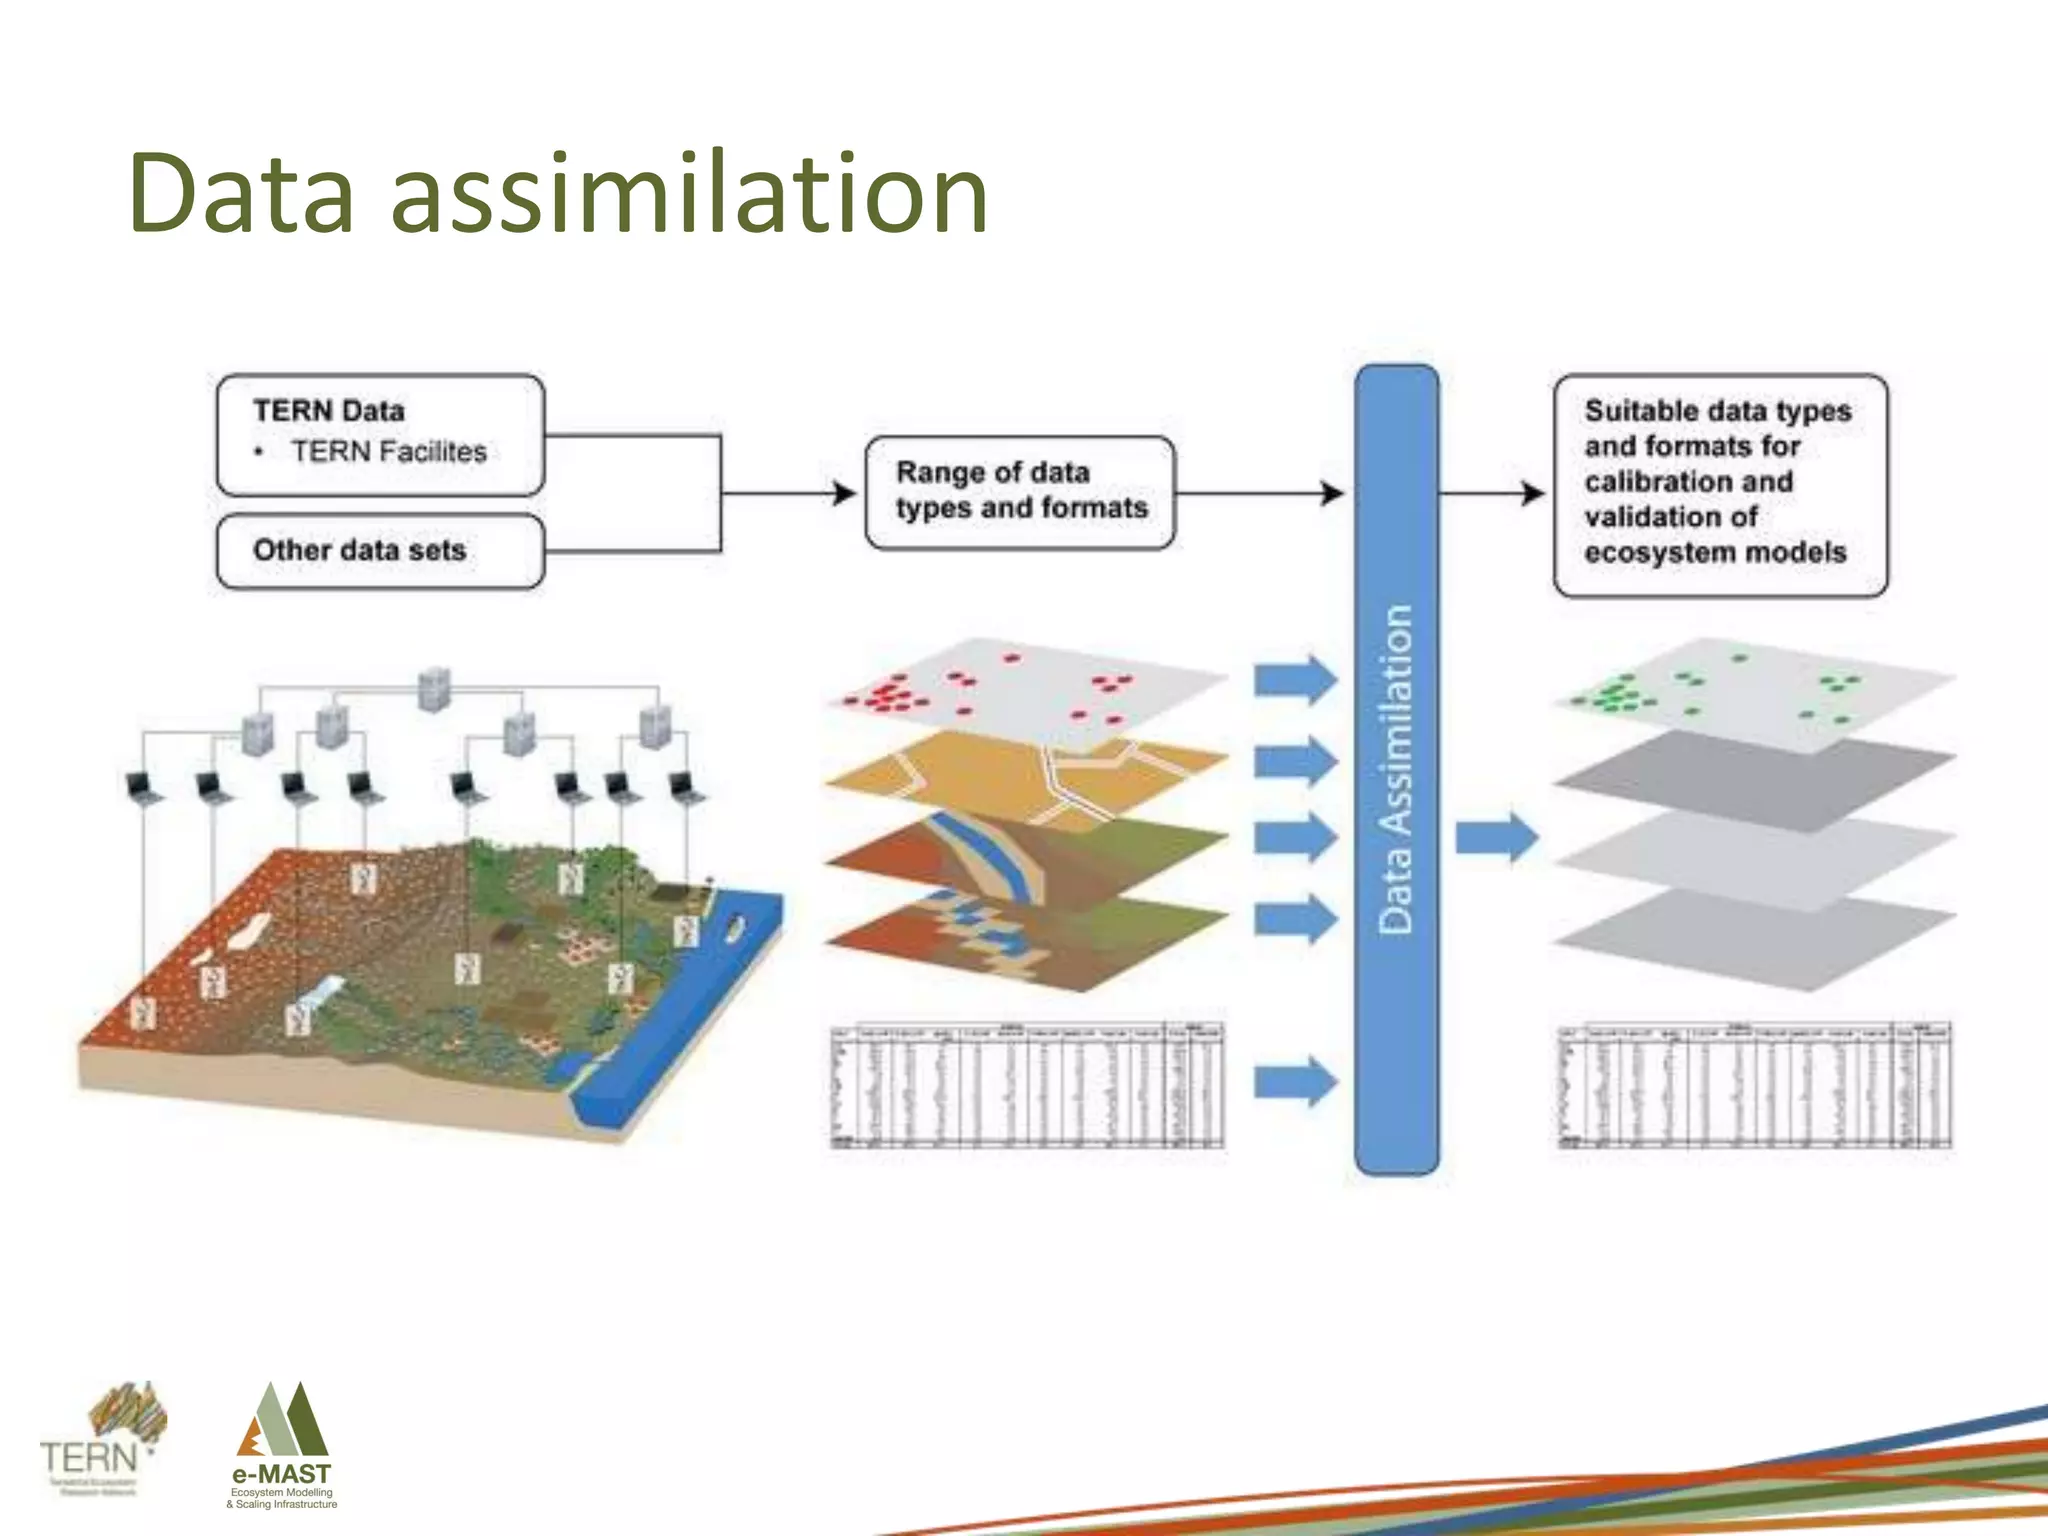


eMAST aims to integrate data from TERN and other sources to model ecosystems at all scales in Australia from 2013-2015. This will be done using data assimilation, model evaluation and optimization tools to further ecosystem science and help address questions about topics like carbon, water, climate change, fire, and biodiversity. Key products being delivered include high resolution climate and productivity datasets as well as tools for data analysis, interpolation and modeling. Progress includes the development and delivery of ANUClimate climate datasets and the ePiSaT model for estimating primary productivity across Australia using flux tower and satellite data.


![Coded Agents – with UiPath SDK + LangGraph [Virtual Hands-on Workshop]](https://cdn.slidesharecdn.com/ss_thumbnails/codedagentsdeck-251215155422-5497c599-thumbnail.jpg?width=640&height=640&fit=bounds)

