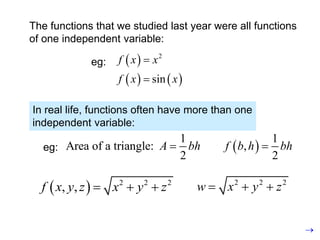
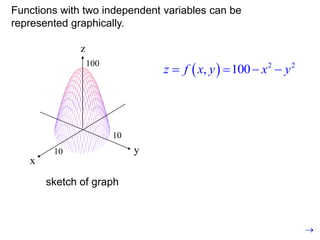
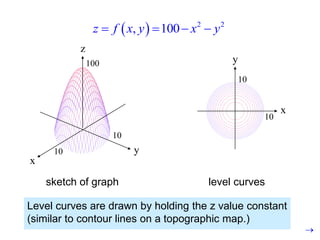
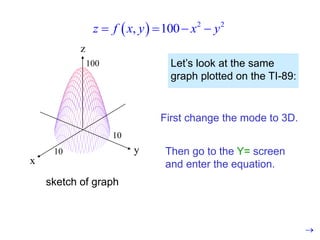
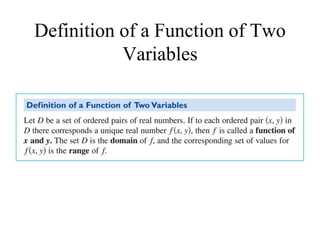
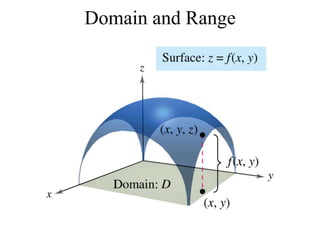
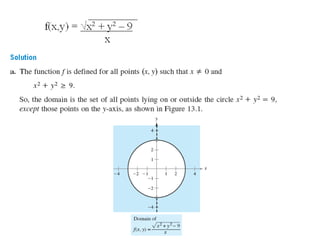
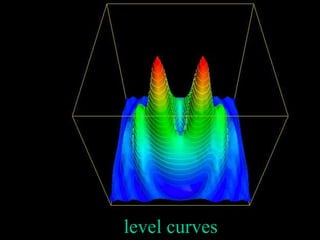
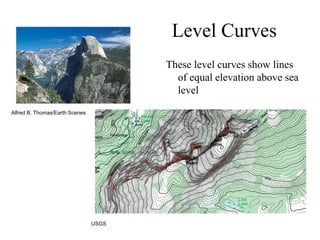
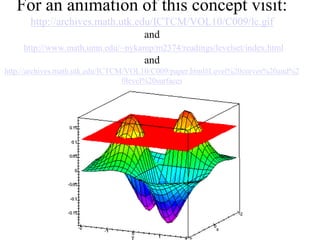
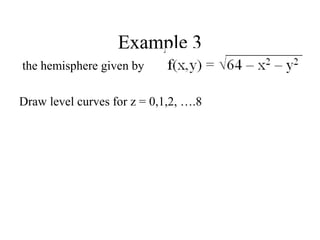
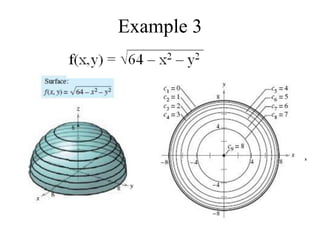
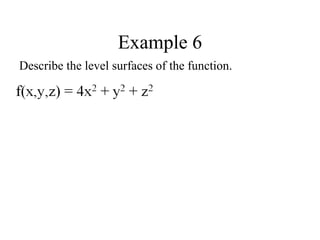
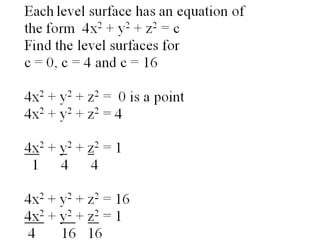
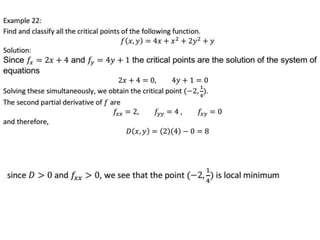
The functions that we studied last year were all functions
of one independent variable:
eg:  
   
2
sin
f x x
f x x


In real life, functions often have more than one
independent variable:
eg:
1
Area of a triangle:
2
A bh
  
1
,
2
f b h bh

  2 2 2
, ,
f x y z x y z
   2 2 2
w x y z
  

y
x
z
  2 2
, 100
z f x y x y
   
10
10
100
sketch of graph

Functions with two independent variables can be
represented graphically.
y
x
z
  2 2
, 100
z f x y x y
   
x
y
10
10
10
10
100
sketch of graph level curves
Level curves are drawn by holding the z value constant
(similar to contour lines on a topographic map.)

y
x
z
  2 2
, 100
z f x y x y
   
10
10
100
sketch of graph
Let’s look at the same
graph plotted on the TI-89:
First change the mode to 3D.
Then go to the Y= screen
and enter the equation.

Definition of a Function of Two
Variables
Domain and Range
Example 1 a
Find the domain of the function:
(Solution on next slide)
level curves
Level Curves
These level curves show lines
of equal elevation above sea
level
Alfred B. Thomas/Earth Scenes
USGS
For an animation of this concept visit:
http://archives.math.utk.edu/ICTCM/VOL10/C009/lc.gif
and
http://www.math.umn.edu/~nykamp/m2374/readings/levelset/index.html
and
http://archives.math.utk.edu/ICTCM/VOL10/C009/paper.html#Level%20curves%20and%2
0level%20surfaces
Example 3
the hemisphere given by
Draw level curves for z = 0,1,2, ….8
Example 3
x
Example 6
Describe the level surfaces of the function.
Example 6
Describe the level surfaces of
the function.
Level surfaces also be depicted
as follows:
Examples of level surfaces:
19
Definition of Continuity of a single variable
• A function is continuous at a point x = c
if the following three conditions are met
1. f(c) is defined
2.
3.
lim ( ) exists
lim ( ) ( )
x c
x c
f x
f x f c



x = c
Partial and Total derivatives
For a function of two variables 𝒈(𝒙, 𝒚) ,
the partial derivative with respect to 𝒙 is written
Stationary Points (Critical point)
• A stationary point of one variable function,𝒇(𝒙) is a point
where the derivative of that function 𝑑𝑓/𝑑𝑥 = 0
• means the slope of the function at this point is zero
• For a differentiable multivariable function, a point where
all the partial derivatives are zero
• Means that the gradient of the function at this point is
zero.
Nature of a Critical point
functions-of-several-variables.ppt

functions-of-several-variables.ppt

  • 2.
    The functions thatwe studied last year were all functions of one independent variable: eg:       2 sin f x x f x x   In real life, functions often have more than one independent variable: eg: 1 Area of a triangle: 2 A bh    1 , 2 f b h bh    2 2 2 , , f x y z x y z    2 2 2 w x y z    
  • 3.
    y x z   22 , 100 z f x y x y     10 10 100 sketch of graph  Functions with two independent variables can be represented graphically.
  • 4.
    y x z   22 , 100 z f x y x y     x y 10 10 10 10 100 sketch of graph level curves Level curves are drawn by holding the z value constant (similar to contour lines on a topographic map.) 
  • 5.
    y x z   22 , 100 z f x y x y     10 10 100 sketch of graph Let’s look at the same graph plotted on the TI-89: First change the mode to 3D. Then go to the Y= screen and enter the equation. 
  • 6.
    Definition of aFunction of Two Variables
  • 7.
  • 8.
    Example 1 a Findthe domain of the function: (Solution on next slide)
  • 10.
  • 11.
    Level Curves These levelcurves show lines of equal elevation above sea level Alfred B. Thomas/Earth Scenes USGS
  • 12.
    For an animationof this concept visit: http://archives.math.utk.edu/ICTCM/VOL10/C009/lc.gif and http://www.math.umn.edu/~nykamp/m2374/readings/levelset/index.html and http://archives.math.utk.edu/ICTCM/VOL10/C009/paper.html#Level%20curves%20and%2 0level%20surfaces
  • 13.
    Example 3 the hemispheregiven by Draw level curves for z = 0,1,2, ….8
  • 14.
  • 15.
    Example 6 Describe thelevel surfaces of the function.
  • 17.
    Example 6 Describe thelevel surfaces of the function. Level surfaces also be depicted as follows:
  • 18.
  • 19.
    19 Definition of Continuityof a single variable • A function is continuous at a point x = c if the following three conditions are met 1. f(c) is defined 2. 3. lim ( ) exists lim ( ) ( ) x c x c f x f x f c    x = c
  • 33.
    Partial and Totalderivatives For a function of two variables 𝒈(𝒙, 𝒚) , the partial derivative with respect to 𝒙 is written
  • 38.
    Stationary Points (Criticalpoint) • A stationary point of one variable function,𝒇(𝒙) is a point where the derivative of that function 𝑑𝑓/𝑑𝑥 = 0 • means the slope of the function at this point is zero • For a differentiable multivariable function, a point where all the partial derivatives are zero • Means that the gradient of the function at this point is zero.
  • 40.
    Nature of aCritical point