Download to read offline


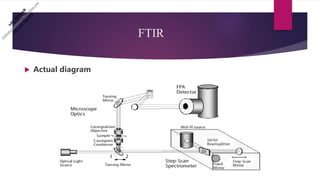

The document discusses Fourier transform infrared spectroscopy (FTIR). It provides a brief history of FTIR, noting its development in the 1940s and initial applications in organic chemistry and petrochemistry. It explains that FTIR uses an interferometer to measure all infrared frequencies simultaneously, rather than individually as with dispersive instruments. The document outlines several FTIR techniques and principles, such as how the absorption of infrared radiation corresponds to molecular bonds, and describes the basic working of FTIR through interferometry and Fourier transformation to produce spectra for material identification.