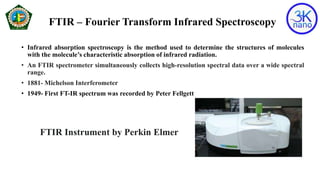
Material Characterisation Technique
FTIR Spectroscopy
Presented By: Bhawna Vermani
(Ph.D. in Nanotechnology 2nd Year)
NANOTECHNOLOGY (BASICS TO ADVANCED) Batch-III
Guru Jambheshwar University of Science and Technology, Hisar
FTIR – Fourier Transform Infrared Spectroscopy
• Infrared absorption spectroscopy is the method used to determine the structures of molecules
with the molecule’s characteristic absorption of infrared radiation.
• An FTIR spectrometer simultaneously collects high-resolution spectral data over a wide spectral
range.
• 1881- Michelson Interferometer
• 1949- First FT-IR spectrum was recorded by Peter Fellgett
FTIR Instrument by Perkin Elmer
Infrared Waves
Infrared radiation is a relatively low energy light in the
electromagnetic spectrum which has wavelength above red visible
light in range of 780nm and 1mm.
Molecular Vibration
• When exposed to infrared radiation, sample molecules selectively absorb radiation of specific
wavelengths which causes the change of dipole moment of sample molecules.
• Consequently, molecular vibration takes place between the bonds. Each bond requires
different frequency for absorption. Hence, characteristic peak is observed for every
functional group or compositions.
• The intensity of absorption peaks is related to the change of dipole moment and the
possibility of the transition of energy levels.
Selection Rule for FTIR
• Dipole moment as a polar bond is usually IR active. The non-polar bond in a symmetrical
molecule will absorb weakly or not at all.
Example: Hydrogen bonds, sulphide bonds, amines, alkaline etc.
• The IR energies correspond to the energies of bond stretching to excite the electrons to the
new quantum level.
Applications of FTIR
• Qualitative Analysis (via wavenumber)
• Quantitative Analysis (via Intensity)
Dispersive Spectrometer Vs FTIR
 Faster Data Collection due to simultaneous analysis in time domain
 Great spectral quality
 High data collection speed as the scan time of all frequencies is short
 The signal-to-noise ratio of spectrum is significantly higher
 The accuracy of wavenumber is high. The error is within the range of ±
0.01 cm-1.
Principle of FTIR
• Michelson interferometer is the core of FTIR
instrument and is used to split one beam of light
into two so that the paths of the two beams are
different.
• The beam splitter is designed to transmit half of the
light and reflect half of the light. Subsequently, the
transmitted light and the reflected light strike the
stationary mirror and the movable mirror,
respectively.
• When reflected back by the mirrors, two beams of
light recombine with each other at the beam splitter.
Then the Michelson interferometer recombines the
two and conducts them into the detector where the
difference of the intensity of these two beams are
measured as a function of the difference of the
paths.
• Fourier Transform of the time signal converts it into
frequency domain and represents all the peaks.
Block Diagram of FTIR
Hooke’s Law and Wavenumber
The frequency wavenumber depends upon the force constant and the reduced mass
with Hooke’s Law which is given as:
𝝑 =
𝟏
𝟐𝝅𝒄
𝒌
𝝁
Where,
𝝑 is wave number (1/λ) 4,000 to 400 cm -1
k is force constant
𝝁 is reduced mass which is given as average of two mass
Hooke’s Law and Wavenumber
• Hydrogen bonds have smaller mass (μ), so they lie on high wavenumber side.
• Bonds with increasing s character, needs high energy to vibrate as force constant
(k) is high, bond strength is high. Therefore, wave number for
Triple Bonds> Double Bonds> Single Bonds
• Fingerprint region consists of all metallic bonds and halogen bonds.
Methodology
• KBr Pellet acts as a carrier as it does not show any absorption because it has
100% transmittance in the IR region (4000-400 cm-1) with electronegativity
of 2.0 based on the Pauling scale.
• Potassium Bromide (KBr) Pellet formation with KBr: Sample = 1000:1
• For liquid samples and to avoid time cumbersome sample preparation
technique Attenuated total reflection (ATR) mode is preferred in which direct
measurement of samples for FTIR is feasible.
• ATR method involves pressing the sample against a high-refractive-index
prism which measures the changes that occur in a totally internally reflected
infrared beam after getting in contact with the sample.
FTIR Spectrum
• Fourier Transform Infrared Spectroscopy (FTIR) identifies
chemical bonds in a molecule by producing an infrared
absorption spectrum. The spectra produce a profile of the
sample, a distinctive molecular fingerprint that can be used
to screen and scan samples for many different components.
• The x-axis—or horizontal axis—represents the infrared
spectrum, which plots the intensity of infrared spectra.
• The y-axis—or vertical axis—represents the amount of
infrared light transmitted or absorbed by the sample
material being analyzed.
• We make use of the ORIGIN software to analyze the FTIR
spectrum. With the help of this programme, we processes the
spectrum and mark the peaks with their wavenumbers to
distinguish the various functional groups, which further
reveal information about the sample's composition.
FTIR Spectrum
FTIR Spectrum Analysis
• According to the reactions and composition of the sample, the wavenumbers may get shift. However, the
reference wavenumber for some standard functional groups are below:
WAVENUMBER (cm-1) Functional Group
4000-3000 cm-1 O-H, N-H stretching
3000-2500 cm-1 C-H, S-H stretching
2400-2000 cm-1 O=C=O stretching (2349), CΞN, CΞC stretching (2260-2190), N=N=N stretching
(2160-2120), C=C=O (2150), C=C=C stretching (2000-1900), C=C=N stretching
(2000)
2000-1650 cm-1 C=O stretching (1818), C=N stretching (1690-1640)
1670-1600 cm-1 C=C stretching (1650-1600), N-H bending (1650-1580)
1600-1300 cm-1 N-O stretching (1550-1500), C-H bending
1400-1000 cm-1 O-H bending, S=O stretching, C-F stretching, O-H bending, S=O stretching, C-N
stretching, C-O stretching
1000-650 cm-1 C=C bending, C-Cl stretching, C-Br stretching, C-I stretching
900-700 cm-1 C-H bending
Thank You

FT-IR Characterization Lecture note.pdf

  • 1.
    Material Characterisation Technique FTIRSpectroscopy Presented By: Bhawna Vermani (Ph.D. in Nanotechnology 2nd Year) NANOTECHNOLOGY (BASICS TO ADVANCED) Batch-III Guru Jambheshwar University of Science and Technology, Hisar
  • 2.
    FTIR – FourierTransform Infrared Spectroscopy • Infrared absorption spectroscopy is the method used to determine the structures of molecules with the molecule’s characteristic absorption of infrared radiation. • An FTIR spectrometer simultaneously collects high-resolution spectral data over a wide spectral range. • 1881- Michelson Interferometer • 1949- First FT-IR spectrum was recorded by Peter Fellgett FTIR Instrument by Perkin Elmer
  • 3.
    Infrared Waves Infrared radiationis a relatively low energy light in the electromagnetic spectrum which has wavelength above red visible light in range of 780nm and 1mm.
  • 4.
    Molecular Vibration • Whenexposed to infrared radiation, sample molecules selectively absorb radiation of specific wavelengths which causes the change of dipole moment of sample molecules. • Consequently, molecular vibration takes place between the bonds. Each bond requires different frequency for absorption. Hence, characteristic peak is observed for every functional group or compositions. • The intensity of absorption peaks is related to the change of dipole moment and the possibility of the transition of energy levels.
  • 5.
    Selection Rule forFTIR • Dipole moment as a polar bond is usually IR active. The non-polar bond in a symmetrical molecule will absorb weakly or not at all. Example: Hydrogen bonds, sulphide bonds, amines, alkaline etc. • The IR energies correspond to the energies of bond stretching to excite the electrons to the new quantum level. Applications of FTIR • Qualitative Analysis (via wavenumber) • Quantitative Analysis (via Intensity)
  • 6.
    Dispersive Spectrometer VsFTIR  Faster Data Collection due to simultaneous analysis in time domain  Great spectral quality  High data collection speed as the scan time of all frequencies is short  The signal-to-noise ratio of spectrum is significantly higher  The accuracy of wavenumber is high. The error is within the range of ± 0.01 cm-1.
  • 7.
    Principle of FTIR •Michelson interferometer is the core of FTIR instrument and is used to split one beam of light into two so that the paths of the two beams are different. • The beam splitter is designed to transmit half of the light and reflect half of the light. Subsequently, the transmitted light and the reflected light strike the stationary mirror and the movable mirror, respectively. • When reflected back by the mirrors, two beams of light recombine with each other at the beam splitter. Then the Michelson interferometer recombines the two and conducts them into the detector where the difference of the intensity of these two beams are measured as a function of the difference of the paths. • Fourier Transform of the time signal converts it into frequency domain and represents all the peaks. Block Diagram of FTIR
  • 8.
    Hooke’s Law andWavenumber The frequency wavenumber depends upon the force constant and the reduced mass with Hooke’s Law which is given as: 𝝑 = 𝟏 𝟐𝝅𝒄 𝒌 𝝁 Where, 𝝑 is wave number (1/λ) 4,000 to 400 cm -1 k is force constant 𝝁 is reduced mass which is given as average of two mass
  • 9.
    Hooke’s Law andWavenumber • Hydrogen bonds have smaller mass (μ), so they lie on high wavenumber side. • Bonds with increasing s character, needs high energy to vibrate as force constant (k) is high, bond strength is high. Therefore, wave number for Triple Bonds> Double Bonds> Single Bonds • Fingerprint region consists of all metallic bonds and halogen bonds.
  • 10.
    Methodology • KBr Pelletacts as a carrier as it does not show any absorption because it has 100% transmittance in the IR region (4000-400 cm-1) with electronegativity of 2.0 based on the Pauling scale. • Potassium Bromide (KBr) Pellet formation with KBr: Sample = 1000:1 • For liquid samples and to avoid time cumbersome sample preparation technique Attenuated total reflection (ATR) mode is preferred in which direct measurement of samples for FTIR is feasible. • ATR method involves pressing the sample against a high-refractive-index prism which measures the changes that occur in a totally internally reflected infrared beam after getting in contact with the sample.
  • 11.
    FTIR Spectrum • FourierTransform Infrared Spectroscopy (FTIR) identifies chemical bonds in a molecule by producing an infrared absorption spectrum. The spectra produce a profile of the sample, a distinctive molecular fingerprint that can be used to screen and scan samples for many different components. • The x-axis—or horizontal axis—represents the infrared spectrum, which plots the intensity of infrared spectra. • The y-axis—or vertical axis—represents the amount of infrared light transmitted or absorbed by the sample material being analyzed. • We make use of the ORIGIN software to analyze the FTIR spectrum. With the help of this programme, we processes the spectrum and mark the peaks with their wavenumbers to distinguish the various functional groups, which further reveal information about the sample's composition. FTIR Spectrum
  • 12.
    FTIR Spectrum Analysis •According to the reactions and composition of the sample, the wavenumbers may get shift. However, the reference wavenumber for some standard functional groups are below: WAVENUMBER (cm-1) Functional Group 4000-3000 cm-1 O-H, N-H stretching 3000-2500 cm-1 C-H, S-H stretching 2400-2000 cm-1 O=C=O stretching (2349), CΞN, CΞC stretching (2260-2190), N=N=N stretching (2160-2120), C=C=O (2150), C=C=C stretching (2000-1900), C=C=N stretching (2000) 2000-1650 cm-1 C=O stretching (1818), C=N stretching (1690-1640) 1670-1600 cm-1 C=C stretching (1650-1600), N-H bending (1650-1580) 1600-1300 cm-1 N-O stretching (1550-1500), C-H bending 1400-1000 cm-1 O-H bending, S=O stretching, C-F stretching, O-H bending, S=O stretching, C-N stretching, C-O stretching 1000-650 cm-1 C=C bending, C-Cl stretching, C-Br stretching, C-I stretching 900-700 cm-1 C-H bending
  • 13.