Downloaded 323 times


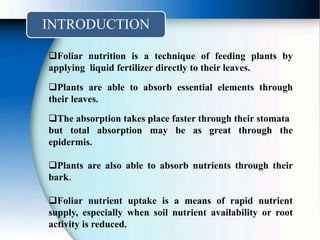
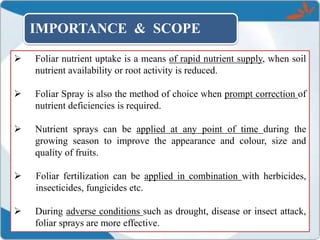
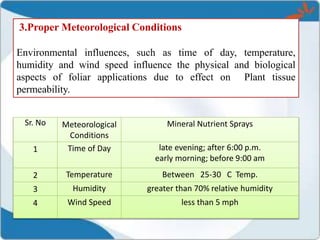
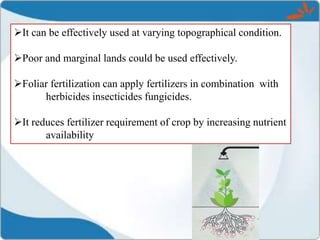


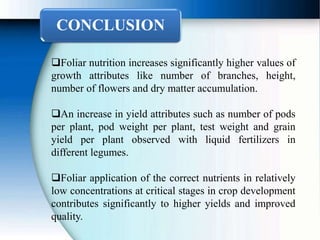

Foliar nutrition involves applying liquid fertilizers directly to plant leaves for faster nutrient absorption, serving as a rapid supply method when soil nutrients are limited. This technique can enhance yield by 12% to 25% and is especially effective in adverse conditions, though it also requires careful consideration of timing and environmental conditions to avoid leaf damage. The use of foliar fertilizers supplements rather than replaces soil fertilization, addressing deficiencies efficiently among various crops.